

The DOI matches its Crossref record; 64 of the 64 references it cites were found in a registry or an index.
Progression of Parkinson's Disease Pathology Is Reproduced by Intragastric Administration of Rotenone in Mice
Open accessAbstract
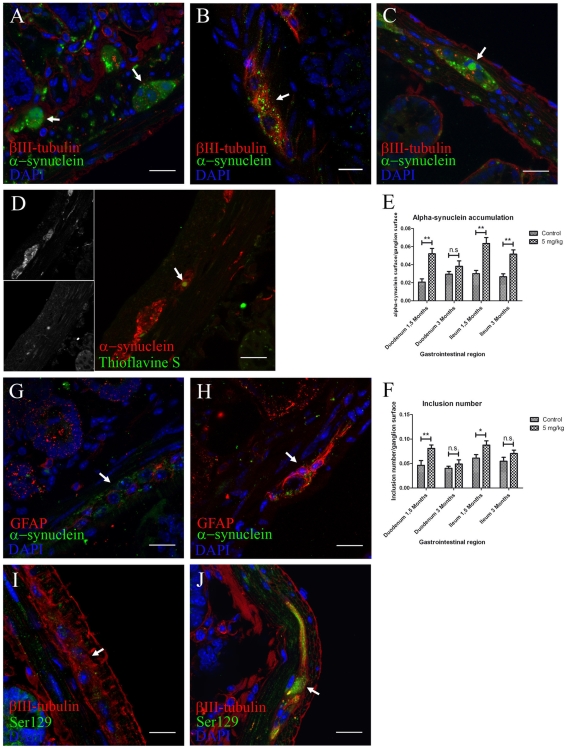
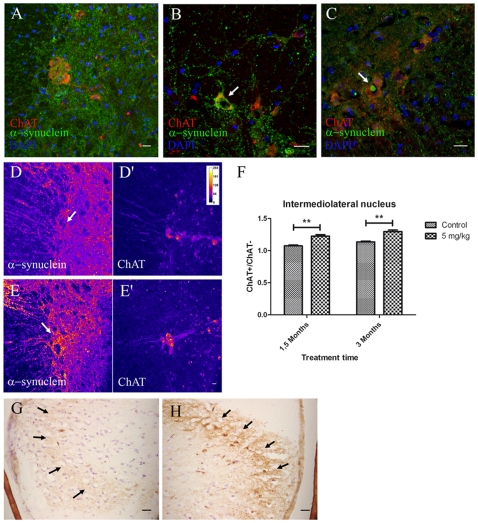
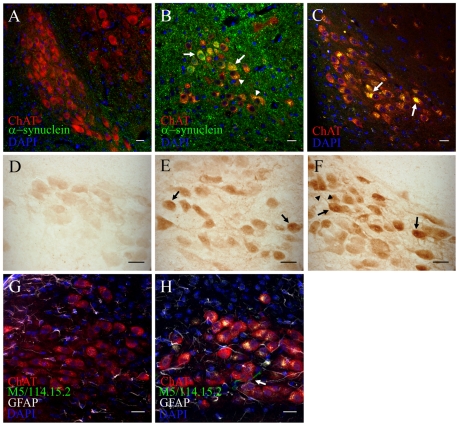
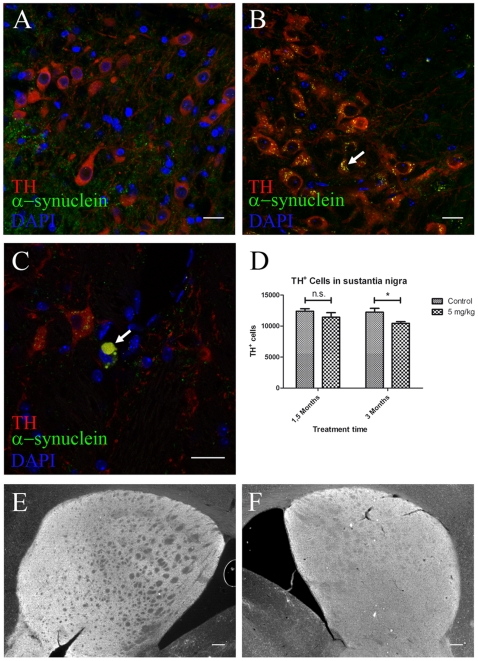
In patients with Parkinson's disease (PD), the associated pathology follows a characteristic pattern involving inter alia the enteric nervous system (ENS), the dorsal motor nucleus of the vagus (DMV), the intermediolateral nucleus of the spinal cord and the substantia nigra, providing the basis for the neuropathological staging of the disease. Here we report that intragastrically administered rotenone, a commonly used pesticide that inhibits Complex I of the mitochondrial respiratory chain, is able to reproduce PD pathological staging as found in patients. Our results show that low doses of chronically and intragastrically administered rotenone induce alpha-synuclein accumulation in all the above-mentioned nervous system structures of wild-type mice. Moreover, we also observed inflammation and alpha-synuclein phosphorylation in the ENS and DMV. HPLC analysis showed no rotenone levels in the systemic blood or the central nervous system (detection limit [rotenone]<20 nM) and mitochondrial Complex I measurements showed no systemic Complex I inhibition after 1.5 months of treatment. These alterations are sequential, appearing only in synaptically connected nervous structures, treatment time-dependent and accompanied by inflammatory signs and motor dysfunctions. These results strongly suggest that the local effect of pesticides on the ENS might be sufficient to induce PD-like progression and to reproduce the neuroanatomical and neurochemical features of PD staging. It provides new insight into how environmental factors could trigger PD and suggests a transsynaptic mechanism by which PD might spread throughout the central nervous system.
Overview
The claims and statistics of this paper haven’t been checked yet.
Run the check — free, no account needed. It reads the open-access text and checks the sources it cites.
Integrity signals
Registry
Cites
Statistics
Figures
Verification
Claims the paper makes
The claims and statistics of this paper haven’t been checked yet.
Run the check — free, no account needed. It reads the open-access text and checks the sources it cites.
Claims other papers make about this one
Each is checked against this paper’s own text: does it say what the citing paper says it does?
In the citing paper
“Rotenone (a pesticide) administered intragastrically in mice (5 mg/kg, 5 days a week, up to 3 months) induced accumulation of α-synuclein in several structures of the nervous system (i.e., dorsal motor nucleus of the vagus, intermediolateral nucleus of the spinal cord, the substantia nigra) along with inflammation and α-synuclein phosphorylation in the ENS and the dorsal motor nucleus of the vagus”
From The Role of Microbiota-Gut-Brain Axis in Neuropsychiatric and Neurological Disorders (2021) · cites this paper as [405]
Self-check
Percentages, sums and reported differences re-computed from the paper’s own numbers.
The self-check needs the paper’s full text.
Citations
Cites
Spillantini, M. G., Schmidt, M. L., Lee, V. M.-Y., Trojanowski, J. Q., Jakes, R., & Goedert, M. (1997) · Nature · doi:10.1038/42166 · Cited by 8,382
Self-citationMutation in the α-Synuclein Gene Identified in Families with Parkinson's Disease
Polymeropoulos, M. H., Lavedan, C., Leroy, E., Ide, S. E., Dehejia, A., Dutra, A., Pike, B., Root, H., Rubenstein, J., Boyer, R., et al. (1997) · Science · doi:10.1126/science.276.5321.2045 · Cited by 8,240
The functional anatomy of basal ganglia disorders
Albin, R. L., Young, A. B., & Penney, J. B. (1989) · Trends in Neurosciences · doi:10.1016/0166-2236(89)90074-x · Cited by 5,353
Mutations in the parkin gene cause autosomal recessive juvenile parkinsonism
Kitada, T., Asakawa, S., Hattori, N., Matsumine, H., Yamamura, Y., Minoshima, S., Yokochi, M., Mizuno, Y., & Shimizu, N. (1998) · Nature · doi:10.1038/33416 · Cited by 5,227
Chronic systemic pesticide exposure reproduces features of Parkinson's disease
Betarbet, R. S., Sherer, T., MacKenzie, G. M., Garcia‐Osuna, M., Panov, A. V., & Greenamyre, J. T. (2000) · Nature Neuroscience · doi:10.1038/81834 · Cited by 3,770
West, M. J., Slomianka, L., & Gundersen, H. J. G. (1991) · The Anatomical Record · doi:10.1002/ar.1092310411 · Cited by 2,994
GUNDERSEN, H. J. G., BENDTSEN, T. F., KORBO, L., MARCUSSEN, N., MØLLER, A., NIELSEN, K., NYENGAARD, J. R., PAKKENBERG, B., SØRENSEN, F. B., VESTERBY, A., et al. (1988) · APMIS · doi:10.1111/j.1699-0463.1988.tb05320.x · Cited by 2,929
Cloning of the Gene Containing Mutations that Cause PARK8-Linked Parkinson's Disease
Paisán‐Ruiz, C., Jain, S., Evans, E. W., Gilks, W. P., Simón, J., van der Brug, M., de Munaín, A. L., Aparicio, S. F., Gil, A. M., Khan, N. L., et al. (2004) · Neuron · doi:10.1016/j.neuron.2004.10.023 · Cited by 2,453
α-Synuclein is phosphorylated in synucleinopathy lesions
Fujiwara, H., Hasegawa, M., Dohmae, N., Kawashima, A., Masliah, E., Goldberg, M. S., Shen, J., Takio, K., & Iwatsubo, T. (2002) · Nature Cell Biology · doi:10.1038/ncb748 · Cited by 2,174
Oxidative stress in Parkinson's disease
Jenner, P. (2003) · Annals of Neurology · doi:10.1002/ana.10483 · Cited by 2,053
Cited by
Sorted by citations
Rotenone, Paraquat, and Parkinson’s Disease
Tanner, C. M., Kamel, F., Ross, G. W., Hoppin, J. A., Goldman, S. M., Korell, M., Marras, C., Bhudhikanok, G. S., Kasten, M., Chade, A. R., et al. (2011) · Environmental Health Perspectives · doi:10.1289/ehp.1002839 · Cited by 1,565
-Synuclein in Parkinson's Disease
Stefanis, L. (2012) · Cold Spring Harbor Perspectives in Medicine · doi:10.1101/cshperspect.a009399 · Cited by 1,446
Kim, S., Kwon, S.-H., Kam, T.-I., Panicker, N., Karuppagounder, S. S., Lee, S., Lee, J. H., Kim, W. R., Kook, M., Foss, C. A., et al. (2019) · Neuron · doi:10.1016/j.neuron.2019.05.035 · Cited by 1,397
Goedert, M., Spillantini, M. G., Del Tredici, K., & Braak, H. (2013) · Nature Reviews Neurology · doi:10.1038/nrneurol.2012.242 · Cited by 1,190
Self-citationUnger, M. M., Spiegel, J., Dillmann, K.-U., Grundmann, D., Philippeit, H., Bürmann, J., Faßbender, K., Schwiertz, A., & Schäfer, K.-H. (2016) · Parkinsonism & Related Disorders · doi:10.1016/j.parkreldis.2016.08.019 · Cited by 1,159
The Role of Microbiota-Gut-Brain Axis in Neuropsychiatric and Neurological Disorders
Socała, K., Doboszewska, U., Szopa, A., Serefko, A., Włodarczyk, M., Zielińska, A., Poleszak, E., Fichna, J., & Wlaź, P. (2021) · Pharmacological Research · doi:10.1016/j.phrs.2021.105840 · Cited by 857
Vagotomy and subsequent risk of Parkinson's disease
Svensson, E., Horváth‐Puhó, E., Thomsen, R. W., Djurhuus, J. C., Pedersen, L., Borghammer, P., & Sørensen, H. T. (2015) · Annals of Neurology · doi:10.1002/ana.24448 · Cited by 806
Duty, S., & Jenner, P. G. (2011) · British Journal of Pharmacology · doi:10.1111/j.1476-5381.2011.01426.x · Cited by 796
Parkinson disease: from pathology to molecular disease mechanisms
Dexter, D. T., & Jenner, P. G. (2013) · Free Radical Biology and Medicine · doi:10.1016/j.freeradbiomed.2013.01.018 · Cited by 751
Gut microbes and metabolites as modulators of blood-brain barrier integrity and brain health
Parker, A., Fonseca, S., & Carding, S. R. (2019) · Gut Microbes · doi:10.1080/19490976.2019.1638722 · Cited by 745
The bowel and beyond: The enteric nervous system in neurological disorders
Rao, M., & Gershon, M. D. (2016) · Nature Reviews Gastroenterology & Hepatology · doi:10.1038/nrgastro.2016.107 · Cited by 629
Schulz-Schaeffer, W. J. (2010) · Acta Neuropathologica · doi:10.1007/s00401-010-0711-0 · Cited by 627
The gut-brain axis: is intestinal inflammation a silent driver of Parkinson’s disease pathogenesis?
Houser, M. C., & Tansey, M. G. (2017) · npj Parkinson's Disease · doi:10.1038/s41531-016-0002-0 · Cited by 588
Zhao, Z., Ning, J., Bao, X.-Q., Shang, M., Ma, J., Li, G., & Zhang, D. (2021) · Microbiome · doi:10.1186/s40168-021-01107-9 · Cited by 616
Pathogenesis of Parkinson disease—the gut–brain axis and environmental factors
Klingelhoefer, L., & Reichmann, H. (2015) · Nature Reviews Neurology · doi:10.1038/nrneurol.2015.197 · Cited by 598
Self-citationNeurotoxin-based models of Parkinson's disease
Bové, J., & Perier, C. (2011) · Neuroscience · doi:10.1016/j.neuroscience.2011.10.057 · Cited by 534
Classic and New Animal Models of Parkinson's Disease
Blesa, J., Phani, S., Jackson-Lewis, V. R., & Przedborski, S. (2012) · BioMed Research International · doi:10.1155/2012/845618 · Cited by 533
Dysphagia in Parkinson’s Disease
Suttrup, I., & Warnecke, T. (2015) · Dysphagia · doi:10.1007/s00455-015-9671-9 · Cited by 510
Role of TLR4 in the gut-brain axis in Parkinson's disease: A translational study from men to mice
Perez-Pardo, P., Dodiya, H. B., Engen, P. A., Forsyth, C. B., Huschens, A. M., Shaikh, M., Voigt, R. M., Naqib, A., Green, S. J., Kordower, J. H., et al. (2019) · Gut · doi:10.1136/gutjnl-2018-316844 · Cited by 467
Parkinson’s disease: animal models and dopaminergic cell vulnerability
Blesa, J., & Przedborski, S. (2014) · Frontiers in Neuroanatomy · doi:10.3389/fnana.2014.00155 · Cited by 515
Parkinson's Disease and the Environment
Ball, N., Teo, W., Chandra, S., & Chapman, J. (2019) · Frontiers in Neurology · doi:10.3389/fneur.2019.00218 · Cited by 521
Wagner, J., Ryazanov, S., Leonov, A., Levin, J., Shi, S., Schmidt, F., Prix, C., Pan-Montojo, F. J., Bertsch, U., Mitteregger-Kretzschmar, G., et al. (2013) · Acta Neuropathologica · doi:10.1007/s00401-013-1114-9 · Cited by 469
Self-citationVagotomy and Parkinson disease: A Swedish register–based matched-cohort study
Liu, B., Fang, F., Pedersen, N. L., Tillander, A., Ludvigsson, J. F., Ekbom, A., Svenningsson, P., Chen, H., & Wirdefeldt, K. (2017) · Neurology · doi:10.1212/wnl.0000000000003961 · Cited by 447
The propagation of prion-like protein inclusions in neurodegenerative diseases
Goedert, M., Clavaguera, F., & Tolnay, M. (2010) · Trends in Neurosciences · doi:10.1016/j.tins.2010.04.003 · Cited by 472
Astrocytic modulation of blood brain barrier: perspectives on Parkinson’s disease
Cabezas, R., Ávila, M. F., González, J., El-Bachá, R. D. S., Báez-Jurado, E., García‐Segura, L. M., Jurado-Coronel, J. C., Capani, F., Cardona‐Gómez, G. P., & Barreto, G. E. (2014) · Frontiers in Cellular Neuroscience · doi:10.3389/fncel.2014.00211 · Cited by 481
Reactive astrocytes in neurodegenerative diseases
Li, K., Li, J., Zheng, J., & Qin, S. (2019) · Aging and disease · doi:10.14336/ad.2018.0720 · Cited by 398
Brain-First versus Gut-First Parkinson’s Disease: A Hypothesis
Borghammer, P., & Van Den Berge, N. (2019) · Journal of Parkinson’s Disease · doi:10.3233/jpd-191721 · Cited by 419
Fecal Microbiota Transplantation in Neurological Disorders
Vendrik, K. E. W., Ooijevaar, R. E., de Jong, P. R. C., Laman, J. D., van Oosten, B. W., van Hilten, J. J., Ducarmon, Q. R., Keller, J. J., Kuijper, E. J., & Contarino, M. F. (2020) · Frontiers in Cellular and Infection Microbiology · doi:10.3389/fcimb.2020.00098 · Cited by 413
Pan-Montojo, F., Schwarz, M., Winkler, C., Arnhold, M., O'Sullivan, G. A., Pal, A., Said, J., Marsico, G., Verbavatz, J.-M., Rodrigo-Angulo, M., et al. (2012) · Scientific Reports · doi:10.1038/srep00898 · Cited by 405
Self-citationReview: Sporadic Parkinson's disease: development and distribution ofα‐synuclein pathology
Tredici, K. D., & Braak, H. (2015) · Neuropathology and Applied Neurobiology · doi:10.1111/nan.12298 · Cited by 416
Exploring Braak’s hypothesis of Parkinson’s disease
Rietdijk, C. D., Perez-Pardo, P., Garssen, J., van Wezel, R. J. A., & Kraneveld, A. D. (2017) · Frontiers in Neurology · doi:10.3389/fneur.2017.00037 · Cited by 395
Parkinson's Disease and Alpha Synuclein: Is Parkinson's Disease a Prion‐Like Disorder?
Olanow, C. W., & Brundin, P. (2013) · Movement Disorders · doi:10.1002/mds.25373 · Cited by 404
Braak, H., & Del Tredici, K. (2017) · Journal of Parkinson’s Disease · doi:10.3233/jpd-179001 · Cited by 372
Neuroprotective effects of hydrogen sulfide on Parkinson’s disease rat models
Hu, L., Lu, M., Tiong, C. X., Dawe, G. S., Hu, G., & Bian, J. (2010) · Aging Cell · doi:10.1111/j.1474-9726.2009.00543.x · Cited by 365
Alzheimer’s pathogenesis: is there neuron-to-neuron propagation?
Braak, H., & Tredici, K. D. (2011) · Acta Neuropathologica · doi:10.1007/s00401-011-0825-z · Cited by 375
Pathological roles of α-synuclein in neurological disorders
Vekrellis, K., Xilouri, M., Emmanouilidou, E., Rideout, H. J., & Stefanis, L. (2011) · The Lancet Neurology · doi:10.1016/s1474-4422(11)70213-7 · Cited by 382
Targeting Microglial Activation States as a Therapeutic Avenue in Parkinson’s Disease
Subramaniam, S., & Federoff, H. J. (2017) · Frontiers in Aging Neuroscience · doi:10.3389/fnagi.2017.00176 · Cited by 353
Hilton, D., Stephens, M., Kirk, L., Edwards, P., Potter, R., Zajicek, J., Broughton, E., Hagan, H., & Carroll, C. (2014) · Acta Neuropathologica · doi:10.1007/s00401-013-1214-6 · Cited by 345
Johnson, M., & Bobrovskaya, L. (2014) · NeuroToxicology · doi:10.1016/j.neuro.2014.12.002 · Cited by 344
Kelly, L. P., Carvey, P. M., Keshavarzian, A., Shannon, K. M., Shaikh, M., Bakay, R. A. E., & Kordower, J. H. (2014) · Movement Disorders · doi:10.1002/mds.25736 · Cited by 308
Knudsen, K., Fedorova, T. D., Hansen, A. K., Sommerauer, M., Otto, M., Svendsen, K. B., Nahimi, A., Stokholm, M. G., Pavese, N., Beier, C. P., et al. (2018) · The Lancet Neurology · doi:10.1016/s1474-4422(18)30162-5 · Cited by 309
Van Den Berge, N., Ferreira, N., Gram, H., Mikkelsen, T. W., Alstrup, A. K. O., Casadei, N., Tsung-Pin, P., Riess, O., Nyengaard, J. R., Tamgüney, G., et al. (2019) · Acta Neuropathologica · doi:10.1007/s00401-019-02040-w · Cited by 300
The hallmarks of P arkinson's disease
Antony, P. M. A., Diederich, N. J., Krüger, R., & Balling, R. (2013) · FEBS Journal · doi:10.1111/febs.12335 · Cited by 317
α-Synuclein pathology in Parkinson’s disease and related α-synucleinopathies
Henderson, M. X., Trojanowski, J. Q., & Lee, V. M. ‐. (2019) · Neuroscience Letters · doi:10.1016/j.neulet.2019.134316 · Cited by 301
Are synucleinopathies prion-like disorders?
Angot, E., Steiner, J. A., Hansen, C., Li, J.-Y., & Brundin, P. (2010) · The Lancet Neurology · doi:10.1016/s1474-4422(10)70213-1 · Cited by 251
The prion hypothesis in Parkinson's disease: braak to the future
Visanji, N. P., Brooks, P. L., Hazrati, L.-N., & Lang, A. E. (2013) · Acta Neuropathologica Communications · doi:10.1186/2051-5960-1-2 · Cited by 278
Non-motor Parkinson's: integral to motor Parkinson's, yet often neglected
Todorova, A., Jenner, P. G., & Chaudhuri, К. R. (2014) · Practical Neurology · doi:10.1136/practneurol-2013-000741 · Cited by 247
Nicotine as a potential neuroprotective agent for Parkinson's disease
Quik, M., Perez, X. A., & Bordia, T. (2012) · Movement Disorders · doi:10.1002/mds.25028 · Cited by 254
Unexpected Roles for the Second Brain: Enteric Nervous System as Master Regulator of Bowel Function
Schneider, S., Wright, C. M., & Heuckeroth, R. O. (2018) · Annual Review of Physiology · doi:10.1146/annurev-physiol-021317-121515 · Cited by 239
Inflammation and α-Synuclein’s Prion-like Behavior in Parkinson's Disease—Is There a Link?
Tomé, C. M. L., Tyson, T., Rey, N. L., Grathwohl, S. A., Britschgi, M., & Brundin, P. (2012) · Molecular Neurobiology · doi:10.1007/s12035-012-8267-8 · Cited by 247
The Microbiome as a Modifier of Neurodegenerative Disease Risk
Fang, P., Kazmi, S. A., Jameson, K. G., & Hsiao, E. Y. (2020) · Cell Host & Microbe · doi:10.1016/j.chom.2020.06.008 · Cited by 226
Parkinson’s disease from the gut
Liddle, R. A. (2018) · Brain Research · doi:10.1016/j.brainres.2018.01.010 · Cited by 228
Environmental Exposures and Parkinson’s Disease
Nandipati, S., & Litvan, I. (2016) · International Journal of Environmental Research and Public Health · doi:10.3390/ijerph13090881 · Cited by 219
Rethinking biorational insecticides for pest management: unintended effects and consequences
Haddi, K., Turchen, L. M., Jumbo, L. O. V., Guedes, R. N. C., Pereira, E. J. G., Aguiar, R. W. D. S., & de Oliveira, E. E. (2020) · Pest Management Science · doi:10.1002/ps.5837 · Cited by 216
Advancement in the modelling and therapeutics of Parkinson’s disease
Nand, S., & Singh, P. (2020) · Journal of Chemical Neuroanatomy · doi:10.1016/j.jchemneu.2020.101752 · Cited by 214
Calabresi, P., Castrioto, A., Filippo, M. D., & Picconi, B. (2013) · The Lancet Neurology · doi:10.1016/s1474-4422(13)70118-2 · Cited by 216
Xiong, N., Long, X., Xiong, J., Jia, M., Chen, C., Huang, J., Ghoorah, D., Kong, X., Lin, Z., & Wang, T. (2012) · Critical Reviews in Toxicology · doi:10.3109/10408444.2012.680431 · Cited by 202
The Gut-Brain Axis in Parkinson’s Disease: Possibilities for Food-Based Therapies
Perez-Pardo, P., Kliest, T., Dodiya, H. B., Broersen, L. M., Garssen, J., Keshavarzian, A., & Kraneveld, A. D. (2017) · European Journal of Pharmacology · doi:10.1016/j.ejphar.2017.05.042 · Cited by 203
The Threshold Theory for Parkinson's Disease
Engelender, S., & Ole Isacson, A. (2016) · Trends in Neurosciences · doi:10.1016/j.tins.2016.10.008 · Cited by 196
Gut–brain axis and the spread of α‐synuclein pathology: Vagal highway or dead end?
Breen, D. P., Halliday, G. M., & Lang, A. E. (2019) · Movement Disorders · doi:10.1002/mds.27556 · Cited by 193
Neurotoxic in vivo models of Parkinson’s disease
Cannon, J. R., & Greenamyre, J. T. (2010) · Progress in brain research · doi:10.1016/s0079-6123(10)84002-6 · Cited by 198
Animal models of Parkinson's disease
Jackson-Lewis, V. R., Blesa, J., & Przedborski, S. (2011) · Parkinsonism & Related Disorders · doi:10.1016/s1353-8020(11)70057-8 · Cited by 199
Yang, X., Qian, Y., Xu, S., Song, Y., & Xiao, Q. (2018) · Frontiers in Aging Neuroscience · doi:10.3389/fnagi.2017.00441 · Cited by 173
Neuroinflammation and Parkinson’s Disease—From Neurodegeneration to Therapeutic Opportunities
Araújo, B., Caridade-Silva, R., Soares-Guedes, C., Martins‐Macedo, J., Gomes, E. D., Monteiro, S., & Teixeira, F. G. (2022) · Cells · doi:10.3390/cells11182908 · Cited by 209
Lewy pathology and neurodegeneration in premotor Parkinson's disease
Tredici, K. D., & Braak, H. (2012) · Movement Disorders · doi:10.1002/mds.24921 · Cited by 187
Choi, W.-S., Palmiter, R. D., & Xia, Z. (2011) · Journal of Cell Biology · doi:10.1083/jcb.201009132 · Cited by 183
Alpha-synuclein spreading in Parkinson’s disease
Recasens, A., & Dehay, B. (2014) · Frontiers in Neuroanatomy · doi:10.3389/fnana.2014.00159 · Cited by 192
Neuropathobiology of non-motor symptoms in Parkinson disease
Jellinger, K. A. (2015) · Journal of Neural Transmission · doi:10.1007/s00702-015-1405-5 · Cited by 186
Does Parkinson’s disease start in the gut?
Lionnet, A., Leclair‐Visonneau, L., Neunlist, M., Murayama, S., Takao, M., Adler, C. H., Derkinderen, P., & Beach, T. G. (2017) · Acta Neuropathologica · doi:10.1007/s00401-017-1777-8 · Cited by 186
Synaptic failure and α‐synuclein
Calò, L., Węgrzynowicz, M., Santivañez‐Perez, J., & Spillantini, M. G. (2016) · Movement Disorders · doi:10.1002/mds.26479 · Cited by 179
Self-citationThe Role of the Gut Microbiota in the Pathogenesis of Parkinson's Disease
Yang, D., Zhao, D., Ali Shah, S. Z., Wu, W., Lai, M., Zhang, X., Li, J., Guan, Z., Zhao, H., Li, W., et al. (2019) · Frontiers in Neurology · doi:10.3389/fneur.2019.01155 · Cited by 162
Spinal cord lesions in sporadic Parkinson’s disease
Tredici, K. D., & Braak, H. (2012) · Acta Neuropathologica · doi:10.1007/s00401-012-1028-y · Cited by 169
Autoimmunity in Parkinson's Disease: The Role of α-Synuclein-Specific T Cells
Garretti, F., Agalliu, D., Arlehamn, C. S. L., Sette, A., & Sulzer, D. (2019) · Frontiers in Immunology · doi:10.3389/fimmu.2019.00303 · Cited by 171
Preventing Parkinson’s Disease: An Environmental Agenda
Miranda, B. R. D., Goldman, S. M., Miller, G. W., Greenamyre, J. T., & Dorsey, E. R. (2021) · Journal of Parkinson s Disease · doi:10.3233/jpd-212922 · Cited by 171
Extracellular Interactions of Alpha-Synuclein in Multiple System Atrophy
Valdinocci, D., Radford, R. A. W., Goulding, M., Hayashi, J., Chung, R. S., & Pountney, D. L. (2018) · International Journal of Molecular Sciences · doi:10.3390/ijms19124129 · Cited by 161
Delayed gastric emptying in Parkinson's disease
Marrinan, S. L., Emmanuel, A. V., & Burn, D. J. (2013) · Movement Disorders · doi:10.1002/mds.25708 · Cited by 160
Cai, L.-J., Tu, L., Huang, X.-M., Huang, J., Qiu, N., Xie, G., Liao, J.-X., Du, W., Zhang, Y., & Tian, J. (2020) · Molecular Brain · doi:10.1186/s13041-020-00656-8 · Cited by 156
The N-glycosylation of immunoglobulin G as a novel biomarker of Parkinson's disease
Russell, A. C., Šimurina, M., Garcia, M., Novokmet, M., Wang, Y., Rudan, I., Campbell, H. J., Lauc, G., Thomas, M. G., & Wang, W. (2017) · Glycobiology · doi:10.1093/glycob/cwx022 · Cited by 150
Enteric nervous system manifestations of neurodegenerative disease
Chalazonitis, A., & Rao, M. (2018) · Brain Research · doi:10.1016/j.brainres.2018.01.011 · Cited by 152
Weis, S., Schwiertz, A., Unger, M. M., Becker, A., Faßbender, K., Ratering, S., Kohl, M., Schnell, S., Schäfer, K.-H., & Egert, M. (2019) · npj Parkinson s Disease · doi:10.1038/s41531-019-0100-x · Cited by 145
Expression pattern and localization of alpha-synuclein in the human enteric nervous system
Böttner, M., Zorenkov, D., Hellwig, I., Barrenschee, M., Harde, J., Fricke, T., Deuschl, G., Egberts, J. D., Becker, T., Fritscher‐Ravens, A., et al. (2012) · Neurobiology of Disease · doi:10.1016/j.nbd.2012.07.018 · Cited by 140
Jin, J., Xu, Z., Zhang, L., Zhang, C. M., Zhao, X., Mao, Y., Zhang, H., Liang, X., Wu, J., Yang, Y., et al. (2023) · Gut Microbes · doi:10.1080/19490976.2023.2167172 · Cited by 151
Primary Skin Fibroblasts as a Model of Parkinson's Disease
Auburger, G. W. J., Klinkenberg, M., Drost, J., Marcus, K., Morales-Gordo, B., Kunz, W. S., Brandt, U., Broccoli, V., Reichmann, H., Gispert, S., et al. (2012) · Molecular Neurobiology · doi:10.1007/s12035-012-8245-1 · Cited by 146
Self-citationHow does parkinson's disease begin? Perspectives on neuroanatomical pathways, prions, and histology
Borghammer, P. (2017) · Movement Disorders · doi:10.1002/mds.27138 · Cited by 143
Zhao, Z., Li, F., Ning, J., Peng, R., Shang, J., Liu, H., Shang, M., Bao, X.-Q., & Zhang, D. (2021) · Acta Pharmaceutica Sinica B · doi:10.1016/j.apsb.2021.03.020 · Cited by 137
Using Rotenone to Model Parkinson’s Disease in Mice: A Review of the Role of Pharmacokinetics
Innos, J., & Hickey, M. A. (2021) · Chemical Research in Toxicology · doi:10.1021/acs.chemrestox.0c00522 · Cited by 134
Alpha‐synuclein in the appendiceal mucosa of neurologically intact subjects
Gray, M. T., Muñoz, D. G., Gray, D. A., Schlossmacher, M. G., & Woulfe, J. (2013) · Movement Disorders · doi:10.1002/mds.25779 · Cited by 136
Braak, H., & Tredici, K. D. (2016) · Cold Spring Harbor Perspectives in Biology · doi:10.1101/cshperspect.a023630 · Cited by 132
Metta, V., Leta, V., Mrudula, K. R., Prashanth, L. K., Goyal, V., Borgohain, R., Chung-Faye, G., & Chaudhuri, K. R. (2022) · Journal of Neurology · doi:10.1007/s00415-021-10567-w · Cited by 130
Gut-brain and brain-gut axis in Parkinson’s disease models: effects of a uridine and fish oil diet
Perez-Pardo, P., Dodiya, H. B., Broersen, L. M., Douna, H., van Wijk, N., Lopes da Silva, S., Garssen, J., Keshavarzian, A., & Kraneveld, A. D. (2018) · Nutritional Neuroscience · doi:10.1080/1028415x.2017.1294555 · Cited by 111
Khatri, D. K., & Juvekar, A. R. (2016) · Pharmacology Biochemistry and Behavior · doi:10.1016/j.pbb.2016.09.002 · Cited by 129
Peelaerts, W., Bousset, L., Baekelandt, V., & Melki, R. (2018) · Cell and Tissue Research · doi:10.1007/s00441-018-2839-5 · Cited by 128
In vivo gastric detection of α-synuclein inclusions in Parkinson's disease
Sánchez‐Ferro, Á., Rábano, A., Catalán, M. J., Rodríguez‐Valcárcel, F. C., Díez, S. F., Herreros‐Rodríguez, J., García‐Cobos, E., Álvarez‐Santullano, M. M., López‐Manzanares, L., Mosqueira, A. J., et al. (2015) · Movement Disorders · doi:10.1002/mds.25988 · Cited by 123
The gut-brain vascular axis in neuroinflammation
Carloni, S., & Rescigno, M. (2023) · Seminars in Immunology · doi:10.1016/j.smim.2023.101802 · Cited by 133
Animal models of Parkinson's disease: An updated overview
Gubellini, P., & Kachidian, P. (2015) · Revue Neurologique · doi:10.1016/j.neurol.2015.07.011 · Cited by 128
α-Synuclein in Parkinson’s disease: causal or bystander?
Riederer, P. F., Berg, D., Casadei, N., Cheng, F., Claßen, J., Dresel, C., Jost, W. H., Krüger, R., Müller, T. H., Reichmann, H., et al. (2019) · Journal of Neural Transmission · doi:10.1007/s00702-019-02025-9 · Cited by 122
Self-citationEtiology and Pathogenesis of Parkinson Disease
Schapira, A. H. V. (2009) · Neurologic Clinics · doi:10.1016/j.ncl.2009.04.004 · Cited by 120
The Gut-Brain Axis: Two Ways Signaling in Parkinson’s Disease
Dogra, N., Mani, R. J., & Katare, D. P. (2021) · Cellular and Molecular Neurobiology · doi:10.1007/s10571-021-01066-7 · Cited by 121
Barrenschee, M., Zorenkov, D., Böttner, M., Lange, C., Cossais, F., Scharf, A., Deuschl, G., Schneider, S. A., Ellrichmann, M., Fritscher‐Ravens, A., et al. (2017) · Acta Neuropathologica Communications · doi:10.1186/s40478-016-0408-2 · Cited by 118
The role of autophagy in Parkinson's disease: rotenone-based modeling
Xiong, N., Xiong, J., Jia, M., Liu, L., Zhang, X., Chen, Z., Huang, J., Zhang, Z., Hou, L., Luo, Z., et al. (2013) · Behavioral and Brain Functions · doi:10.1186/1744-9081-9-13 · Cited by 117
Metadata
- Authors
- Pan-Montojo, F., Anichtchik, O., Dening, Y., Knels, L., Pursche, S., Jung, R., Jackson, S., Gille, G., Spillantini, M. G., Reichmann, H., & Funk, R. H. W.
- Affiliations
- Max Planck Institute of Molecular Cell Biology and Genetics (DE)
- University of Cambridge (GB)
- Technische Universität Dresden (DE)
- Corresponding author
- Pan-Montojo, Francisco
- Funk, Richard H. W.
- ORCID
- Venue
- PLoS ONE
- Publisher
- Public Library of Science (PLoS)
- Published
- 2010-01-19
- Volume
- 5
- Issue
- 1
- Pages
- e8762
- ISSN
- 1932-6203 (ISSN-L)
- PMC
- PMC2808242
- OpenAlex
- W2293877091
- Cited by
- 524
- References
- 64
- Citations by year
- 2026: 12 · 2025: 23 · 2024: 18 · 2023: 28 · 2022: 40 · 2021: 43 · 2020: 41 · 2019: 46 · 2018: 31 · 2017: 44 · 2016: 35 · 2015: 32 · 2014: 33 · 2013: 29 · 2012: 37
- FWCI
- 18.13
- Type
- journal article
- Language
- en
- Open access
- gold
- doi.org
- Locations
- PLoS ONE (publishedVersion, cc-by)
- PubMed Central (publishedVersion, cc-by)
- PubMed (publishedVersion)
- DOAJ (DOAJ: Directory of Open Access Journals) (submittedVersion, cc-by-sa)
- Figshare (submittedVersion, cc-by)
- Funders
- Parkinson's UK (G-0701)
- Topics
- Health Sciences › Medicine › Clinical Neurology › Parkinson's Disease Mechanisms and Treatments
- Life Sciences › Biochemistry, Genetics and Molecular Biology › Molecular Biology › Nuclear Receptors and Signaling
- Life Sciences › Neuroscience › Neurology › Neuroinflammation and Neurodegeneration Mechanisms
- Keywords
- Parkinson's disease, rotenone, intragastric administration, alpha-synuclein accumulation, enteric nervous system, dorsal motor nucleus of the vagus, intermediolateral nucleus, substantia nigra, mitochondrial complex I inhibition, neuroinflammation, alpha-synuclein phosphorylation, pesticide exposure, disease staging, motor impairment, mouse model
- MeSH terms
- Animals, Chromatography, High Pressure Liquid, Disease Models, Animal, Mice, Inbred BALB C, Parkinson Disease, Rotenone, Stomach, Enteric Nervous System, Mice
About these checks
Registry, retraction, Cites and statistics results are computed, not judged, with one exception: a printed reference that no index lists is read once by a model before it counts as a citation error. Claims are extracted by a model and kept only when their quote appears verbatim in the text; each cited source is then checked, with a model’s help, for whether it says what the claim relies on. Those verdicts can be wrong — read the claim’s quote and the cited source before relying on one.
Statistics and arithmetic are recomputed, not judged.
Confidence bands are shown only for fields calibrated on our annotated test set. None is calibrated yet, so no band is shown.
What counts as a claim ›How we measure confidence ›How we check this ›
Are you an author, or do you see a problem with this page? Request a review
