

The DOI matches its Crossref record; 60 of the 60 references it cites were found in a registry or an index.
Imaging of Functional Connectivity in the Mouse Brain
Open accessAbstract
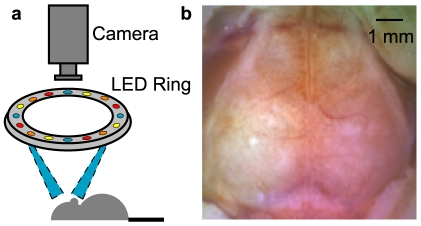
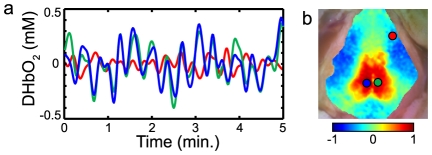
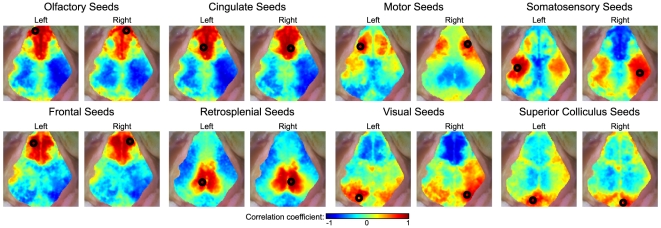
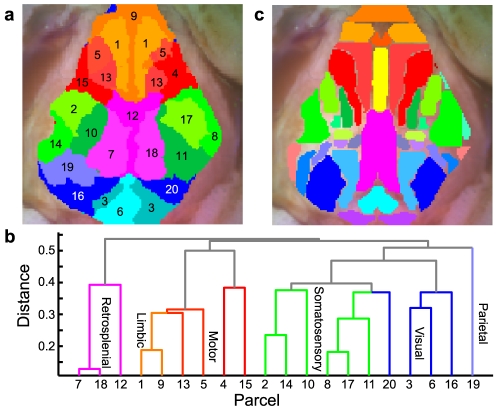
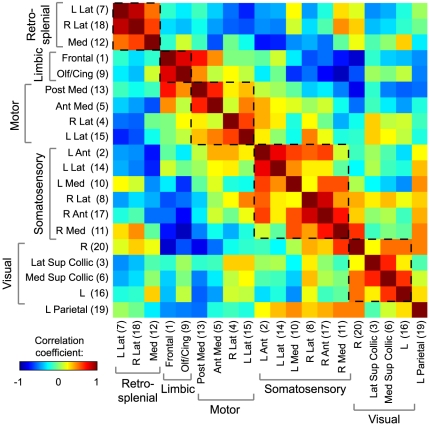
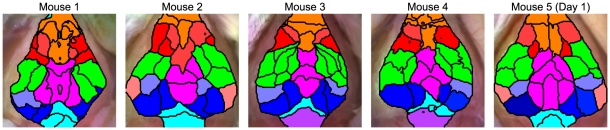
Functional neuroimaging (e.g., with fMRI) has been difficult to perform in mice, making it challenging to translate between human fMRI studies and molecular and genetic mechanisms. A method to easily perform large-scale functional neuroimaging in mice would enable the discovery of functional correlates of genetic manipulations and bridge with mouse models of disease. To satisfy this need, we combined resting-state functional connectivity mapping with optical intrinsic signal imaging (fcOIS). We demonstrate functional connectivity in mice through highly detailed fcOIS mapping of resting-state networks across most of the cerebral cortex. Synthesis of multiple network connectivity patterns through iterative parcellation and clustering provides a comprehensive map of the functional neuroarchitecture and demonstrates identification of the major functional regions of the mouse cerebral cortex. The method relies on simple and relatively inexpensive camera-based equipment, does not require exogenous contrast agents and involves only reflection of the scalp (the skull remains intact) making it minimally invasive. In principle, fcOIS allows new paradigms linking human neuroscience with the power of molecular/genetic manipulations in mouse models.
Overview
The claims and statistics of this paper haven’t been checked yet.
Run the check — free, no account needed. It reads the open-access text and checks the sources it cites.
Integrity signals
Registry
Cites
Statistics
Figures
Verification
Claims the paper makes
The claims and statistics of this paper haven’t been checked yet.
Run the check — free, no account needed. It reads the open-access text and checks the sources it cites.
Claims other papers make about this one
Each is checked against this paper’s own text: does it say what the citing paper says it does?
The cited source says what the claim attributes to it.
In the citing paper
“We have shown previously that fcOIS is a sensitive imaging modality capable of measuring functional connectivity between brain regions in healthy mice (White et al., 2011;Bero et al., 2012)”
From Anti-ApoE Antibody Given after Plaque Onset Decreases Aβ Accumulation and Improves Brain Function in a Mouse Model of Aβ Amyloidosis (2014) · cites this paper as White et al., 2011
The cited source says what the claim attributes to it.
In the citing paper
“Compared with PBS-treated mice, bilateral functional connectivity in the HJ6.3 group appeared to be more globally restored and to resemble that of healthy, wild-type mice (Fig. 7C), as described previously (White et al., 2011;Bero et al., 2012).”
From Anti-ApoE Antibody Given after Plaque Onset Decreases Aβ Accumulation and Improves Brain Function in a Mouse Model of Aβ Amyloidosis (2014) · cites this paper as White et al., 2011
The check wasn’t confident either way, so it gives no verdict — never disputed.
In the citing paper
“and that there is functional disruption in APP/PS1 mice after A deposition (White et al., 2011;Bero et al., 2012).”
From Anti-ApoE Antibody Given after Plaque Onset Decreases Aβ Accumulation and Improves Brain Function in a Mouse Model of Aβ Amyloidosis (2014) · cites this paper as White et al., 2011
Experimental — accuracy not yet measured
Self-check
Percentages, sums and reported differences re-computed from the paper’s own numbers.
The self-check needs the paper’s full text.
Citations
Cites
The Mouse Brain in Stereotaxic Coordinates
Paxinos, G. (2001) · Cited by 12,859
Functional connectivity in the motor cortex of resting human brain using echo‐planar mri
Biswal, B., Zerrin Yetkin, F., Haughton, V. M., & Hyde, J. S. (1995) · Magnetic Resonance in Medicine · doi:10.1002/mrm.1910340409 · Cited by 9,812
The Brain's Default Network: Anatomy, Function, and Relevance to Disease
Buckner, R. L., Andrews‐Hanna, J. R., & Schacter, D. L. (2008) · Annals of the New York Academy of Sciences · doi:10.1196/annals.1440.011 · Cited by 9,761
The human brain is intrinsically organized into dynamic, anticorrelated functional networks
Fox, M. D., Snyder, A. Z., Vincent, J. L., Corbetta, M., Van Essen, D. C., & Raichle, M. E. (2005) · Proceedings of the National Academy of Sciences · doi:10.1073/pnas.0504136102 · Cited by 8,553
Self-citationSpontaneous fluctuations in brain activity observed with functional magnetic resonance imaging
Fox, M. D., & Raichle, M. E. (2007) · Nature Reviews Neuroscience · doi:10.1038/nrn2201 · Cited by 6,700
Functional connectivity in the resting brain: a network analysis of the default mode hypothesis
Greicius, M. D., Krasnow, B., Reiss, A. L., & Menon, V. (2003) · Proceedings of the National Academy of Sciences · doi:10.1073/pnas.0135058100 · Cited by 6,358
Talairach, J., Tournoux, P., & Rayport, M. (1988) · Thieme eBooks · Cited by 5,058
Buckner, R. L., Sepulcre, J., Talukdar, T., Krienen, F. M., Liu, H., Hedden, T., Andrews-Hanna, J. R., Sperling, R. A., & Johnson, K. A. (2009) · The Journal of Neuroscience · doi:10.1523/jneurosci.5062-08.2009 · Cited by 2,862
Neurodegenerative Diseases Target Large-Scale Human Brain Networks
Seeley, W. W., Crawford, R. K., Zhou, J., Miller, B. L., & Greicius, M. D. (2009) · Neuron · doi:10.1016/j.neuron.2009.03.024 · Cited by 2,350
Resting-State Functional Connectivity Reflects Structural Connectivity in the Default Mode Network
Greicius, M. D., Supekar, K., Menon, V., & Dougherty, R. F. (2009) · Cerebral Cortex · doi:10.1093/cercor/bhn059 · Cited by 2,175
Research works printed but not linked: 5
- A Devor, 2003, Coupling of total hemoglobin concentration, oxygenation, and neural activity in rat somatosensory cortex., Neuron, 39, 353, 10.1016/S0896-6273(03)00403-3 · DOI · Paper page
- A Devor, 2005, Coupling of the cortical hemodynamic response to cortical and thalamic neuronal activity., PNAS, 102, 3822, 10.1073/pnas.0407789102 · DOI
- MD Fox, 2007, Spontaneous fluctuations in brain activity observed with functional magnetic resonance imaging., Nature Reviews Neuroscience, 8, 700, 10.1038/nrn2201 · DOI · Paper page
- MD Fox, 2009, The Global Signal and Observed Anticorrelated Resting State Brain Networks., Journal of Neurophysiology, 101, 3270, 10.1152/jn.90777.2008 · DOI · Paper page
- AK Dunn, 2005, Spatial extent of oxygen metabolism and hemodynamic changes during functional activation of the rat somatosensory cortex., NeuroImage, 27, 279, 10.1016/j.neuroimage.2005.04.024 · DOI · Paper page
Cited by
Sorted by citations
Structure and function of complex brain networks
Sporns, O. (2013) · Dialogues in Clinical Neuroscience · doi:10.31887/dcns.2013.15.3/osporns · Cited by 964
Circadian clock proteins regulate neuronal redox homeostasis and neurodegeneration
Musiek, E. S., Lim, M. M., Yang, G., Bauer, A. Q., Qi, L., Lee, Y., Roh, J. H., Ortiz-Gonzalez, X., Dearborn, J. T., Culver, J. P., et al. (2013) · Journal of Clinical Investigation · doi:10.1172/jci70317 · Cited by 524
Self-citationLi, L. S., Zhu, L., Ma, C., Lin, L., Yao, J., Wang, L., Maslov, K., Zhang, R., Chen, W., Shi, J., et al. (2017) · Nature Biomedical Engineering · doi:10.1038/s41551-017-0071 · Cited by 476
Spontaneous cortical activity alternates between motifs defined by regional axonal projections
Mohajerani, M. H., Chan, A. W., Mohsenvand, M. ‘., LeDue, J. M., Liu, R., McVea, D. A., Boyd, J. D., Wang, Y. T., Reimers, M., & Murphy, T. H. (2013) · Nature Neuroscience · doi:10.1038/nn.3499 · Cited by 375
Grandjean, J., Schroeter, A., Batata, I., & Rudin, M. (2014) · NeuroImage · doi:10.1016/j.neuroimage.2014.08.043 · Cited by 339
High-resolution photoacoustic tomography of resting-state functional connectivity in the mouse brain
Avanaki, K., Xia, J., Wan, H., Bauer, A. Q., Culver, J. P., & Wang, L. V. (2013) · Proceedings of the National Academy of Sciences · doi:10.1073/pnas.1311868111 · Cited by 350
Self-citationMateo, C., Knutsen, P. M., Tsai, P. S., Shih, A. Y., & Kleinfeld, D. (2017) · Neuron · doi:10.1016/j.neuron.2017.10.012 · Cited by 303
Raznahan, A., Lerch, J. P., Lee, N., Greenstein, D. K., Wallace, G. L., Stockman, M., CLASEN, L. S., Shaw, P. W., & Giedd, J. N. (2011) · Neuron · doi:10.1016/j.neuron.2011.09.028 · Cited by 304
Fluctuating and sensory-induced vasodynamics in rodent cortex extend arteriole capacity
Drew, P. J., Shih, A. Y., & Kleinfeld, D. (2011) · Proceedings of the National Academy of Sciences · doi:10.1073/pnas.1100428108 · Cited by 293
Circadian clock protein Rev-erbα regulates neuroinflammation
Griffin, P., Dimitry, J. M., Sheehan, P. W., Lananna, B. V., Guo, C., Robinette, M. L., Hayes, M. E., Cedeño, M. R., Nadarajah, C. J., Ezerskiy, L. A., et al. (2019) · Proceedings of the National Academy of Sciences · doi:10.1073/pnas.1812405116 · Cited by 263
Self-citationA brief history of the resting state: The Washington University perspective
Snyder, A. Z., & Raichle, M. E. (2012) · NeuroImage · doi:10.1016/j.neuroimage.2012.01.044 · Cited by 257
Self-citationLarge-scale topology and the default mode network in the mouse connectome
Stafford, J. M., Jarrett, B. R., Miranda-Dominguez, O., Mills, B. D., Cain, N., Mihalas, S., Lahvis, G. P., Lattal, K. M., Mitchell, S. H., David, S. V., et al. (2014) · Proceedings of the National Academy of Sciences · doi:10.1073/pnas.1404346111 · Cited by 229
Large-scale functional connectivity networks in the rodent brain
Gozzi, A., & Schwarz, A. J. (2015) · NeuroImage · doi:10.1016/j.neuroimage.2015.12.017 · Cited by 224
Mapping the mouse brain with rs-fMRI: an optimized pipeline for functional network identification
Zerbi, V., Grandjean, J., Rudin, M., & Wenderoth, N. (2015) · NeuroImage · doi:10.1016/j.neuroimage.2015.07.090 · Cited by 178
Intact skull chronic windows for mesoscopic wide-field imaging in awake mice
Silasi, G., Xiao, D., Vanni, M. P., Chen, A. C. N., & Murphy, T. H. (2016) · Journal of Neuroscience Methods · doi:10.1016/j.jneumeth.2016.04.012 · Cited by 209
Distributed BOLD and CBV-weighted resting-state networks in the mouse brain
Sforazzini, F., Schwarz, A. J., Galbusera, A., Bifone, A., & Gozzi, A. (2013) · NeuroImage · doi:10.1016/j.neuroimage.2013.09.050 · Cited by 207
Spontaneous Infra-slow Brain Activity Has Unique Spatiotemporal Dynamics and Laminar Structure
Mitra, A., Kraft, A., Wright, P., Acland, B., Snyder, A. Z., Rosenthal, Z., Czerniewski, L., Bauer, A., Snyder, L., Culver, J., et al. (2018) · Neuron · doi:10.1016/j.neuron.2018.03.015 · Cited by 193
Self-citationMatsui, T., Murakami, T., & Ohki, K. (2016) · Proceedings of the National Academy of Sciences · doi:10.1073/pnas.1521299113 · Cited by 194
Bidirectional Relationship between Functional Connectivity and Amyloid-β Deposition in Mouse Brain
Bero, A. W., Bauer, A. Q., Stewart, F. R., White, B. R., Cirrito, J. R., Raichle, M. E., Culver, J. P., & Holtzman, D. M. (2012) · The Journal of Neuroscience · doi:10.1523/jneurosci.5845-11.2012 · Cited by 181
Self-citationVanni, M. P., & Murphy, T. H. (2014) · Journal of Neuroscience · doi:10.1523/jneurosci.1818-14.2014 · Cited by 177
Simultaneous cortex-wide fluorescence Ca2+ imaging and whole-brain fMRI
Lake, E. M. R., Ge, X., Shen, X., Hermán, P., Hyder, F., Cardin, J. A., Higley, M. J., Scheinost, D., Papademetris, X., Crair, M. C., et al. (2020) · Nature Methods · doi:10.1038/s41592-020-00984-6 · Cited by 168
Simultaneous Low-Pass Filtering and Total Variation Denoising
Selesnick, I., Graber, H. L., Pfeil, D. S., & Barbour, R. L. (2014) · IEEE Transactions on Signal Processing · doi:10.1109/tsp.2014.2298836 · Cited by 160
Optical imaging of disrupted functional connectivity following ischemic stroke in mice
Bauer, A. Q., Kraft, A. W., Wright, P. W., Snyder, A. Z., Lee, J., & Culver, J. P. (2014) · NeuroImage · doi:10.1016/j.neuroimage.2014.05.051 · Cited by 148
Self-citationVanni, M. P., Chan, A. W., Balbi, M., Silasi, G., & Murphy, T. H. (2017) · Journal of Neuroscience · doi:10.1523/jneurosci.3560-16.2017 · Cited by 152
The State of Resting State Networks
Seitzman, B. A., Snyder, A. Z., Leuthardt, E. C., & Shimony, J. S. (2019) · Topics in Magnetic Resonance Imaging · doi:10.1097/rmr.0000000000000214 · Cited by 153
Self-citationMapping cortical mesoscopic networks of single spiking cortical or sub-cortical neurons
Xiao, D., Vanni, M. P., Mitelut, C., Chan, A. W., LeDue, J. M., Xie, Y., Chen, A. C. N., Swindale, N. V., & Murphy, T. H. (2017) · eLife · doi:10.7554/elife.19976 · Cited by 134
Liao, F., Hori, Y., Hudry, E., Bauer, A. Q., Jiang, H., Mahan, T. E., Lefton, K. B., Zhang, T. J., Dearborn, J. T., Kim, J., et al. (2014) · The Journal of Neuroscience · doi:10.1523/jneurosci.0646-14.2014 · Cited by 128
“3 and PBS using fcOIS (White et al., 2011; Bero et al., 2012).”
BackgroundMethodInfluentialSelf-citationHow networks communicate: propagation patterns in spontaneous brain activity
Mitra, A., & Raichle, M. E. (2016) · Philosophical Transactions of the Royal Society B Biological Sciences · doi:10.1098/rstb.2015.0546 · Cited by 118
Functional connectivity structure of cortical calcium dynamics in anesthetized and awake mice
Wright, P. W., Brier, L. M., Bauer, A. Q., Baxter, G. A., Kraft, A. W., Reisman, M. D., Bice, A. R., Snyder, A. Z., Lee, J., & Culver, J. P. (2017) · PLoS ONE · doi:10.1371/journal.pone.0185759 · Cited by 121
Self-citationDetection of functional connectivity in the resting mouse brain
Nasrallah, F. A., Tay, H. C., & Chuang, K. (2013) · NeuroImage · doi:10.1016/j.neuroimage.2013.10.025 · Cited by 110
Role of inhibitory control in modulating focal seizure spread
Liou, J.-Y., Ma, H., Wenzel, M., Zhao, M., Baird-Daniel, E., Smith, E. H., Daniel, A. G. S., Emerson, R. G., Yuste, R., Schwartz, T. H., et al. (2018) · Brain · doi:10.1093/brain/awy116 · Cited by 106
Separation of hemodynamic signals from GCaMP fluorescence measured with wide-field imaging
Valley, M. T., Moore, M. G., Zhuang, J., Mesa, N., Castelli, D., Sullivan, D., Reimers, M., & Waters, J. (2019) · Journal of Neurophysiology · doi:10.1152/jn.00304.2019 · Cited by 99
Hakon, J., Quattromani, M. J., Sjölund, C., Tomasevic, G., Carey, L. M., Lee, J., Ruscher, K., Wieloch, T. W., & Bauer, A. Q. (2017) · NeuroImage Clinical · doi:10.1016/j.nicl.2017.11.022 · Cited by 94
Self-citationXie, Y., Chan, A. W., McGirr, A., Xue, S., Xiao, D., Zeng, H., & Murphy, T. H. (2016) · Journal of Neuroscience · doi:10.1523/jneurosci.2744-15.2016 · Cited by 98
Rayshubskiy, A., Wojtasiewicz, T. J., Mikell, C. B., Bouchard, M. B., Timerman, D., Youngerman, B. E., McGovern, R. A., Otten, M. L., Canoll, P., McKhann, G. M., et al. (2013) · NeuroImage · doi:10.1016/j.neuroimage.2013.10.044 · Cited by 98
A miniature multi-contrast microscope for functional imaging in freely behaving animals
Senarathna, J., Yu, H., Deng, C., Zou, A. L., Issa, J. B., Hadjiabadi, D. H., Gil, S., Wang, Q., Tyler, B., Thakor, N. V., et al. (2019) · Nature Communications · doi:10.1038/s41467-018-07926-z · Cited by 100
High-throughput automated home-cage mesoscopic functional imaging of mouse cortex
Murphy, T. H., Boyd, J. D., Bolaños, F., Vanni, M. P., Silasi, G., Haupt, D., & LeDue, J. M. (2016) · Nature Communications · doi:10.1038/ncomms11611 · Cited by 90
Shim, H., Jung, W. B., Schlegel, F., Lee, J., Kim, S., Lee, J., & Kim, S. (2018) · NeuroImage · doi:10.1016/j.neuroimage.2018.04.062 · Cited by 86
Self-citationResting State fMRI Reveals Diminished Functional Connectivity in a Mouse Model of Amyloidosis
Shah, D., Jonckers, E., Praet, J., Vanhoutte, G., Delgado y Palacios, R., Bigot, C., D’Souza, D. V., Verhoye, M., & Van der Linden, A. (2013) · PLoS ONE · doi:10.1371/journal.pone.0084241 · Cited by 82
Chan, A. W., Mohajerani, M. H., LeDue, J. M., Wang, Y. T., & Murphy, T. H. (2015) · Nature Communications · doi:10.1038/ncomms8738 · Cited by 79
Designing a large field-of-view two-photon microscope using optical invariant analysis
Bumstead, J., Park, J. J., Rosen, I. A., Kraft, A. W., Wright, P. W., Reisman, M. D., Côté, D. C., & Culver, J. P. (2018) · Neurophotonics · doi:10.1117/1.nph.5.2.025001 · Cited by 75
Self-citationFunctional networks and network perturbations in rodents
Chuang, K., & Nasrallah, F. A. (2017) · NeuroImage · doi:10.1016/j.neuroimage.2017.09.038 · Cited by 78
Gorges, M., Roselli, F., Müller, H.-P., Ludolph, A. C., Rasche, V., & Kassubek, J. (2017) · Frontiers in Neurology · doi:10.3389/fneur.2017.00200 · Cited by 76
Pichette, J., Laurence, A., Angulo-Rodríguez, L. M., Lesage, F., Bouthillier, A., Nguyen, D. K., & Leblond, F. (2016) · Neurophotonics · doi:10.1117/1.nph.3.4.045003 · Cited by 75
Neuronal Origin of the Temporal Dynamics of Spontaneous BOLD Activity Correlation
Matsui, T., Murakami, T., & Ohki, K. (2018) · Cerebral Cortex · doi:10.1093/cercor/bhy045 · Cited by 79
Arousal as a universal embedding for spatiotemporal brain dynamics
Raut, R. V., Rosenthal, Z. P., Wang, X., Miao, H., Zhang, Z., Lee, J., Raichle, M. E., Bauer, A. Q., Brunton, S. L., Brunton, B. W., et al. (2025) · Nature · doi:10.1038/s41586-025-09544-4 · Cited by 91
Self-citationPushing the Boundaries of Neuroimaging with Optoacoustics
Ovsepian, S. V., Olefir, I., Westmeyer, G. G., Razansky, D., & Ntziachristos, V. (2017) · Neuron · doi:10.1016/j.neuron.2017.10.022 · Cited by 64
Regional and cell-type-specific afferent and efferent projections of the mouse claustrum
Wang, Q., Wang, Y., Kuo, H.-C., Xie, P., Kuang, X., Hirokawa, K. E., Naeemi, M., Yao, S., Mallory, M., Ouellette, B., et al. (2023) · Cell Reports · doi:10.1016/j.celrep.2023.112118 · Cited by 67
Corcoran, K. A., Frick, B. J., Radulović, J., & Kay, L. M. (2015) · Neurobiology of Learning and Memory · doi:10.1016/j.nlm.2015.11.019 · Cited by 63
The future of functional MRI in clinical medicine
Bullmore, E. T. (2012) · NeuroImage · doi:10.1016/j.neuroimage.2012.01.026 · Cited by 60
Effects of the murine skull in optoacoustic brain microscopy
Kneipp, M., Turner, J., Estrada, H., Rebling, J., Shoham, S., & Razansky, D. (2015) · Journal of Biophotonics · doi:10.1002/jbio.201400152 · Cited by 59
McGirr, A., LeDue, J. M., Chan, A. W., Xie, Y., & Murphy, T. H. (2017) · Brain · doi:10.1093/brain/awx142 · Cited by 60
Contrast flow selectivity during transforaminal lumbosacral epidural steroid injections.
Furman, M. B., Lee, T. S., Mehta, A. R., Simon, J. I., & Cano, W. G. (2008) · PubMed · Cited by 58
Bauer, A. Q., Kraft, A. W., Baxter, G. A., Wright, P. W., Reisman, M. D., Bice, A. R., Park, J. J., Bruchas, M. R., Snyder, A. Z., Lee, J., et al. (2017) · Cerebral Cortex · doi:10.1093/cercor/bhx298 · Cited by 59
Self-citationDifferential effects of anesthetics on resting state functional connectivity in the mouse
Xie, H., Chung, D. Y., Kura, S., Sugimoto, K., Aykan, S. A., Wu, Y., Sakadžić, S., Yaseen, M. A., Boas, D. A., & Ayata, C. (2019) · Journal of Cerebral Blood Flow & Metabolism · doi:10.1177/0271678x19847123 · Cited by 56
Functional connectivity fMRI in mouse brain at 7 T using isoflurane
Guilfoyle, D. N., Gerum, S. V., Sanchez, J. L., Balla, A., Sershen, H. W., Javitt, D. C., & Hoptman, M. J. (2013) · Journal of Neuroscience Methods · doi:10.1016/j.jneumeth.2013.01.019 · Cited by 56
Resting state functional connectivity: Its physiological basis and application in neuropharmacology
Lu, H., & Stein, E. A. (2013) · Neuropharmacology · doi:10.1016/j.neuropharm.2013.08.023 · Cited by 56
Distinct Structure of Cortical Population Activity on Fast and Infraslow Timescales
Okun, M., Steinmetz, N. A., Lak, A., Dervinis, M., & Harris, K. D. (2019) · Cerebral Cortex · doi:10.1093/cercor/bhz023 · Cited by 58
Emerging imaging methods to study whole-brain function in rodent models
Markicevic, M., Savvateev, I., Grimm, C., & Zerbi, V. (2021) · Translational Psychiatry · doi:10.1038/s41398-021-01575-5 · Cited by 55
Kim, E., Anguluan, E., & Kim, J. G. (2017) · Scientific Reports · doi:10.1038/s41598-017-13572-0 · Cited by 52
Opposed hemodynamic responses following increased excitation and parvalbumin-based inhibition
Lee, J., Stile, C. L., Bice, A. R., Rosenthal, Z. P., Yan, P., Snyder, A. Z., Lee, J., & Bauer, A. Q. (2020) · Journal of Cerebral Blood Flow & Metabolism · doi:10.1177/0271678x20930831 · Cited by 51
Self-citationLu, H., Wang, L., Rea, W. P., Brynildsen, J. K., Jaime, S., Zuo, Y., Stein, E. A., & Yang, Y. (2014) · Cerebral Cortex · doi:10.1093/cercor/bhu248 · Cited by 55
Huo, B., Gao, Y., & Drew, P. J. (2014) · NeuroImage · doi:10.1016/j.neuroimage.2014.10.030 · Cited by 56
Mehla, J., Singh, I., Diwan, D., Nelson, J. W., Lawrence, M., Lee, E., Bauer, A. Q., Holtzman, D. M., & Zipfel, G. J. (2021) · Acta Neuropathologica Communications · doi:10.1186/s40478-021-01293-5 · Cited by 52
Self-citationWide-Field Calcium Imaging of Neuronal Network Dynamics In Vivo
Nietz, A. K., Popa, L. S., Streng, M. L., Carter, R. E., Kodandaramaiah, S. B., & Ebner, T. J. (2022) · Biology · doi:10.3390/biology11111601 · Cited by 53
Xiao, D., Forys, B. J., Vanni, M. P., & Murphy, T. H. (2021) · Nature Communications · doi:10.1038/s41467-021-26255-2 · Cited by 48
Brain tumors disrupt the resting-state connectome
Hadjiabadi, D. H., Pung, L., Zhang, J., Ward, B. D., Lım, W., Kalavar, M., Thakor, N. V., Biswal, B. B., & Pathak, A. P. (2018) · NeuroImage Clinical · doi:10.1016/j.nicl.2018.01.026 · Cited by 49
Assessment and modulation of resting-state neural networks after stroke
Dijkhuizen, R. M., Zaharchuk, G., & Otte, W. M. (2014) · Current Opinion in Neurology · doi:10.1097/wco.0000000000000150 · Cited by 47
fMRI mapping of the visual system in the mouse brain with interleaved snapshot GE-EPI
Niranjan, A., Christie, I. N., Solomon, S. G., Wells, J. A., & Lythgoe, M. F. (2016) · NeuroImage · doi:10.1016/j.neuroimage.2016.06.015 · Cited by 47
Kraft, A. W., Bauer, A. Q., Culver, J. P., & Lee, J. (2018) · Science Translational Medicine · doi:10.1126/scitranslmed.aag1328 · Cited by 47
Self-citationMohammadzadeh, L., Latifi, H., Khaksar, S., Feiz, M.-S., Motamedi, F., Asadollahi, A., & Ezzatpour, M. (2020) · Scientific Reports · doi:10.1038/s41598-020-66246-9 · Cited by 46
Mapping Functional Connectivity Using Cerebral Blood Flow in the Mouse Brain
Bergonzi, K. M., Bauer, A. Q., Wright, P. W., & Culver, J. P. (2014) · Journal of Cerebral Blood Flow & Metabolism · doi:10.1038/jcbfm.2014.211 · Cited by 46
Self-citationGuy, J., Wagener, R. J., Möck, M., & Staiger, J. F. (2014) · Cerebral Cortex · doi:10.1093/cercor/bhu052 · Cited by 47
Hariri, A., Omidi, P., & Nasiriavanaki, M. (2016) · Frontiers in Optics · doi:10.1364/fio.2016.jw4a.62 · Cited by 45
Separability of calcium slow waves and functional connectivity during wake, sleep, and anesthesia
Brier, L. M., Landsness, E. C., Snyder, A. Z., Wright, P. W., Baxter, G. A., Bauer, A. Q., Lee, J., & Culver, J. P. (2019) · Neurophotonics · doi:10.1117/1.nph.6.3.035002 · Cited by 48
Self-citationListening to the Brain With Photoacoustics
Hu, S. (2015) · IEEE Journal of Selected Topics in Quantum Electronics · doi:10.1109/jstqe.2015.2487890 · Cited by 42
Vafaii, H., Mandino, F., Desrosiers-Grégoire, G., O’Connor, D. A., Markicevic, M., Shen, X., Ge, X., Hermán, P., Hyder, F., Papademetris, X., et al. (2024) · Nature Communications · doi:10.1038/s41467-023-44363-z · Cited by 45
Afrashteh, N., Inayat, S., Mohsenvand, M. ‘., & Mohajerani, M. H. (2017) · NeuroImage · doi:10.1016/j.neuroimage.2017.03.034 · Cited by 37
Kura, S., Xie, H., Fu, B., Ayata, C., Boas, D. A., & Sakadžić, S. (2018) · Journal of Neural Engineering · doi:10.1088/1741-2552/aaafe4 · Cited by 38
Breshears, J. D., Gaona, C. M., Roland, J. L., Sharma, M., Bundy, D. T., Shimony, J. S., Rashid, S., Eisenman, L. N., Hogan, R. E., Snyder, A. Z., et al. (2012) · Neurosurgery · doi:10.1227/neu.0b013e318258e5d1 · Cited by 38
Self-citationChung, D. Y., Oka, F., Jin, G., Harriott, A. M., Kura, S., Aykan, S. A., Qin, T., Edmiston, W. J., Lee, H., Yaseen, M. A., et al. (2020) · Journal of Cerebral Blood Flow & Metabolism · doi:10.1177/0271678x20940152 · Cited by 36
Cerebral functional connectivity and Mayer waves in mice: Phenomena and separability
Bumstead, J., Bauer, A. Q., Wright, P. W., & Culver, J. P. (2016) · Journal of Cerebral Blood Flow & Metabolism · doi:10.1177/0271678x16629977 · Cited by 34
Self-citationModerate Prenatal Alcohol Exposure Alters Functional Connectivity in the Adult Rat Brain
Rodriguez, C. I., Davies, S., Calhoun, V. D., Savage, D. D., & Hamilton, D. A. (2016) · Alcoholism Clinical and Experimental Research · doi:10.1111/acer.13175 · Cited by 31
Michelson, N. J., Vanni, M. P., & Murphy, T. H. (2019) · Neurophotonics · doi:10.1117/1.nph.6.2.025014 · Cited by 32
Rosenthal, Z. P., Raut, R. V., Yan, P., Koko, D., Kraft, A. W., Czerniewski, L. R., Acland, B. T., Mitra, A., Snyder, L. H., Bauer, A. Q., et al. (2019) · Cerebral Cortex · doi:10.1093/cercor/bhz314 · Cited by 33
Self-citationImaging of an Inflammatory Injury in the Newborn Rat Brain with Photoacoustic Tomography
Guevara, E., Berti, R., Londoño, I., Ningshi, X., Bellec, P., Lesage, F., & Lodygensky, G. A. (2013) · PLoS ONE · doi:10.1371/journal.pone.0083045 · Cited by 30
Matchynski, J. I., Manwar, R., Kratkiewicz, K., Madangopal, R., Lennon, V. A., Makki, K., Reppen, A., Woznicki, A. R., Hope, B. T., Perrine, S. A., et al. (2021) · Photoacoustics · doi:10.1016/j.pacs.2021.100297 · Cited by 30
Baird-Daniel, E., Daniel, A. G. S., Wenzel, M., Li, D., Liou, J., Laffont, P., Zhao, M., Yuste, R., Ma, H.-T., & Schwartz, T. (2017) · Cerebral Cortex · doi:10.1093/cercor/bhx072 · Cited by 23
Optical imaging of resting-state functional connectivity in a novel arterial stiffness model
Guevara, E., Sadekova, N., Girouard, H., & Lesage, F. (2013) · Biomedical Optics Express · doi:10.1364/boe.4.002332 · Cited by 34
Optical imaging of acute epileptic networks in mice
Guevara, E., Pouliot, P., Nguyen, D. K., & Lesage, F. (2013) · Journal of Biomedical Optics · doi:10.1117/1.jbo.18.7.076021 · Cited by 27
Song, X., Guo, Y., Li, H., Chen, C., Lee, J. H., Zhang, Y., Schmidt, Z., & Wang, X. (2022) · Nature Communications · doi:10.1038/s41467-022-29864-7 · Cited by 26
Self-citationPadawer-Curry, J. A., Krentzman, O. J., Kuo, C., Wang, X., Bice, A. R., Nicol, G. E., Snyder, A. Z., Siegel, J. S., McCall, J. G., & Bauer, A. Q. (2025) · Nature Neuroscience · doi:10.1038/s41593-025-02069-z · Cited by 30
Self-citationQuattromani, M. J., Hakon, J., Rauch, U., Bauer, A. Q., & Wieloch, T. W. (2018) · Neurobiology of Disease · doi:10.1016/j.nbd.2018.01.011 · Cited by 25
Self-citationFunctional Connectivity of the Developing Mouse Cortex
Rahn, R. M., Brier, L. M., Bice, A. R., Reisman, M. D., Dougherty, J. D., & Culver, J. P. (2021) · Cerebral Cortex · doi:10.1093/cercor/bhab312 · Cited by 24
Self-citationAlbertson, A. J., Landsness, E. C., Tang, M., Yan, P., Miao, H., Rosenthal, Z. P., Kim, B., Culver, J. P., Bauer, A. Q., & Lee, J. (2022) · NeuroImage · doi:10.1016/j.neuroimage.2022.119287 · Cited by 23
Self-citationOrukari, I. E., Siegel, J. S., Warrington, N. M., Baxter, G. A., Bauer, A. Q., Shimony, J. S., Rubin, J. B., & Culver, J. P. (2018) · Journal of Cerebral Blood Flow & Metabolism · doi:10.1177/0271678x18803948 · Cited by 25
Self-citationEvaluation of gliovascular functions of AQP4 readthrough isoforms
Mueller, S. M., White, K. M., Fass, S. B., Chen, S., Shi, Z., Ge, X., Engelbach, J. A., Gaines, S. H., Bice, A. R., Vasek, M. J., et al. (2023) · Frontiers in Cellular Neuroscience · doi:10.3389/fncel.2023.1272391 · Cited by 27
Self-citationInhibiting metabotropic glutamate receptor 5 after stroke restores brain function and connectivity
Hakon, J., Quattromani, M. J., Sjölund, C., Talhada, D., Kim, B., Moyanova, S. G., Mastroiacovo, F., Menna, L. D., Olsson, R., Englund, E. M., et al. (2023) · Brain · doi:10.1093/brain/awad293 · Cited by 25
Self-citationMusiek, E. S., Xiong, D. D., Patel, T. K., Sasaki, Y., Wang, Y., Bauer, A. Q., Singh, R., Finn, S. L., Culver, J. P., Milbrandt, J., et al. (2016) · Annals of Clinical and Translational Neurology · doi:10.1002/acn3.308 · Cited by 22
Self-citationNeurovascular Coupling is Preserved in Chronic Stroke Recovery After Targeted Photothrombosis
Sunil, S., Jiang, J., Shah, S., Kura, S., Kılıç, K., Erdener, Ş. E., Ayata, C., Devor, A., & Boas, D. A. (2022) · NeuroImage Clinical · doi:10.1016/j.nicl.2023.103377 · Cited by 22
Metadata
- Authors
- White, B. R., Bauer, A. Q., Snyder, A. Z., Schlaggar, B. L., Lee, J.-M., & Culver, J. P.
- Affiliations
- Washington University in St. Louis (US)
- Corresponding author
- Culver, Joseph P.
- ORCID
- Venue
- PLoS ONE
- Publisher
- Public Library of Science (PLoS)
- Published
- 2011-01-20
- Volume
- 6
- Issue
- 1
- Pages
- e16322
- ISSN
- 1932-6203 (ISSN-L)
- PMC
- PMC3024435
- OpenAlex
- W2065496603
- Cited by
- 253
- References
- 60
- Citations by year
- 2026: 7 · 2025: 15 · 2024: 18 · 2023: 25 · 2022: 16 · 2021: 15 · 2020: 15 · 2019: 22 · 2018: 15 · 2017: 30 · 2016: 16 · 2015: 9 · 2014: 23 · 2013: 16 · 2012: 7
- FWCI
- 7.96
- Type
- journal article
- Language
- en
- Open access
- gold
- doi.org
- Locations
- PLoS ONE (publishedVersion, cc-by)
- PubMed Central (publishedVersion, cc-by)
- PubMed (publishedVersion)
- DOAJ (DOAJ: Directory of Open Access Journals) (submittedVersion, cc-by-sa)
- Figshare (submittedVersion, cc-by)
- Funders
- National Institutes of Health
- National Institute on Drug Abuse (T90DA022871)
- National Institute of Neurological Disorders and Stroke (P01 NS32636, R01NS084028, P01NS032636)
- National Institute of Biomedical Imaging and Bioengineering (R01EB008085, R01EB009233)
- Topics
- Life Sciences › Neuroscience › Cognitive Neuroscience › Functional Brain Connectivity Studies
- Health Sciences › Medicine › Radiology, Nuclear Medicine and Imaging › Optical Imaging and Spectroscopy Techniques
- Health Sciences › Medicine › Radiology, Nuclear Medicine and Imaging › Advanced MRI Techniques and Applications
- Keywords
- functional connectivity, mouse brain, resting-state networks, intrinsic signal imaging, mouse models of human disease, non-invasive brain imaging, camera-based imaging
- MeSH terms
- Animals, Brain Mapping, Cerebral Cortex, Equipment Design, Magnetic Resonance Imaging, Methods, Neural Pathways, Mice, Optical Devices
About these checks
Registry, retraction, Cites and statistics results are computed, not judged, with one exception: a printed reference that no index lists is read once by a model before it counts as a citation error. Claims are extracted by a model and kept only when their quote appears verbatim in the text; each cited source is then checked, with a model’s help, for whether it says what the claim relies on. Those verdicts can be wrong — read the claim’s quote and the cited source before relying on one.
Statistics and arithmetic are recomputed, not judged.
Confidence bands are shown only for fields calibrated on our annotated test set. None is calibrated yet, so no band is shown.
What counts as a claim ›How we measure confidence ›How we check this ›
Are you an author, or do you see a problem with this page? Request a review
