

The DOI matches its Crossref record; 48 of the 48 references it cites were found in a registry or an index.
Contribution of CgPDR1-Regulated Genes in Enhanced Virulence of Azole-Resistant Candida glabrata
Open accessAbstract
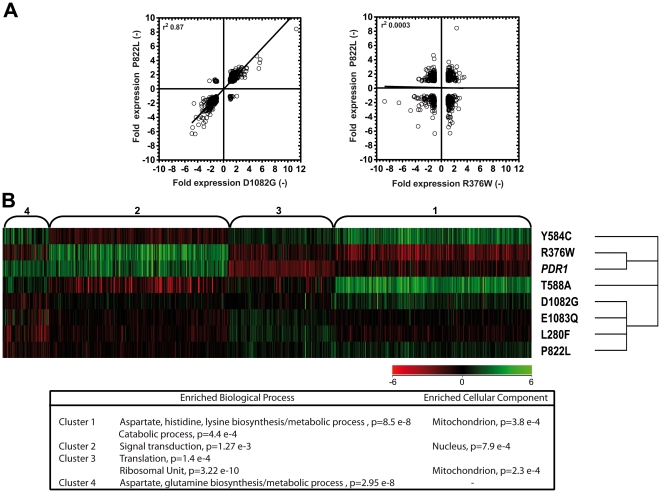
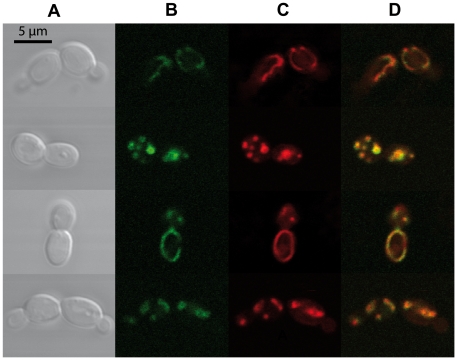
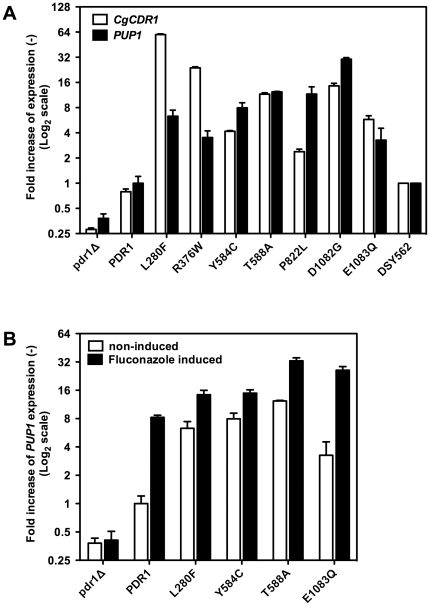
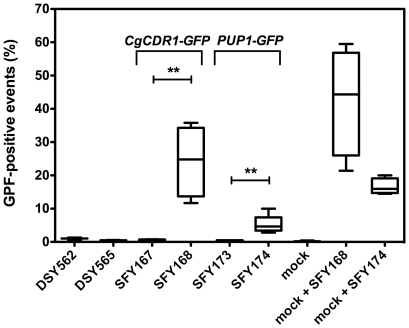
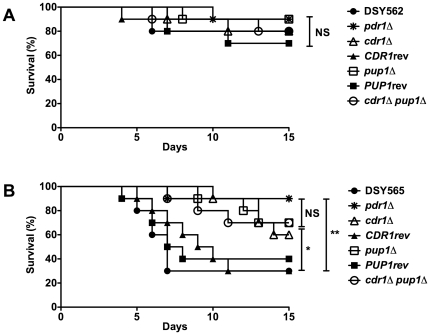
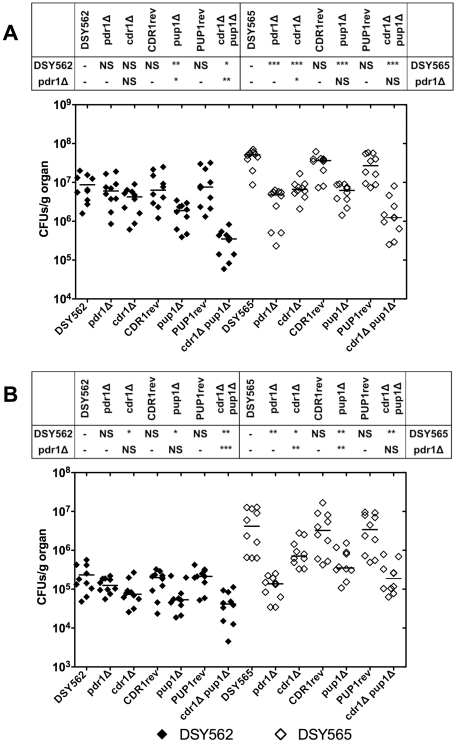
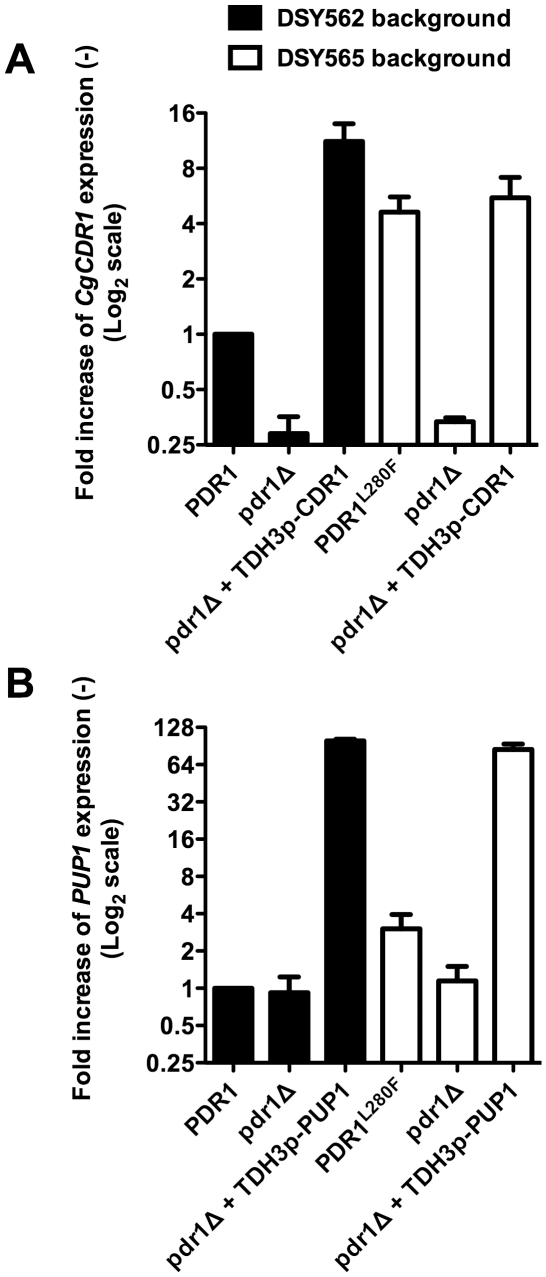
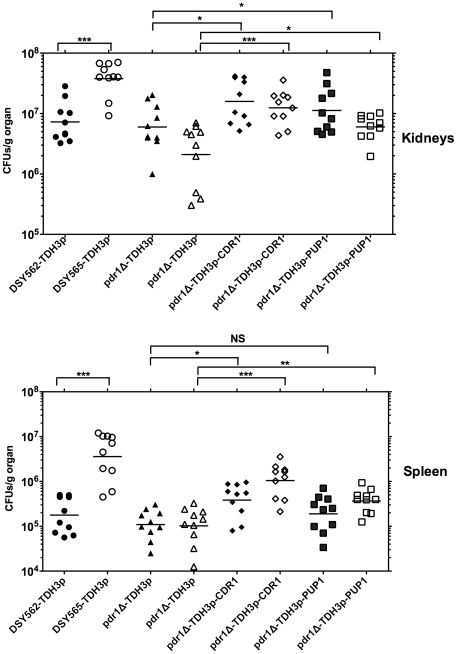
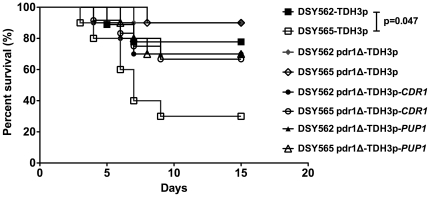
In Candida glabrata, the transcription factor CgPdr1 is involved in resistance to azole antifungals via upregulation of ATP binding cassette (ABC)-transporter genes including at least CgCDR1, CgCDR2 and CgSNQ2. A high diversity of GOF (gain-of-function) mutations in CgPDR1 exists for the upregulation of ABC-transporters. These mutations enhance C. glabrata virulence in animal models, thus indicating that CgPDR1 might regulate the expression of yet unidentified virulence factors. We hypothesized that CgPdr1-dependent virulence factor(s) should be commonly regulated by all GOF mutations in CgPDR1. As deduced from transcript profiling with microarrays, a high number of genes (up to 385) were differentially regulated by a selected number (7) of GOF mutations expressed in the same genetic background. Surprisingly, the transcriptional profiles resulting from expression of GOF mutations showed minimal overlap in co-regulated genes. Only two genes, CgCDR1 and PUP1 (for PDR1 upregulated and encoding a mitochondrial protein), were commonly upregulated by all tested GOFs. While both genes mediated azole resistance, although to different extents, their deletions in an azole-resistant isolate led to a reduction of virulence and decreased tissue burden as compared to clinical parents. As expected from their role in C. glabrata virulence, the two genes were expressed as well in vitro and in vivo. The individual overexpression of these two genes in a CgPDR1-independent manner could partially restore phenotypes obtained in clinical isolates. These data therefore demonstrate that at least these two CgPDR1-dependent and -upregulated genes contribute to the enhanced virulence of C. glabrata that acquired azole resistance.
Overview
The claims and statistics of this paper haven’t been checked yet.
Run the check — free, no account needed. It reads the open-access text and checks the sources it cites.
Integrity signals
Registry
Cites
Statistics
Figures
Verification
Claims the paper makes
The claims and statistics of this paper haven’t been checked yet.
Run the check — free, no account needed. It reads the open-access text and checks the sources it cites.
Claims other papers make about this one
Each is checked against this paper’s own text: does it say what the citing paper says it does?
In the citing paper
“Specific pdr1 mutations in C. glabrata can also lead to a gain of fitness through enhanced adhesion and virulence”
From Genetic Drivers of Multidrug Resistance in Candida glabrata (2016) · cites this paper as Ferrari et al., 2011
In the citing paper
“In C. glabrata, the transcription factor Pdr1 is involved in resistance to azoles through upregulation of CDR1, CDR2, and SNQ2 [91].”
From Candida glabrata Biofilms: How Far Have We Come? (2017) · cites this paper as [91]
Self-check
Percentages, sums and reported differences re-computed from the paper’s own numbers.
The self-check needs the paper’s full text.
Citations
Cites
Epidemiology of Invasive Candidiasis: a Persistent Public Health Problem
Pfaller, M. A., & Diekema, D. J. (2007) · Clinical Microbiology Reviews · doi:10.1128/cmr.00029-06 · Cited by 4,174 · cited 1×
“glabrata is often reported as the second most prevalent species after Candida albicans [2,3].”
BackgroundResistance of Candida species to antifungal agents: molecular mechanisms and clinical consequences
Sanglard, D., & Odds, F. C. (2002) · The Lancet Infectious Diseases · doi:10.1016/s1473-3099(02)00181-0 · Cited by 784
Self-citationThe SAT1 flipper, an optimized tool for gene disruption in Candida albicans
Reuß, O., Vik, Å., Kolter, R., & Morschhäuser, J. (2004) · Gene · doi:10.1016/j.gene.2004.06.021 · Cited by 744
Sionov, E., Lee, H., Chang, Y. C., & Kwon-Chung, K. J. (2010) · PLoS Pathogens · doi:10.1371/journal.ppat.1000848 · Cited by 479
The biological cost of mutational antibiotic resistance: any practical conclusions?
Andersson, D. I. (2006) · Current Opinion in Microbiology · doi:10.1016/j.mib.2006.07.002 · Cited by 475
Kretschmer, M., Leroch, M., Mosbach, A., Walker, A. S., Fillinger, S., Mernke, D., Schoonbeek, H., Pradier, J., Leroux, P., Waard, M. A. D., et al. (2009) · PLoS Pathogens · doi:10.1371/journal.ppat.1000696 · Cited by 420
Coste, A. T., Karababa, M., Ischer, F., Bille, J., & Sanglard, D. (2004) · Eukaryotic Cell · doi:10.1128/ec.3.6.1639-1652.2004 · Cited by 407
Self-citationEvolution of antifungal-drug resistance: mechanisms and pathogen fitness
Anderson, J. B. (2005) · Nature Reviews Microbiology · doi:10.1038/nrmicro1179 · Cited by 375
The changing face of epidemiology of invasive fungal disease in Europe
Lass‐Flörl, C. (2009) · Mycoses · doi:10.1111/j.1439-0507.2009.01691.x · Cited by 371
Morschhäuser, J., Barker, K. S., Liu, T. T., Blaß-Warmuth, J., Homayouni, R., & Rogers, P. D. (2007) · PLoS Pathogens · doi:10.1371/journal.ppat.0030164 · Cited by 355
Cited by
Sorted by citations
Antifungal Drug Resistance: Molecular Mechanisms in Candida albicans and Beyond
Lee, Y., Puumala, E., Robbins, N., & Cowen, L. E. (2021) · Chemical Reviews · doi:10.1021/acs.chemrev.0c00199 · Cited by 801
Alexander, B. D., Johnson, M. D., Pfeiffer, C. D., Jiménez-Ortigosa, C., Catania, J., Booker, R., Castanheira, M., Messer, S. A., Perlin, D. S., & Pfaller, M. A. (2013) · Clinical Infectious Diseases · doi:10.1093/cid/cit136 · Cited by 778
Mechanisms of Antifungal Drug Resistance
Cowen, L. E., Sanglard, D., Howard, S. J., Rogers, P. D., & Perlin, D. S. (2015) · Cold Spring Harbor Perspectives in Medicine · doi:10.1101/cshperspect.a019752 · Cited by 647
Self-citationAntifungal Resistance and New Strategies to Control Fungal Infections
Vandeputte, P., Ferrari, S., & Coste, A. T. (2011) · International Journal of Microbiology · doi:10.1155/2012/713687 · Cited by 531
Self-citationThe Antifungal Pipeline: Fosmanogepix, Ibrexafungerp, Olorofim, Opelconazole, and Rezafungin
Hoenigl, M., Sprute, R., Egger, M., Arastehfar, A., Cornely, O. A., Krause, R., Lass-Flörl, C., Prattes, J., Spec, A., Thompson, G. R., et al. (2021) · Drugs · doi:10.1007/s40265-021-01611-0 · Cited by 467
The Candida Pathogenic Species ComplexPreprint
Turner, S. A., & Butler, G. (2014) · Cold Spring Harbor Perspectives in Medicine · doi:10.1101/cshperspect.a019778 · Cited by 351
Healey, K. R., Zhao, Y., Perez, W. B., Lockhart, S. R., Sobel, J. D., Farmakiotis, D., Kontoyiannis, D. P., Sanglard, D., Taj-Aldeen, S. J., Alexander, B. D., et al. (2016) · Nature Communications · doi:10.1038/ncomms11128 · Cited by 276
Self-citationCandida glabrata: A review of its features and resistance
Rodrigues, C. F., Silva, S., & Henriques, M. (2014) · European Journal of Clinical Microbiology & Infectious Diseases · doi:10.1007/s10096-013-2009-3 · Cited by 268
Shaw, K. J., & Ibrahim, A. S. (2020) · Journal of Fungi · doi:10.3390/jof6040239 · Cited by 229
YEASTRACT+: a portal for cross-species comparative genomics of transcription regulation in yeasts
Monteiro, P. T., Oliveira, J. S., Pais, P., Antunes, M., Palma, M., Cavalheiro, M., Galocha, M., Godinho, C. P., Martins, L. C., Bourbon-Melo, N., et al. (2019) · Nucleic Acids Research · doi:10.1093/nar/gkz859 · Cited by 203
Fungal Resistance to Echinocandins and the MDR Phenomenon in Candida glabrata
Healey, K. R., & Perlin, D. S. (2018) · Journal of Fungi · doi:10.3390/jof4030105 · Cited by 194
Candida and candidiasis in HIV-infected patients
Cassone, A., & Cauda, R. (2012) · AIDS · doi:10.1097/qad.0b013e3283536ba8 · Cited by 152
Ferrari, S., Sanguinetti, M., De Bernardis, F., Torelli, R., Posteraro, B., Vandeputte, P., & Sanglard, D. (2011) · Antimicrobial Agents and Chemotherapy · doi:10.1128/aac.01271-10 · Cited by 144
Self-citationInhibiting fungal multidrug resistance by disrupting an activator–Mediator interaction
Nishikawa, J. L., Boeszoermenyi, A., Vale-Silva, L. A., Torelli, R., Posteraro, B., Sohn, Y.-J., Ji, F., Gelev, V., Sanglard, D., Sanguinetti, M., et al. (2016) · Nature · doi:10.1038/nature16963 · Cited by 146
Self-citationMultidrug resistance in fungi: regulation of transporter-encoding gene expression
Paul, S., & Moye-Rowley, W. S. (2014) · Frontiers in Physiology · doi:10.3389/fphys.2014.00143 · Cited by 137
Joardar, V., Abrams, N. F., Hostetler, J. B., Paukstelis, P. J., Pakala, S. M., Pakala, S., Zafar, N., Abolude, O. O., Payne, G. A., Andrianopoulos, A., et al. (2012) · BMC Genomics · doi:10.1186/1471-2164-13-698 · Cited by 131
Candida glabrata Biofilms: How Far Have We Come?
Rodrigues, C., Rodrigues, M., Silva, S., & Henriques, M. (2017) · Journal of Fungi · doi:10.3390/jof3010011 · Cited by 129
Farahyar, S., Zaini, F., Kordbacheh, P., Rezaie, S., Safara, M., Raoofian, R., & Heidari, M. (2013) · DARU Journal of Pharmaceutical Sciences · doi:10.1186/2008-2231-21-1 · Cited by 125
Current status of antifungal resistance and its impact on clinical practice
Alcázar‐Fuoli, L., & Mellado, E. (2014) · British Journal of Haematology · doi:10.1111/bjh.12896 · Cited by 118
Intracellular survival ofCandida glabratain macrophages: immune evasion and persistence
Kasper, L., Seider, K., & Hube, B. (2015) · FEMS Yeast Research · doi:10.1093/femsyr/fov042 · Cited by 119
Elucidating Drug Resistance in Human Fungal Pathogens
Xie, J. L., Polvi, E. J., Shekhar‐Guturja, T., & Cowen, L. E. (2014) · Future Microbiology · doi:10.2217/fmb.14.18 · Cited by 103
Sasse, C., Dunkel, N., Schäfer, T., Schneider, S., Dierolf, F., Ohlsen, K., & Morschhäuser, J. (2012) · Molecular Microbiology · doi:10.1111/j.1365-2958.2012.08210.x · Cited by 93
Genetic Drivers of Multidrug Resistance in Candida glabrata
Healey, K. R., Jimenez Ortigosa, C., Shor, E., & Perlin, D. S. (2016) · Frontiers in Microbiology · doi:10.3389/fmicb.2016.01995 · Cited by 93
Azole Resistance in Candida glabrata
Whaley, S. G., & Rogers, P. D. (2016) · Current Infectious Disease Reports · doi:10.1007/s11908-016-0554-5 · Cited by 85
Spettel, K., Barousch, W., Makristathis, A., Zeller, I., Nehr, M., Selitsch, B., Lackner, M., Rath, P.-M., Steinmann, J., & Willinger, B. (2019) · PLoS ONE · doi:10.1371/journal.pone.0210397 · Cited by 86
Acquired multidrug antifungal resistance in Candida lusitaniae during therapy
Asner, S. A., Giulieri, S., Diezi, M., Marchetti, O., & Sanglard, D. (2015) · Antimicrobial Agents and Chemotherapy · doi:10.1128/aac.02204-15 · Cited by 82
Self-citationThe effect of biomaterials and antifungals on biofilm formation by Candida species: a review
Cuéllar‐Cruz, M., Vega‐González, A., Mendoza‐Novelo, B., López-Romero, E., Ruiz‐Baca, E., Escorza, M. A. Q., & Villagómez-Castro, J. C. (2012) · European Journal of Clinical Microbiology & Infectious Diseases · doi:10.1007/s10096-012-1634-6 · Cited by 83
Hosting Infection: Experimental Models to AssayCandidaVirulence
MacCallum, D. M. (2011) · International Journal of Microbiology · doi:10.1155/2012/363764 · Cited by 86
Rogers, T. R., Verweij, P. E., Castanheira, M., Dannaoui, E., White, P. L., Arendrup, M. C., Subcommittee on Antifungal Susceptibility Testing (AFST) of the ESCMID European Committee for Antimicrobial Susceptibility Testing (EUCAST), Arendrup, M. C., Arikan-Akdagli, S., Barchiesi, F., et al. (2022) · Journal of Antimicrobial Chemotherapy · doi:10.1093/jac/dkac161 · Cited by 82
Iyer, K. R., Camara, K., Daniel-Ivad, M., Trilles, R. V., Pimentel‐Elardo, S. M., Fossen, J., Marchillo, K., Liu, Z., Singh, S., Muñoz, J. F., et al. (2020) · Nature Communications · doi:10.1038/s41467-020-20183-3 · Cited by 71
Tipping the balance both ways: drug resistance and virulence in Candida glabrata
Vale-Silva, L. A., & Sanglard, D. (2015) · FEMS Yeast Research · doi:10.1093/femsyr/fov025 · Cited by 71
Self-citationVale-Silva, L., Ischer, F., Leibundgut-Landmann, S., & Sanglard, D. (2013) · Infection and Immunity · doi:10.1128/iai.00074-13 · Cited by 65
Self-citationHealey, K. R., Nagasaki, Y., Zimmerman, M. D., Kordalewska, M., Park, S., Zhao, Y., & Perlin, D. S. (2017) · Antimicrobial Agents and Chemotherapy · doi:10.1128/aac.01412-17 · Cited by 58
Competitive Fitness of Fluconazole-Resistant Clinical Candida albicans Strains
Popp, C., Hampe, I. A. I., Hertlein, T., Ohlsen, K., Rogers, P. D., & Morschhäuser, J. (2017) · Antimicrobial Agents and Chemotherapy · doi:10.1128/aac.00584-17 · Cited by 56
The effect of antifungal resistance development on the virulence of Candida species
Bohner, F., Papp, C., & Gácser, A. (2022) · FEMS Yeast Research · doi:10.1093/femsyr/foac019 · Cited by 72
Salazar, S. B., Simões, R., Pedro, N. A., Pinheiro, M. J. F., Carvalho, M. F. N. N., & Mira, N. P. (2020) · Journal of Fungi · doi:10.3390/jof6010023 · Cited by 58
Fungal resistance to echinocandins and the MDR phenomenon in Candida glabrata
Healey, K., & Perlin, D. S. (2018) · doi:10.20944/preprints201808.0306.v1 · Cited by 194
Azole resistance in Candida auris: mechanisms and combinatorial therapy
Jangir, P., Kalra, S., Tanwar, S., & Bari, V. K. (2023) · Apmis · doi:10.1111/apm.13336 · Cited by 54
Fluconazole-Resistant Candida glabrata Bloodstream Isolates, South Korea, 2008–2018
Won, E. J., Choi, M. J., Kim, M., Yong, D., Lee, W. G., Uh, Y., Kim, T. S., Byeon, S. A., Lee, S. Y., Kim, S. H., et al. (2021) · Emerging infectious diseases · doi:10.3201/eid2703.203482 · Cited by 52
Vale-Silva, L. A., Moeckli, B., Torelli, R., Posteraro, B., Sanguinetti, M., & Sanglard, D. (2016) · mSphere · doi:10.1128/msphere.00065-15 · Cited by 51
Self-citationPais, P., Galocha, M., Viana, R., Cavalheiro, M., Pereira, D., & Teixeira, M. C. (2019) · Microbial Cell · doi:10.15698/mic2019.03.670 · Cited by 54
Reconstruction and analysis of the genome-scale metabolic network of Candida glabrata
Xu, N., Liu, L., Zou, W., Liu, J., Hua, Q., & Chen, J. (2012) · Molecular BioSystems · doi:10.1039/c2mb25311a · Cited by 49
Milbemycins: More than Efflux Inhibitors for Fungal Pathogens
Silva, L. V., Sanguinetti, M., Vandeputte, P., Torelli, R., Rochat, B., & Sanglard, D. (2013) · Antimicrobial Agents and Chemotherapy · doi:10.1128/aac.02040-12 · Cited by 49
Self-citationPais, P., Costa, C., Pires, C. M. B. F., Shimizu, K., Chibana, H., & Teixeira, M. C. (2015) · Molecular & Cellular Proteomics · doi:10.1074/mcp.m114.045344 · Cited by 47
Paul, S., Bair, T. B., & Moye-Rowley, W. S. (2014) · Antimicrobial Agents and Chemotherapy · doi:10.1128/aac.03921-14 · Cited by 45
Papp, C., Bohner, F., Kocsis, K., Varga, M., Szekeres, A., Bodai, L., Willis, J. R., Gabaldón, T., Tóth, R., Nosanchuk, J. D., et al. (2020) · mSphere · doi:10.1128/msphere.00821-20 · Cited by 42
Sakagami, T., Kawano, T., Yamashita, K., Yamada, E., Fujino, N., Kaeriyama, M., Fukuda, Y., Nomura, N., Mitsuyama, J., Suematsu, H., et al. (2018) · Journal of Infection and Chemotherapy · doi:10.1016/j.jiac.2018.10.007 · Cited by 43
Host-Pathogen Interactions Mediated by MDR Transporters in Fungi: As Pleiotropic as it Gets!
Cavalheiro, M., Pais, P., Galocha, M., & Teixeira, M. C. (2018) · Genes · doi:10.3390/genes9070332 · Cited by 44
Costa, C., Nunes, J., Henriques, A., Mira, N. P., Nakayama, H., Chibana, H., & Teixeira, M. C. (2014) · Journal of Antimicrobial Chemotherapy · doi:10.1093/jac/dku044 · Cited by 40
Eddouzi, J., Lohberger, A., Vogne, C., Manaï, M., & Sanglard, D. (2013) · Medical Mycology · doi:10.3109/13693786.2013.800239 · Cited by 39
Self-citationCandida glabrata: A powerhouse of resistance
Duggan, S., & Usher, J. (2023) · PLoS Pathogens · doi:10.1371/journal.ppat.1011651 · Cited by 37
Ni, Q., Wang, C., Tian, Y., Dong, D., Jiang, C., Mao, E., & Peng, Y. (2018) · Mycoses · doi:10.1111/myc.12756 · Cited by 37
Mechanisms of azole resistance in clinical isolates of Candida glabrata from two hospitals in China
Yao, D., Chen, J., Chen, W., Li, Z., & Hu, X. (2019) · Infection and Drug Resistance · doi:10.2147/idr.s202058 · Cited by 39
A network of paralogous stress response transcription factors in the human pathogen Candida glabrata
Merhej, J., Thiebaut, A., Blugeon, C., Pouch, J., Ali Chaouche, M. E. A., Camadro, J.-M., Le Crom, S., Lelandais, G., & Devaux, F. (2016) · Frontiers in Microbiology · doi:10.3389/fmicb.2016.00645 · Cited by 36
Siscar-Lewin, S., Gabaldón, T., Aldejohann, A. M., Kurzai, O., Hube, B., & Brunke, S. (2021) · mBio · doi:10.1128/mbio.01128-21 · Cited by 36
Salazar, S. B., Wang, C., Münsterkötter, M., Okamoto, M., Takahashi-Nakaguchi, A., Chibana, H., Lopes, M. M., Güldener, U., Butler, G., & Mira, N. P. (2018) · FEMS Yeast Research · doi:10.1093/femsyr/fox079 · Cited by 31
Pais, P., Pires, C. M. B. F., Costa, C., Okamoto, M., Chibana, H., & Teixeira, M. C. (2016) · Frontiers in Microbiology · doi:10.3389/fmicb.2016.02045 · Cited by 29
Sorbic acid stress activates the Candida glabrata high osmolarity glycerol MAP kinase pathway
Jandric, Z., Gregori, C., Klopf, E., Radolf, M., & Schüller, C. (2013) · Frontiers in Microbiology · doi:10.3389/fmicb.2013.00350 · Cited by 28
“325 ng of Cy3 labeled cRNA were hybridized to the custom C. glabrata GE 8 × 15 K arrays [Agilent eArray Design 017617; GPL10713 (Ferrari et al., 2011b)].”
BackgroundMethodFuture therapies targeted towards eliminatingCandidabiofilms and associated infections
Bandara, N., Matsubara, V. H., & Samaranayake, L. P. (2016) · Expert Review of Anti-infective Therapy · doi:10.1080/14787210.2017.1268530 · Cited by 29
Gale, A. N., Pavesic, M. W., Nickels, T. J., Xu, Z., Cormack, B. P., & Cunningham, K. W. (2023) · mSphere · doi:10.1128/msphere.00254-23 · Cited by 27
Usher, J., & Haynes, K. (2019) · PLOS Genetics · doi:10.1371/journal.pgen.1008259 · Cited by 27
Ballo, M. K. S., Rtimi, S., Kiwi, J. T., Pulgarin, C. O., Entenza, J. M., & Bizzini, A. (2017) · Journal of Photochemistry and Photobiology B Biology · doi:10.1016/j.jphotobiol.2017.07.030 · Cited by 28
Expression Patterns of ABC Transporter Genes in Fluconazole-Resistant Candida glabrata
Gohar, A. A., Badali, H., Shokohi, T., Nabili, M., Amirrajab, N., & Moazeni, M. (2017) · Mycopathologia · doi:10.1007/s11046-016-0074-8 · Cited by 25
Tati, S., Jang, W. S., Li, R. Q., Kumar, R., Puri, S., & Edgerton, M. (2013) · PLoS ONE · doi:10.1371/journal.pone.0061480 · Cited by 25
Sturm, L., Geißel, B., Martin, R., & Wagener, J. (2020) · Frontiers in Microbiology · doi:10.3389/fmicb.2020.01017 · Cited by 23
Borah, S., Shivarathri, R., Srivastava, V. K., Ferrari, S., Sanglard, D., & Kaur, R. (2014) · Antimicrobial Agents and Chemotherapy · doi:10.1128/aac.02786-14 · Cited by 21
Self-citationJjj1 Is a Negative Regulator of Pdr1-Mediated Fluconazole Resistance in Candida glabrata
Whaley, S., Caudle, K. E., Šimoničová, L., Zhang, Q., Moye-Rowley, S., & Rogers, P. D. (2018) · mSphere · doi:10.1128/msphere.00466-17 · Cited by 21
Candida glabrata, Friend and Foe
Tám, P., Gee, K., Piechocinski, M., & Macreadie, I. (2015) · Journal of Fungi · doi:10.3390/jof1020277 · Cited by 21
Culakova, H., Džugasová, V., Perzelova, J., Gbelská, Y., & Šubík, J. (2013) · Yeast · doi:10.1002/yea.2978 · Cited by 18
Lotfali, E., Fattahi, A., Sayyahfar, S., Ghasemi, R., Rabiei, M. M., Fathi, M., Vakili, K. G., Deravi, N., Soheili, A., Toreyhi, H., et al. (2021) · Microbial Drug Resistance · doi:10.1089/mdr.2020.0235 · Cited by 18
Pfaller, M. A., Castanheira, M., Lockhart, S. R., & Jones, R. N. (2012) · Current Fungal Infection Reports · doi:10.1007/s12281-012-0091-0 · Cited by 17
The MNN2 Gene Knockout Modulates the Antifungal Resistance of Biofilms of Candida glabrata
Rodrigues, C. F., Boas, D. V., Haynes, K., & Henriques, M. (2018) · Biomolecules · doi:10.3390/biom8040130 · Cited by 17
Schrevens, S., Durandau, E., Tran, V. D. T., & Sanglard, D. (2022) · Virulence · doi:10.1080/21505594.2022.2095716 · Cited by 16
Self-citationSalazar, S. B., Pinheiro, M. J. F., Sotti-Novais, D., Soares, A. R., Lopes, M. M., Ferreira, T., Rodrigues, V., Fernandes, F., & Mira, N. P. (2022) · G3 Genes Genomes Genetics · doi:10.1093/g3journal/jkac110 · Cited by 16
Antifungal Susceptibility Testing: A Primer for Clinicians
Kuper, K. M., Coyle, E. A., & Wanger, A. R. (2012) · Pharmacotherapy The Journal of Human Pharmacology and Drug Therapy · doi:10.1002/phar.1146 · Cited by 16
Glabridin induces overexpression of two major apoptotic genes, MCA1 and NUC1 , in Candida albicans
Nabili, M., Moazeni, M., Hedayati, M. T., Aryamlo, P., Gohar, A. A., Madani, S. M., & Fathi, H. (2017) · Journal of Global Antimicrobial Resistance · doi:10.1016/j.jgar.2017.08.006 · Cited by 15
Halder, V., McDonnell, B., Uthayakumar, D., Usher, J., & Shapiro, R. S. (2020) · FEMS Microbiology Reviews · doi:10.1093/femsre/fuaa055 · Cited by 14
Mitochondrial Genome Sequences of the Emerging Fungal Pathogen Candida auris
Misas, E., Chow, N. A., Gómez, O. M., Muñoz, J. F., McEwen, J. G., Litvintseva, A. P., & Clay, O. (2020) · Frontiers in Microbiology · doi:10.3389/fmicb.2020.560332 · Cited by 13
Frontiers in superbug management: innovating approaches to combat antimicrobial resistance
Chambial, P., Thakur, N., Bhukya, P. L., Anbazhagan, S., & Kumar, U. (2025) · Archives of Microbiology · doi:10.1007/s00203-025-04262-x · Cited by 15
RNAi as a Tool to Study Virulence in the Pathogenic Yeast Candida glabrata
Ishchuk, O. P., Ahmad, K. M., Koruza, K., Bojanovič, K., Sprenger, M., Kasper, L., Brunke, S., Hube, B., Säll, T., Hellmark, T., et al. (2019) · Frontiers in Microbiology · doi:10.3389/fmicb.2019.01679 · Cited by 12
Zambuzzi-Carvalho, P. F., Fernandes, A. G., Valadares, M. C., Tavares, P. D. M., Nosanchuk, J. D., Soares, C. M. D. A., & Pereira, M. (2015) · Medical Mycology · doi:10.1093/mmy/myv011 · Cited by 11
Chesdachai, S., Yetmar, Z. A., Ranganath, N., Everson, J. J., Wengenack, N. L., & Saleh, O. A. (2023) · Journal of Fungi · doi:10.3390/jof9080821 · Cited by 11
Fluorescent toys ‘n’ tools lighting the way in fungal research
Genechten, W. V., Dijck, P. V., & Demuyser, L. (2021) · FEMS Microbiology Reviews · doi:10.1093/femsre/fuab013 · Cited by 12
Kołaczkowska, A., Dyląg, M., & Kołaczkowski, M. (2013) · Biochemical and Biophysical Research Communications · doi:10.1016/j.bbrc.2013.01.047 · Cited by 9
Tian, Y., Zhuang, Y., Chen, Z., Mao, Y., Zhang, J., Lu, R., & Guo, L. (2020) · Microbiological Research · doi:10.1016/j.micres.2020.126519 · Cited by 7
Investigating Candida glabrata Urinary Tract Infections (UTIs) in Mice Using Bioluminescence Imaging
Schrevens, S., & Sanglard, D. (2021) · Journal of Fungi · doi:10.3390/jof7100844 · Cited by 9
Self-citationMechanisms of Resistance to Antifungal Agents
Perlin, D. S. (2015) · ASM Press eBooks · doi:10.1128/9781555817381.ch130 · Cited by 7
Characterization of the Candida glabrata Transcription Factor CgMar1: Role in Azole Susceptibility
Pais, P., Galocha, M., Califórnia, R., Viana, R., Ola, M., Okamoto, M., Chibana, H., Butler, G., & Teixeira, M. C. (2022) · Journal of Fungi · doi:10.3390/jof8010061 · Cited by 7
Edlind, T., & Katiyar, S. K. (2022) · Antimicrobial Agents and Chemotherapy · doi:10.1128/aac.00721-22 · Cited by 8
Microevolution of Candida glabrata (Nakaseomyces glabrata) during an infection
López-Marmolejo, A. L., Hernández-Chávez, M. J., Gutiérrez‐Escobedo, G., Herrera-Basurto, M. S., Mora-Montes, H. M., Peñas, A. D. L., & Castaño, I. (2024) · Fungal Genetics and Biology · doi:10.1016/j.fgb.2024.103891 · Cited by 6
Spettel, K., Bumberger, D., Kriz, R., Frank, S., Loy, M., Galazka, S., Suchomel, M., Lagler, H., Makristathis, A., & Willinger, B. (2025) · Antimicrobial Resistance and Infection Control · doi:10.1186/s13756-024-01511-4 · Cited by 8
Tian, Y., Gao, N., Ni, Q., Mao, Y., Dong, D., Huang, X., Jiang, C., Li, Z., Zhang, L., Wang, X., et al. (2018) · FEMS Yeast Research · doi:10.1093/femsyr/foy038 · Cited by 6
Cavalheiro, M., Romão, D., Santos, R., Mil‐Homens, D., Pais, P., Costa, C., Galocha, M., Pereira, D., Takahashi‐Nakaguchi, A., Chibana, H., et al. (2021) · International Journal of Molecular Sciences · doi:10.3390/ijms22031376 · Cited by 6
Šimoničová, L., & Moye-Rowley, S. (2023) · Methods in molecular biology · doi:10.1007/978-1-0716-3155-3_11 · Cited by 2
Antifungal Resistance in Candida albicans
Seyedjavadi, S. S., Hatami, F., & Jahanshiri, Z. (2024) · IntechOpen eBooks · doi:10.5772/intechopen.1004578 · Cited by 3
Microevolution of Antifungal Drug Resistance
Cowen, L. E. (2014) · Springer eBooks · doi:10.1007/978-1-4939-0667-3_19-1 · Cited by 2
A novel Candida glabrata doxycycline-inducible system for in vitro/in vivo use
Schrevens, S., & Sanglard, D. (2022) · FEMS Yeast Research · doi:10.1093/femsyr/foac046 · Cited by 2
Self-citationMechanisms of Resistance to Antifungal Agents
Perlin, D. S. (2023) · ClinMicroNow · doi:10.1002/9781683670438.mcm0134 · Cited by 2
Balazfyova, Z., Hervay, N. T., & Gbelská, Y. (2013) · Yeast · doi:10.1002/yea.2941 · Cited by 1
Miguel, C. M. (2012) · InTech eBooks · doi:10.5772/32603 · Cited by 1
Metadata
- Authors
- Ferrari, S., Sanguinetti, M., Torelli, R., Posteraro, B., & Sanglard, D.
- Affiliations
- University of Lausanne (CH)
- Università Cattolica del Sacro Cuore (IT)
- Centre Hospitalier Universitaire Vaudois (CH)
- Corresponding author
- Sanglard, Dominique
- Venue
- PLoS ONE
- Publisher
- Public Library of Science (PLoS)
- Published
- 2011-03-09
- Volume
- 6
- Issue
- 3
- Pages
- e17589
- ISSN
- 1932-6203 (ISSN-L)
- PMC
- PMC3052359
- OpenAlex
- W2091654454
- Cited by
- 110
- References
- 48
- Citations by year
- 2026: 1 · 2025: 3 · 2024: 2 · 2023: 8 · 2022: 7 · 2021: 7 · 2020: 9 · 2019: 7 · 2018: 10 · 2017: 7 · 2016: 9 · 2015: 7 · 2014: 10 · 2013: 11 · 2012: 9
- FWCI
- 7.13
- Type
- journal article
- Language
- en
- Open access
- gold
- doi.org
- Licence
- cc-by
- Locations
- PLoS ONE (publishedVersion, cc-by)
- PubMed Central (publishedVersion, cc-by)
- PubMed (publishedVersion)
- IRIS (submittedVersion)
- PubliCatt (Università Cattolica del Sacro Cuore) (submittedVersion, cc-by)
- DOAJ (DOAJ: Directory of Open Access Journals) (submittedVersion)
- Figshare (submittedVersion, cc-by)
- SERVAL (Université de Lausanne) (submittedVersion, other-oa)
- Topics
- Health Sciences › Medicine › Infectious Diseases › Antifungal resistance and susceptibility
- Life Sciences › Biochemistry, Genetics and Molecular Biology › Molecular Biology › Fungal and yeast genetics research
- Health Sciences › Medicine › Infectious Diseases › Fungal Infections and Studies
- Keywords
- Candida glabrata, azole resistance, virulence, gain-of-function mutations, ABC transporters, transcriptional regulation, gene co-regulation, tissue burden, antifungal resistance
- MeSH terms
- Animals, Antifungal Agents, Azoles, Candidiasis, Disease Models, Animal, Female, Fungal Proteins, Genes, Fungal, Mice, Inbred BALB C, Microbial Sensitivity Tests, Mitochondria, Mutation, Transcription, Genetic, Virulence, Colony Count, Microbial, Fluconazole, Gene Expression Regulation, Fungal, Gene Expression Profiling, Drug Resistance, Fungal, Candida glabrata, Mice
About these checks
Registry, retraction, Cites and statistics results are computed, not judged, with one exception: a printed reference that no index lists is read once by a model before it counts as a citation error. Claims are extracted by a model and kept only when their quote appears verbatim in the text; each cited source is then checked, with a model’s help, for whether it says what the claim relies on. Those verdicts can be wrong — read the claim’s quote and the cited source before relying on one.
Statistics and arithmetic are recomputed, not judged.
Confidence bands are shown only for fields calibrated on our annotated test set. None is calibrated yet, so no band is shown.
What counts as a claim ›How we measure confidence ›How we check this ›
Are you an author, or do you see a problem with this page? Request a review
