

The DOI matches its Crossref record; 59 of the 59 references it cites were found in a registry or an index.
Fucoidan Extract Induces Apoptosis in MCF-7 Cells via a Mechanism Involving the ROS-Dependent JNK Activation and Mitochondria-Mediated Pathways
Open accessAbstract
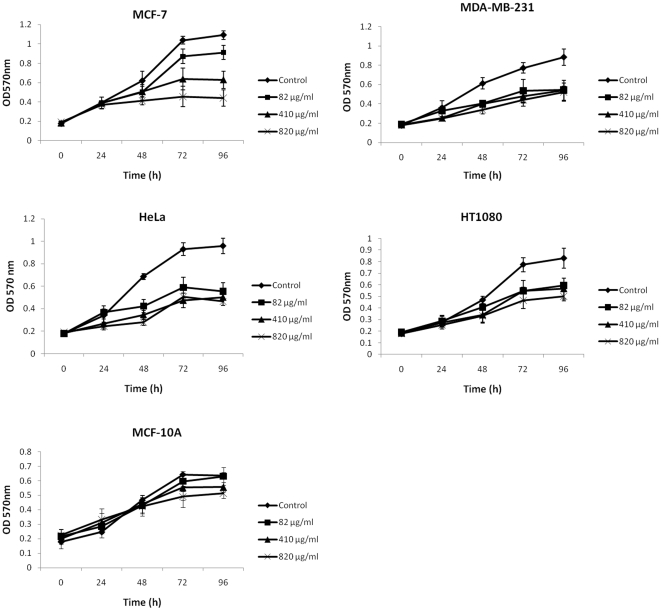
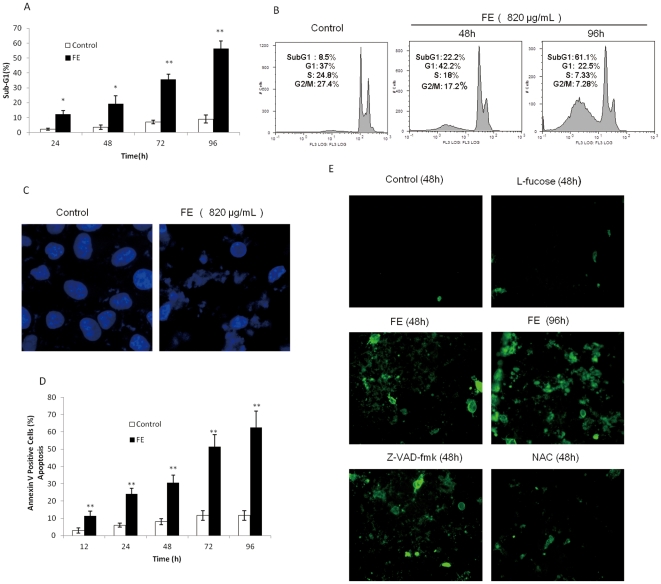
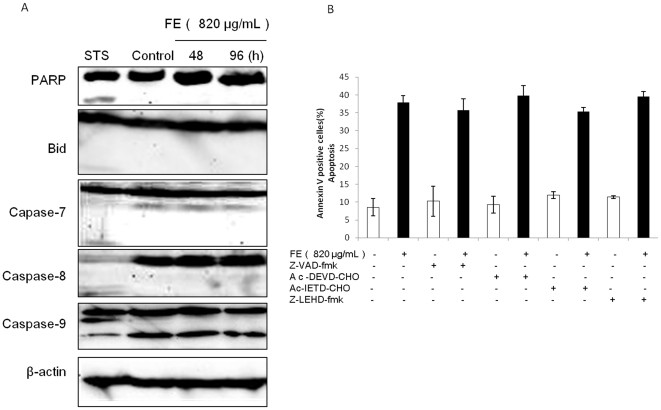
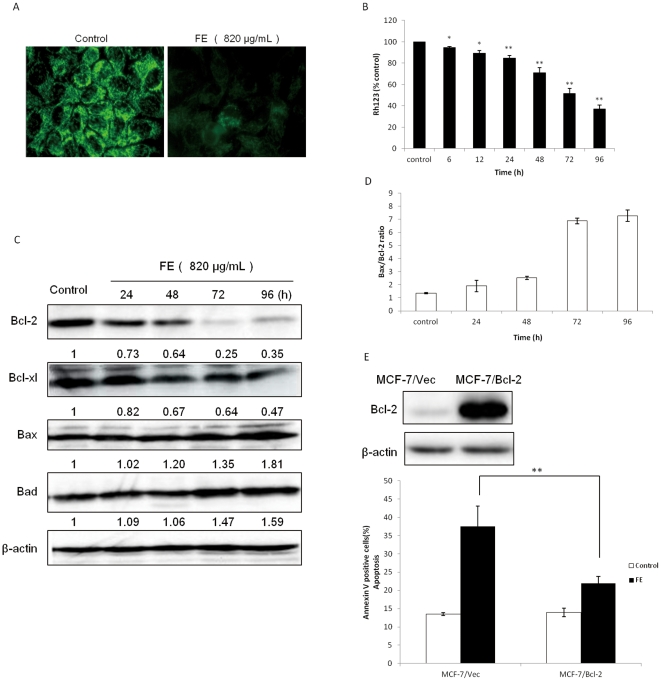
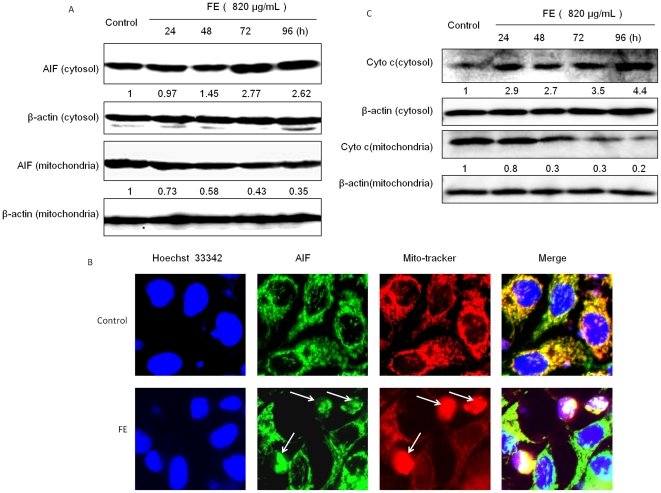
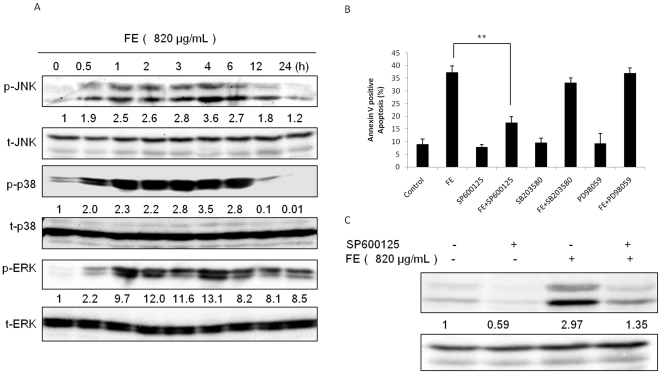
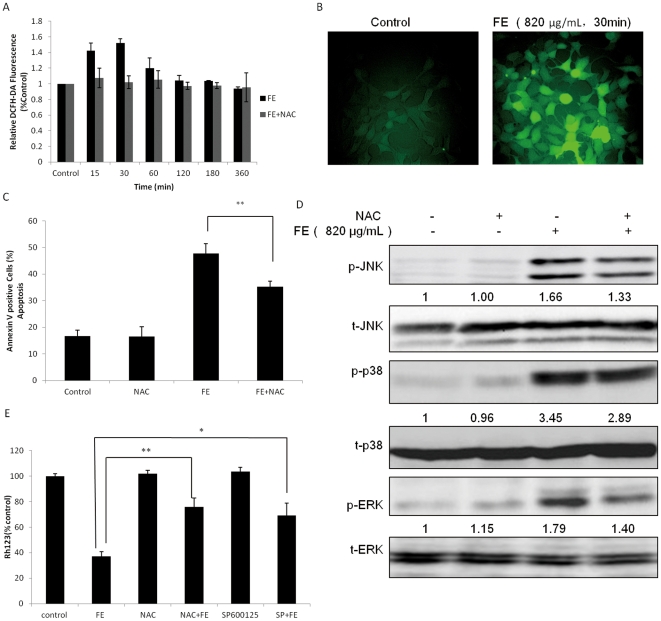
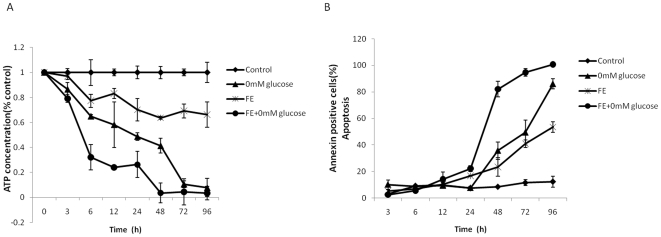
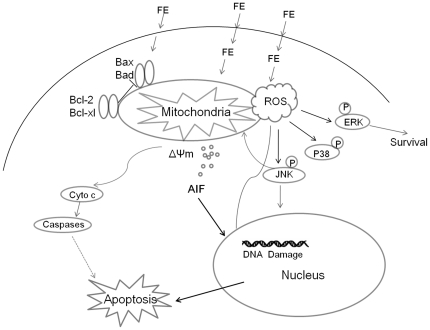
BACKGROUND: Fucoidan extract (FE), an enzymatically digested compound with a low molecular weight, is extracted from brown seaweed. As a natural compound with various actions, FE is attractive, especially in Asian countries, for improving the therapeutic efficacy and safety of cancer treatment. The present study was carried out to investigate the anti-tumor properties of FE in human carcinoma cells and further examine the underlying mechanisms of its activities. METHODOLOGY/PRINCIPAL FINDING: FE inhibits the growth of MCF-7, MDA-MB-231, HeLa, and HT1080 cells. FE-mediated apoptosis in MCF-7 cancer cells is accompanied by DNA fragmentation, nuclear condensation, and phosphatidylserine exposure. FE induces mitochondrial membrane permeabilization (MMP) through loss of mitochondrial membrane potential (ΔΨm) and regulation of the expression of Bcl-2 family members. Release of apoptosis-inducing factor (AIF) and cytochrome c precedes MMP. AIF release causes DNA fragmentation, the final stage of apoptosis, via a caspase-independent mitochondrial pathway. Additionally, FE was found to induce phosphorylation of c-Jun N-terminal kinase (JNK), p38, and extracellular signal-regulated kinase (ERK) 1/2, and apoptosis was found to be attenuated by inhibition of JNK. Furthermore, FE-mediated apoptosis was found to involve the generation of reactive oxygen species (ROS), which are responsible for the decrease of ΔΨm and phosphorylation of JNK, p38, and ERK1/2 kinases. CONCLUSIONS/SIGNIFICANCE: These data suggest that FE activates a caspase-independent apoptotic pathway in MCF-7 cancer cells through activation of ROS-mediated MAP kinases and regulation of the Bcl-2 family protein-mediated mitochondrial pathway. They also provide evidence that FE deserves further investigation as a natural anticancer and cancer preventive agent.
Overview
The claims and statistics of this paper haven’t been checked yet.
Run the check — free, no account needed. It reads the open-access text and checks the sources it cites.
Integrity signals
Registry
Cites
Statistics
Figures
Verification
Claims the paper makes
The claims and statistics of this paper haven’t been checked yet.
Run the check — free, no account needed. It reads the open-access text and checks the sources it cites.
Claims other papers make about this one
Each is checked against this paper’s own text: does it say what the citing paper says it does?
In the citing paper
“The caspase-independent apoptotic pathway was demonstrated for fucoidan from Cladosiphon novae-caledoniae [41].”
From Anticancer and Cancer Preventive Properties of Marine Polysaccharides: Some Results and Prospects (2013) · cites this paper as [41]
In the citing paper
“Sometimes this mechanism involved the reactive oxygen species (ROS)-dependent JNK activation as was shown for partly digested fucoidan from commercially available seaweed C. novae-caledoniae using MCF-7 and MDA-MB-10A tumor cells [41].”
From Anticancer and Cancer Preventive Properties of Marine Polysaccharides: Some Results and Prospects (2013) · cites this paper as [41]
Self-check
Percentages, sums and reported differences re-computed from the paper’s own numbers.
The self-check needs the paper’s full text.
Citations
Cites
The Bcl-2 Protein Family: Arbiters of Cell Survival
Adams, J. M., & Cory, S. (1998) · Science · doi:10.1126/science.281.5381.1322 · Cited by 5,334
Opposing Effects of ERK and JNK-p38 MAP Kinases on Apoptosis
Xia, Z., Dickens, M., Raingeaud, J., Davis, R. J., & Greenberg, M. E. (1995) · Science · doi:10.1126/science.270.5240.1326 · Cited by 5,273
Mitogen-Activated Protein Kinase Pathways Mediated by ERK, JNK, and p38 Protein Kinases
Johnson, G. L., & Lapadat, R. (2002) · Science · doi:10.1126/science.1072682 · Cited by 4,295
Reactive oxygen species, cellular redox systems, and apoptosis
Circu, M. L., & Aw, T. Y. (2010) · Free Radical Biology and Medicine · doi:10.1016/j.freeradbiomed.2009.12.022 · Cited by 3,340
Mitochondrial control of cell death
Kroemer, G., & Reed, J. C. (2000) · Nature Medicine · doi:10.1038/74994 · Cited by 3,103
Role of reactive oxygen species (ROS) in apoptosis induction
Simon, H.-U., Haj-Yehia, A., & Levi-Schaffer, F. (2000) · Apoptosis · doi:10.1023/a:1009616228304 · Cited by 2,774
Signal integration by JNK and p38 MAPK pathways in cancer development
Wagner, E. F., & Nebreda, Á. R. (2009) · Nature reviews. Cancer · doi:10.1038/nrc2694 · Cited by 2,635
(2001) · PubMed · Cited by 2,381
Kamata, H., Honda, S.-I., Maeda, S., Chang, L., Hirata, H., & Karin, M. (2005) · Cell · doi:10.1016/j.cell.2004.12.041 · Cited by 1,792
Requirement of JNK for Stress- Induced Activation of the Cytochrome c-Mediated Death Pathway
Tournier, C., Hess, P., Yang, D. D., Xu, J., Turner, T. K., Nimnual, A., Bar-Sagi, D., Jones, S. N., Flavell, R. A., & Davis, R. J. (2000) · Science · doi:10.1126/science.288.5467.870 · Cited by 1,728
Cited by
Sorted by citations
Borst, O., Walker, B., Münzer, P., Russo, A., Schmid, E., Faggio, C., Bigalke, B., Laufer, S., Gawaz, M., & Lang, F. J. W. (2013) · Cellular Physiology and Biochemistry · doi:10.1159/000350110 · Cited by 1,867
Oxidative stress and cancer: An overview
Iglesias, V. S., Moliné, T., Somoza, R., Paciucci, R., Kondoh, H., & LLeonart, M. E. (2012) · Ageing Research Reviews · doi:10.1016/j.arr.2012.10.004 · Cited by 1,488
Marine Polysaccharides from Algae with Potential Biomedical Applications
Raposo, M. F. D. J., Morais, A. M. M. B., & Morais, R. M. S. C. (2015) · Marine Drugs · doi:10.3390/md13052967 · Cited by 712
Fucoidan and Cancer: A Multifunctional Molecule with Anti-Tumor Potential
Atashrazm, F., Lowenthal, R. M., Woods, G. M., Holloway, A. F., & Dickinson, J. L. (2015) · Marine Drugs · doi:10.3390/md13042327 · Cited by 367
Fucoidans as a natural bioactive ingredient for functional foods
Vo, T., & Kim, S. (2012) · Journal of Functional Foods · doi:10.1016/j.jff.2012.08.007 · Cited by 237
Brown Algae Carbohydrates: Structures, Pharmaceutical Properties, and Research Challenges
Li, Y., Zheng, Y., Zhang, Y., Yang, Y., Wang, P., Imre, B., Wong, A. C. Y., Hsieh, Y. S. Y., & Wang, D. (2021) · Marine Drugs · doi:10.3390/md19110620 · Cited by 248
Fucoidan as a Marine Anticancer Agent in Preclinical Development
Kwak, J. (2014) · Marine Drugs · doi:10.3390/md12020851 · Cited by 222
A review about the development of fucoidan in antitumor activity: Progress and challenges
Wu, L., Sun, J., Su, X., Yu, Q., Yu, Q., & Zhang, P. (2016) · Carbohydrate Polymers · doi:10.1016/j.carbpol.2016.08.005 · Cited by 217
Pádua, D., Rocha, E., Gargiulo, D., & Ramos, A. A. (2015) · Phytochemistry Letters · doi:10.1016/j.phytol.2015.09.007 · Cited by 212
Anticancer properties and mechanisms of fucoidan on mouse breast cancer in vitro and in vivo
Xue, M., Ge, Y., Zhang, J., Wang, Q., Hou, L., Liu, Y., Sun, L., & Li, Q. (2012) · PLoS ONE · doi:10.1371/journal.pone.0043483 · Cited by 192
Anticancer and Cancer Preventive Properties of Marine Polysaccharides: Some Results and Prospects
Fedorov, S., Ermakova, S., Zvyagintseva, T., & Stonik, V. (2013) · Marine Drugs · doi:10.3390/md11124876 · Cited by 189
Yang, L., Wang, P., Wang, H., Li, Q., Teng, H., Liu, Z., Yang, W., Hou, L., & Zou, X. (2013) · Marine Drugs · doi:10.3390/md11061961 · Cited by 178
Zhang, Z., Teruya, K., Yoshida, T., Eto, H., & Shirahata, S. (2013) · Marine Drugs · doi:10.3390/md11010081 · Cited by 147
Self-citationClinical applications of fucoidan in translational medicine for adjuvant cancer therapy
Hsu, H., & Hwang, P. (2019) · Clinical and Translational Medicine · doi:10.1186/s40169-019-0234-9 · Cited by 158
Shrivastava, S., Jeengar, M. K., Reddy, V., Reddy, G. B., & Naidu, V. G. M. (2015) · Experimental and Molecular Pathology · doi:10.1016/j.yexmp.2015.03.031 · Cited by 149
Cell Wall Polysaccharides of Marine Algae
Synytsya, A., Čopı́ková, J., Kim, W. J., & Park, Y. I. (2015) · Springer eBooks · doi:10.1007/978-3-642-53971-8_22 · Cited by 144
Pradhan, B., Patra, S., Nayak, R., Behera, C., Dash, S. R., Nayak, S., Sahu, B. B., Bhutia, S. K., & Jena, M. (2020) · International Journal of Biological Macromolecules · doi:10.1016/j.ijbiomac.2020.09.019 · Cited by 143
Advances in anti-cancer effects and underlying mechanisms of marine algae polysaccharides
Yao, W., Qiu, H., Cheong, K., & Zhong, S. (2022) · International Journal of Biological Macromolecules · doi:10.1016/j.ijbiomac.2022.09.055 · Cited by 126
“Fucoidan, a natural biopolymer in cancer combating: From edible algae to nanocarrier tailoring”
Etman, S. M., Elnaggar, Y. S. R., & Abdallah, O. Y. (2019) · International Journal of Biological Macromolecules · doi:10.1016/j.ijbiomac.2019.11.191 · Cited by 121
Hsu, H.-Y., Lin, T., Lu, M., Leng, P.-J., Tsao, S.-M., & Wu, Y. (2017) · Scientific Reports · doi:10.1038/srep44990 · Cited by 114
Deepika, M. S., Thangam, R., Sheena, T. S., Sasirekha, R., Sivasubramanian, S., Babu, M. D., Jeganathan, K., & Ramasamy, T. (2018) · Biomedicine & Pharmacotherapy · doi:10.1016/j.biopha.2018.10.178 · Cited by 105
Shiau, J., Chuang, Y.-T., Cheng, Y., Tang, J., Hou, M., Yen, C., & Chang, H. (2022) · Antioxidants · doi:10.3390/antiox11050911 · Cited by 99
The Therapeutic Potential of the Anticancer Activity of Fucoidan: Current Advances and Hurdles
Jin, J., Chauhan, P., Arukha, A. P., Chavda, V. K., Dubey, A., & Yadav, D. (2021) · Marine Drugs · doi:10.3390/md19050265 · Cited by 100
Tie, H., Wu, P., Jiang, W., Liu, Y., Kuang, S., Zeng, Y.-Y., Jiang, J., Tang, L. Y., Zhou, X., & Feng, L. (2018) · Aquaculture · doi:10.1016/j.aquaculture.2018.12.045 · Cited by 96
Fucoidan Induces Cancer Cell Apoptosis by Modulating the Endoplasmic Reticulum Stress Cascades
Chen, S., Zhao, Y., Zhang, Y., & Zhang, D. (2014) · PLoS ONE · doi:10.1371/journal.pone.0108157 · Cited by 95
Zhang, Y., Ahmad, K. A., Khan, F. U., Yan, S., Ihsan, A. U., & Ding, Q. (2019) · Chemico-Biological Interactions · doi:10.1016/j.cbi.2019.03.027 · Cited by 84
Ryu, M. J., & Chung, H. S. (2016) · Molecular Medicine Reports · doi:10.3892/mmr.2016.5623 · Cited by 84
Lu, J., Shi, K., Chen, S., Wang, J., Hassouna, A., White, L. N., Mérien, F., Xie, M., Kong, Q., Li, J., et al. (2018) · Marine Drugs · doi:10.3390/md16120461 · Cited by 80
Zhang, Z., Teruya, K., Hiroshi, E. T. O., & Shirahata, S. (2013) · Bioscience Biotechnology and Biochemistry · doi:10.1271/bbb.120631 · Cited by 77
Self-citationXue, M., Ji, X., Xue, C., Liang, H. W., Ge, Y., He, X., Zhang, L., Bian, K., & Zhang, L. (2017) · Biomedicine & Pharmacotherapy · doi:10.1016/j.biopha.2017.08.013 · Cited by 77
Park, H., Kim, G., Moon, S., Kim, W., Yoo, Y. H., & Choi, Y. H. (2014) · Molecules · doi:10.3390/molecules19055981 · Cited by 77
Banafa, A. M., Roshan, S., Liu, Y., Chen, H., Chen, M., Yang, G., & He, G. (2013) · Journal of Huazhong University of Science and Technology [Medical Sciences] · doi:10.1007/s11596-013-1186-8 · Cited by 74
Pawar, V. K., Singh, Y., Sharma, K., Shrivastav, A., Sharma, A., Singh, A., Meher, J. G., Singh, P. K., Raval, K., Kumar, A., et al. (2018) · International Journal of Biological Macromolecules · doi:10.1016/j.ijbiomac.2018.09.059 · Cited by 78
Seaweed-Derived Sulfated Polysaccharides; The New Age Chemopreventives: A Comprehensive Review
Bhuyan, P. P., Nayak, R., Patra, S., Abdulabbas, H. S., Jena, M., & Pradhan, B. (2023) · Cancers · doi:10.3390/cancers15030715 · Cited by 86
Fucoidan-coated CuS nanoparticles for chemo-and photothermal therapy against cancer
Jang, B., Santhamoorthy, M., Manivasagan, P., Xu, L., Song, K., Lee, K. D., Kwak, M., Oh, J., & Jin, J. (2018) · Oncotarget · doi:10.18632/oncotarget.23898 · Cited by 71
Hwang, P., Hung, Y.-L., Phan, N. N., Hieu, B. T. N., Chang, P.-M., Li, K.-L., & Lin, Y. (2015) · Cytotechnology · doi:10.1007/s10616-015-9894-5 · Cited by 70
Shen, B., He, P.-J., & Shao, C.-L. (2013) · PLoS ONE · doi:10.1371/journal.pone.0084610 · Cited by 66
Wang, D., Wong, H.-K., Feng, Y., & Zhang, Z. (2013) · Journal of Neuro-Oncology · doi:10.1007/s11060-013-1292-2 · Cited by 63
Self-citationChen, W., Kuo, T.-H., Tzeng, Y.-S., & Tsai, Y.-C. (2012) · Molecules · doi:10.3390/molecules17043844 · Cited by 62
Hamid, N., Ma, Q., Boulom, S., Liu, T., Zheng, Z., Balbas, J., & Robertson, J. (2015) · Elsevier eBooks · doi:10.1016/b978-0-12-418697-2.00008-8 · Cited by 61
Han, M. H., Lee, D., Jeong, J., Hong, S. H., Choi, I., Cha, H., Kim, S., Kim, H., Park, C., Kim, G., et al. (2016) · Drug Development Research · doi:10.1002/ddr.21367 · Cited by 62
Delma, C. R., Somasundaram, S. T., Srinivasan, G. P., Raviprakash, N., Manna, S. K., Natarajan, M., & Aravindan, N. (2019) · Phytochemistry · doi:10.1016/j.phytochem.2019.112078 · Cited by 60
Dong, Y., Feng, L., Jiang, W., Liu, Y., Wu, P., Jiang, J., Kuang, S., Tang, L. Y., Tang, W., Zhang, Y., et al. (2017) · Fish & Shellfish Immunology · doi:10.1016/j.fsi.2017.10.048 · Cited by 59
Vishchuk, O. S., Sun, H., Wang, Z., Ermakova, S. P., Xiao, J., Lu, T., Xue, P., Николаевна, З. Т., Xiong, H., Shao, C., et al. (2016) · Oncotarget · doi:10.18632/oncotarget.7708 · Cited by 57
Fernando, I. P. S., Sanjeewa, K. K. A., Lee, H.-G., Kim, H., Vaas, A. P. J. P., Silva, H. I. C. D., Nanayakkara, C. M., Abeytunga, D. T. U., Lee, D.-S., Lee, J.-S., et al. (2020) · Marine Drugs · doi:10.3390/md18040196 · Cited by 56
Shiau, J., Chuang, Y.-T., Yang, K., Chang, F., Sheu, J., Hou, M., Jeng, J., Tang, J., & Chang, H. (2022) · Antioxidants · doi:10.3390/antiox11050841 · Cited by 56
Huang, G., Zhao, H.-R., Meng, Q., Zhang, Q., Dong, J., Bao-quan, Z., & Li, S. (2017) · European Journal of Medicinal Chemistry · doi:10.1016/j.ejmech.2017.11.031 · Cited by 56
Han, M. H., Park, C., Jin, C., Kim, G., Chang, Y., Moon, S., Kim, W., & Choi, Y. H. (2013) · PLoS ONE · doi:10.1371/journal.pone.0063425 · Cited by 54
Immunopotentiating Activity of Fucoidans and Relevance to Cancer Immunotherapy
Li, Y., McGowan, E. M., Chen, S., Santos, J., Yin, H., & Lin, Y. (2023) · Marine Drugs · doi:10.3390/md21020128 · Cited by 52
Vishchuk, O., Ermakova, S., & Zvyagintseva, T. (2013) · Marine Drugs · doi:10.3390/md11010194 · Cited by 50
Chowdhury, S. R., Sengupta, S., Biswas, S., Sinha, T. K., Sen, R., Basak, R. K., Adhikari, B., & Bhattacharyya, A. (2014) · PLoS ONE · doi:10.1371/journal.pone.0113663 · Cited by 50
RetractedWei, C., Xiao, Q., Kuang, X., Zhang, T., Yang, Z., & WANG, L. (2015) · Molecular Medicine Reports · doi:10.3892/mmr.2015.4252 · Cited by 49
Hwang, P., Yan, M., Kuo, K.-L., Phan, N. N., & Lin, Y. (2016) · Journal of Applied Phycology · doi:10.1007/s10811-016-0929-x · Cited by 49
Chen, L., Liu, P., Chen, Y., Tseng, H., Shen, P.-C., Hwang, P., & Hsu, H.-L. (2017) · Scientific Reports · doi:10.1038/s41598-017-12111-1 · Cited by 50
Fucoidan Suppresses the Growth of Human Acute Promyelocytic Leukemia Cells In Vitro and In Vivo
Atashrazm, F., Lowenthal, R. M., Woods, G. M., Holloway, A. F., Karpiniec, S. S., & Dickinson, J. L. (2015) · Journal of Cellular Physiology · doi:10.1002/jcp.25119 · Cited by 50
Zuo, Y.-H., Han, Q., Dong, G., Yue, R.-Q., Ren, X., Liu, J., Liu, L., Luo, P., & Zhou, H. (2018) · Frontiers in Physiology · doi:10.3389/fphys.2018.00699 · Cited by 49
Novel Fucoidan Pharmaceutical Formulations and Their Potential Application in Oncology—A Review
Zahariev, N., Katsarov, P., Lukova, P., & Pilicheva, B. (2023) · Polymers · doi:10.3390/polym15153242 · Cited by 48
Seaweed sulfated polysaccharides and their medicinal properties
Zaitseva, O. O., Sergushkina, M. I., Khudyakov, A. N., Polezhaeva, T. V., & Solomina, O. N. (2022) · Algal Research · doi:10.1016/j.algal.2022.102885 · Cited by 48
Comparison of the Effects of Fucoidans on the Cell Viability of Tumor and Non-Tumor Cell Lines
Bittkau, K. S., Dörschmann, P., Blümel, M., Taşdemir, D., Roider, J. B., Klettner, A., & Alban, S. (2019) · Marine Drugs · doi:10.3390/md17080441 · Cited by 45
Fucoidan Inhibition of Osteosarcoma Cells is Species and Molecular Weight Dependent
Gupta, D., Silva, M., Radziun, K., Martinez, D. C., Hill, C. J., Marshall, J., Hearnden, V. L., Puertas-Mejía, M. A., & Reilly, G. C. (2020) · Marine Drugs · doi:10.3390/md18020104 · Cited by 46
Ho, T.-L., Mutalik, C., Rethi, L., Nguyen, H.-N. T., Jheng, P., Wong, C.-C., Yang, T., Nguyen, T. T. D., Mansel, B. W., Wang, C.-A., et al. (2023) · International Journal of Biological Macromolecules · doi:10.1016/j.ijbiomac.2023.123821 · Cited by 42
Antitumor activity of fucoidan against diffuse large B cell lymphoma in vitro and in vivo
Yang, G., Zhang, Q., Kong, Y., Xie, B., Gao, M., Yi, T., Xu, H., Zhan, F., Dai, B., Shi, J., et al. (2015) · Acta Biochimica et Biophysica Sinica · doi:10.1093/abbs/gmv094 · Cited by 45
Wang, D., Lü, J., Liu, Y., Meng, Q., Xie, J., Wang, Z., & Teng, L. (2014) · BioMed Research International · doi:10.1155/2014/965316 · Cited by 41
Zayed, A., Finkelmeier, D., Hahn, T., Rebers, L., Shanmugam, A., Burger‐Kentischer, A., & Ulber, R. (2023) · Marine Drugs · doi:10.3390/md21010048 · Cited by 43
Sharma, G., Kar, S., Ball, W. B., Ghosh, K., & Das, P. K. (2014) · Cellular and Molecular Immunology · doi:10.1038/cmi.2013.68 · Cited by 40
Cernadas, H., Flórez-Fernández, N., González-Muñoz, M. J., Domínguez, H., & Torres, M. D. (2019) · Food and Bioproducts Processing · doi:10.1016/j.fbp.2019.07.015 · Cited by 39
Fucoidan induces ROS-dependent epigenetic modulation in cervical cancer HeLa cell
Mustafa, S., Pawar, J. S., & Ghosh, I. (2021) · International Journal of Biological Macromolecules · doi:10.1016/j.ijbiomac.2021.03.110 · Cited by 41
Zueva, A. O., Silchenko, A. S., Rasin, A. B., Malyarenko, O. S., Игоревич, К. М., Kalinovsky, A. I., & Ermakova, S. P. (2023) · Carbohydrate Polymers · doi:10.1016/j.carbpol.2023.121128 · Cited by 37
Anti-neoplastic Potential of Flavonoids and Polysaccharide Phytochemicals in Glioblastoma
Atiq, A., & Parhar, I. S. (2020) · Molecules · doi:10.3390/molecules25214895 · Cited by 40
The Ameliorative Effects of Fucoidan in Thioacetaide-Induced Liver Injury in Mice
Tsai, M.-Y., Yang, W., Lin, C., Wang, C., Liu, H.-Y., Lin, C., Lin, J.-W., Lin, W., Lin, T.-C., Fan, P.-S., et al. (2021) · Molecules · doi:10.3390/molecules26071937 · Cited by 37
A bibenzyl from Dendrobium ellipsophyllum induces apoptosis in human lung cancer cells
Hlosrichok, A., Sumkhemthong, S., Sritularak, B., Pithi Chanvorachote, B., & Chaotham, C. (2018) · Journal of Natural Medicines · doi:10.1007/s11418-018-1186-x · Cited by 36
Li, Y., Guo, F., Guan, Y., Chen, T., Ma, K., Zhang, L., Wang, Z., Su, Q., Feng, L., Liu, Y., et al. (2020) · Molecules · doi:10.3390/molecules25071672 · Cited by 35
Anticancer Effects of Fucoidan
Kalimuthu, S., & Kim, S. (2014) · Advances in food and nutrition research · doi:10.1016/b978-0-12-800269-8.00011-7 · Cited by 36
Aravindan, S., Delma, C. R., Somasundaram, S. T., Herman, T. S., & Aravindan, N. (2013) · PLoS ONE · doi:10.1371/journal.pone.0061977 · Cited by 34
Choi, J., Lee, J., Kim, S. C., You, S., Lee, C. W., Shin, J., & Park, Y. I. (2018) · International Journal of Biological Macromolecules · doi:10.1016/j.ijbiomac.2018.12.001 · Cited by 35
Lkhagvasuren, K., & Kim, J. (2019) · Toxicology in Vitro · doi:10.1016/j.tiv.2019.04.028 · Cited by 36
Nezhad, S. M., Rahmavand, A., Kousha, A., Salehi, M. M., Pourmousavi, S. A., Zare, E. N., Maleki, A. R., & Makvandi, P. (2025) · International Journal of Biological Macromolecules · doi:10.1016/j.ijbiomac.2025.144406 · Cited by 33
Thiyagarajan, V., Sivalingam, K. S., Viswanadha, V. P., & Weng, C. (2016) · Environmental Toxicology and Pharmacology · doi:10.1016/j.etap.2016.06.005 · Cited by 33
Fucoidans: The importance of processing on their anti-tumoral properties
Torres, M. D., Flórez-Fernández, N., Simón‐Vázquez, R., Giménez-Abián, J. F., Díaz, J. F., González‐Fernández, Á., & Domı́nguez, H. (2019) · Algal Research · doi:10.1016/j.algal.2019.101748 · Cited by 34
Synthesis of novel ring-contracted artemisinin dimers with potent anticancer activities
Zhang, N., Yu, Z., Yang, X., Hu, P., & He, Y. (2018) · European Journal of Medicinal Chemistry · doi:10.1016/j.ejmech.2018.03.010 · Cited by 32
Anticancer Effect of Fucoidan in Combination with Tyrosine Kinase Inhibitor Lapatinib
Oh, B., Kim, J., Lu, W., & Rosenthal, D. S. (2014) · Evidence-based Complementary and Alternative Medicine · doi:10.1155/2014/865375 · Cited by 32
Abdollah, M. R. A., Ali, A. A., Elgohary, H. H., & Elmazar, M. M. (2023) · Frontiers in Pharmacology · doi:10.3389/fphar.2023.1108992 · Cited by 32
Saetan, U., Nontasak, P., Palasin, K., Saelim, H., Wonglapsuwan, M., Mayakun, J., Pongparadon, S., & Chotigeat, W. (2021) · Journal of Applied Phycology · doi:10.1007/s10811-021-02491-3 · Cited by 32
Ma, D., Wei, J., Chen, S., Wang, H., Ning, L., Luo, S., Liu, C.-L., Song, G., & Yao, Q. (2021) · Frontiers in Oncology · doi:10.3389/fonc.2021.653902 · Cited by 30
Giampietri, C., Petrungaro, S., Padula, F., D’Alessio, A., Marini, E. S., Facchiano, A., Filippini, A., & Ziparo, E. (2012) · APOPTOSIS · doi:10.1007/s10495-012-0752-z · Cited by 28
Phenomenological investigation of the cytotoxic activity of fucoidan isolated from Fucus vesiculosus
Zayed, A., Hahn, T., Finkelmeier, D., Burger‐Kentischer, A., Rupp, S., Krämer, R., & Ulber, R. (2019) · Process Biochemistry · doi:10.1016/j.procbio.2019.03.026 · Cited by 29
Bellan, D. D. L., Biscaia, S. M. P., Rossi, G. R., Cristal, A. M., Gonçalves, J. P., de Oliveira, C. C., Simas, F. F., Sabry, D. A., Rocha, H. A. O., Franco, C. R. C., et al. (2020) · Carbohydrate Polymers · doi:10.1016/j.carbpol.2020.116869 · Cited by 29
Wang, J., Duan, Y., Zhi, D., Li, G., Wang, L., Zhang, H., Gu, L., Ruan, H., Zhang, K., Liu, Q., et al. (2014) · Cell Biochemistry and Biophysics · doi:10.1007/s12013-014-0049-7 · Cited by 28
Malhão, F., Ramos, A. A., Macedo, A. C., & Rocha, E. (2021) · Toxics · doi:10.3390/toxics9020024 · Cited by 28
Polysaccharides with Antitumor Effect in Breast Cancer: A Systematic Review of Non-Clinical Studies
Corso, C. R., de Oliveira, N. M. T., Cordeiro, L. M., da Silva, K. S., Soczek, S. H. S., Rossato, V. F., Fernandes, E. S., & Ferreira, D. M. (2021) · Nutrients · doi:10.3390/nu13062008 · Cited by 29
Fucoidan, A Sulfated Polysaccharides from Brown Algae as Therapeutic Target for Cancer
Kalimuthu, S., & Kim, S. (2014) · Springer eBooks · doi:10.1007/978-3-319-07145-9_7 · Cited by 26
Chowdhury, S. R., Sengupta, S., Biswas, S., Sen, R., Sinha, T. K., Basak, R. K., Adhikari, B., & Bhattacharyya, A. (2014) · Molecular Carcinogenesis · doi:10.1002/mc.22236 · Cited by 26
Fucoidan induces caspase-dependent apoptosis in MC3 human mucoepidermoid carcinoma cells
LEE, H.-E., Choi, E., Shin, J., Lee, S., Park, K., Cho, N., & Cho, S. (2013) · Experimental and Therapeutic Medicine · doi:10.3892/etm.2013.1368 · Cited by 28
Jia, H., Li, Y., Zheng, Y., Wang, H., Zhao, F., Yang, X., Zhao, Q., Jiang, Y., & Man, C. (2024) · Carbohydrate Polymers · doi:10.1016/j.carbpol.2024.123183 · Cited by 24
Yang, X., Wang, S., Trangle, S. S., Li, Y., White, W. L., Li, J., Ying, T., Kong, Q., Zhao, Y., & Lu, J. (2018) · Marine Drugs · doi:10.3390/md16110454 · Cited by 24
Teruya, K., Kusumoto, Y., Eto, H., Nakamichi, N., & Shirahata, S. (2019) · Marine Drugs · doi:10.3390/md17070421 · Cited by 24
Self-citationThankam, F. G., & Jayabalan, M. (2015) · Journal of Colloid and Interface Science · doi:10.1016/j.jcis.2015.06.034 · Cited by 23
Hsieh, Y., Chang, C.-J., Wan, C.-F., Chen, C., Chiu, Y., Leu, Y., & Peng, K. (2013) · Molecules · doi:10.3390/molecules18021949 · Cited by 23
Park, H. Y., Choi, I., Kim, G., Kim, B. W., Kim, W., & Choi, Y. H. (2015) · Revista Brasileira de Farmacognosia · doi:10.1016/j.bjp.2015.03.011 · Cited by 24
Jang, H., Kang, K., & El‐Sayed, M. A. (2017) · Journal of Materials Chemistry B · doi:10.1039/c7tb01123g · Cited by 23
Metadata
- Authors
- Zhang, Z., Teruya, K., Eto, H., & Shirahata, S.
- Affiliations
- Kyushu University (JP)
- Daiichi-Sankyo (Japan) (JP)
- Corresponding author
- Teruya, Kiichiro
- Venue
- PLoS ONE
- Publisher
- Public Library of Science (PLoS)
- Published
- 2011-11-11
- Volume
- 6
- Issue
- 11
- Pages
- e27441
- ISSN
- 1932-6203 (ISSN-L)
- PMC
- PMC3214060
- OpenAlex
- W2129739698
- Cited by
- 167
- References
- 59
- Citations by year
- 2026: 5 · 2025: 8 · 2024: 8 · 2023: 14 · 2022: 12 · 2021: 10 · 2020: 9 · 2019: 15 · 2018: 13 · 2017: 10 · 2016: 12 · 2015: 13 · 2014: 16 · 2013: 14 · 2012: 8
- FWCI
- 18.42
- Type
- journal article
- Language
- en
- Open access
- gold
- doi.org
- Locations
- PLoS ONE (publishedVersion, cc-by)
- PubMed Central (publishedVersion, cc-by)
- PubMed (publishedVersion)
- DOAJ (DOAJ: Directory of Open Access Journals) (submittedVersion, cc-by-sa)
- Funders
- Japan Society for the Promotion of Science (23580172)
- Topics
- Life Sciences › Agricultural and Biological Sciences › Aquatic Science › Seaweed-derived Bioactive Compounds
- Life Sciences › Biochemistry, Genetics and Molecular Biology › Molecular Biology › Cell death mechanisms and regulation
- Physical Sciences › Chemistry › Organic Chemistry › Natural product bioactivities and synthesis
- Keywords
- fucoidan, apoptosis, MCF-7 cells, breast cancer, reactive oxygen species, JNK activation, MAPK signaling, mitochondrial membrane permeabilization, mitochondrial membrane potential, Bcl-2 family proteins, apoptosis-inducing factor, cytochrome c release, caspase-independent apoptosis, p38 MAPK, ERK1/2, anticancer natural compounds, brown seaweed extract
- MeSH terms
- Enzyme Activation, Humans, Mitochondria, Polysaccharides, Signal Transduction, Apoptosis, Reactive Oxygen Species, Cell Line, Tumor, JNK Mitogen-Activated Protein Kinases
About these checks
Registry, retraction, Cites and statistics results are computed, not judged, with one exception: a printed reference that no index lists is read once by a model before it counts as a citation error. Claims are extracted by a model and kept only when their quote appears verbatim in the text; each cited source is then checked, with a model’s help, for whether it says what the claim relies on. Those verdicts can be wrong — read the claim’s quote and the cited source before relying on one.
Statistics and arithmetic are recomputed, not judged.
Confidence bands are shown only for fields calibrated on our annotated test set. None is calibrated yet, so no band is shown.
What counts as a claim ›How we measure confidence ›How we check this ›
Are you an author, or do you see a problem with this page? Request a review
