

The DOI matches its Crossref record; 67 of the 67 references it cites were found in a registry or an index.
Triggering of inflammasome by aggregated α-synuclein, an inflammatory response in synucleinopathies
Open accessAbstract
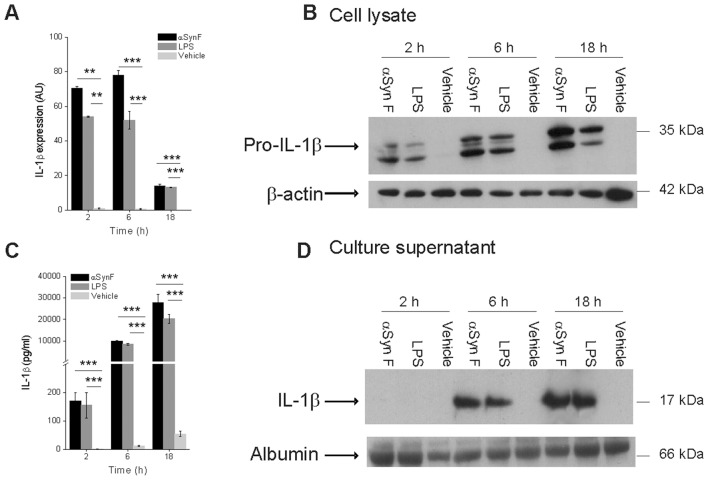
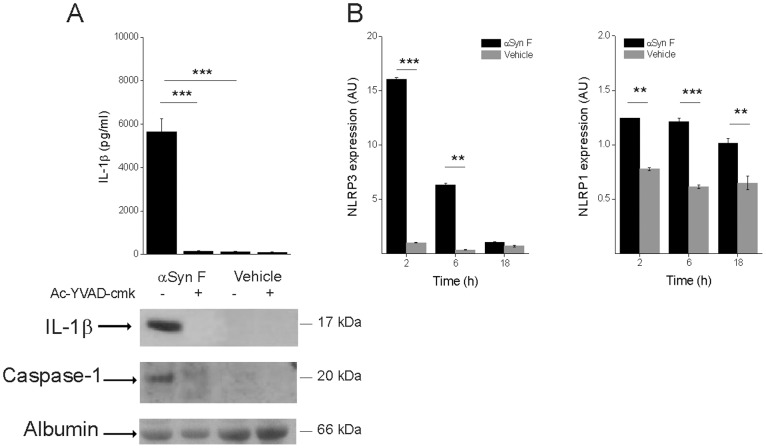
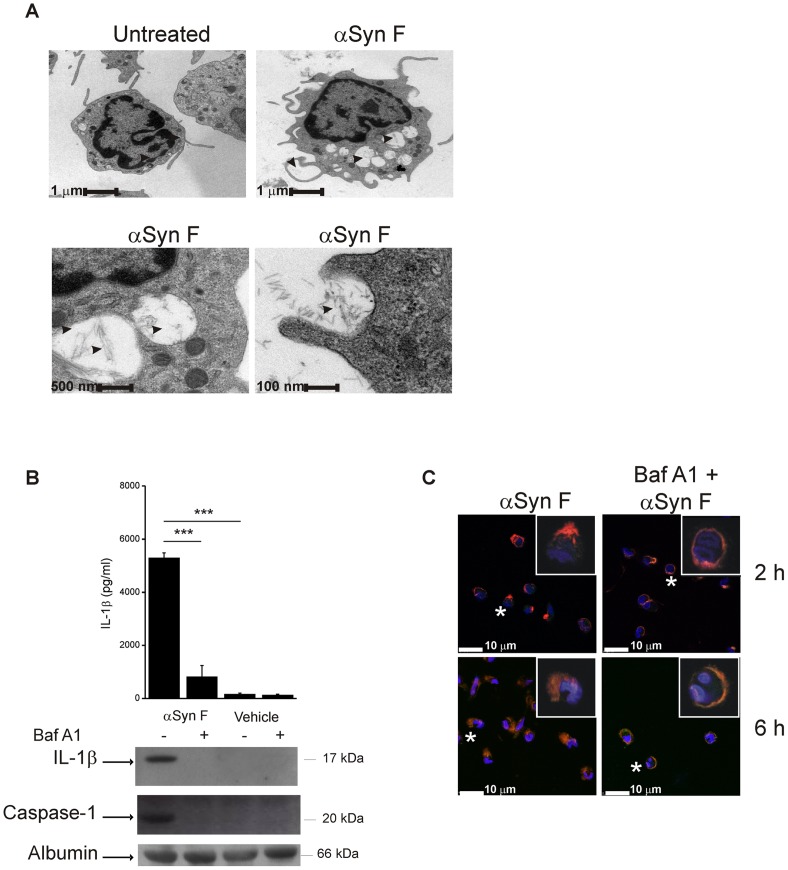
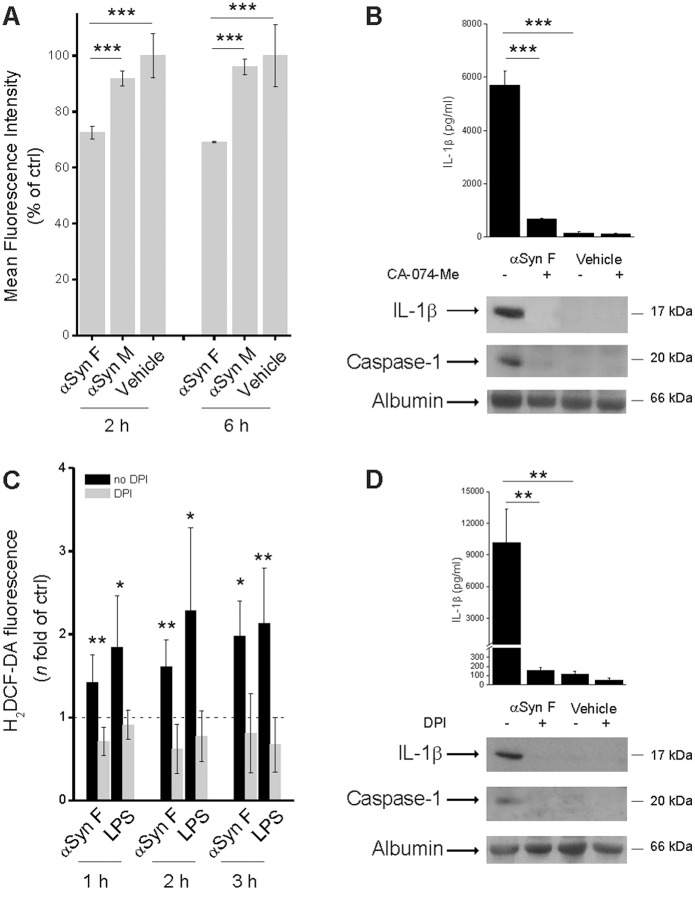
Parkinson's disease (PD) is one of the most common neurodegenerative diseases. It is characterized by the loss of dopaminergic neurons in the substantia nigra pars compacta of the brain. Another feature is represented by the formation in these cells of inclusions called Lewy bodies (LB), principally constituted by fibrillar α-synuclein (αSyn). This protein is considered a key element in the aetiology of a group of neurodegenerative disorders termed synucleinopathies, which include PD, but the cellular and molecular mechanisms involved are not completely clear. It is established that the inflammatory process plays a crucial role in the pathogenesis and/or progression of PD; moreover, it is known that aggregated αSyn, released by neurons, activates microglia cells to produce pro-inflammatory mediators, such as IL-1β. IL-1β is one of the strongest pro-inflammatory cytokines; it is produced as an inactive mediator, and its maturation and activation requires inflammasome activation. In particular, the NLRP3 inflammasome is activated by a wide variety of stimuli, among which are crystallized and particulate material. In this work, we investigated the possibility that IL-1β production, induced by fibrillar αSyn, is involved the inflammasome activation. We demonstrated the competence of monomeric and fibrillar αSyn to induce synthesis of IL-1β, through TLR2 interaction; we found that the secretion of the mature cytokine was a peculiarity of the fibrillated protein. Moreover, we observed that the secretion of IL-1β involves NLRP3 inflammasome activation. The latter relies on the phagocytosis of fibrillar αSyn, followed by increased ROS production and cathepsin B release into the cytosol. Taken together, our data support the notion that fibrillar αSyn, likely released by neuronal degeneration, acts as an endogenous trigger inducing a strong inflammatory response in PD.
Overview
The claims and statistics of this paper haven’t been checked yet.
Run the check — free, no account needed. It reads the open-access text and checks the sources it cites.
Integrity signals
Registry
Cites
Statistics
Figures
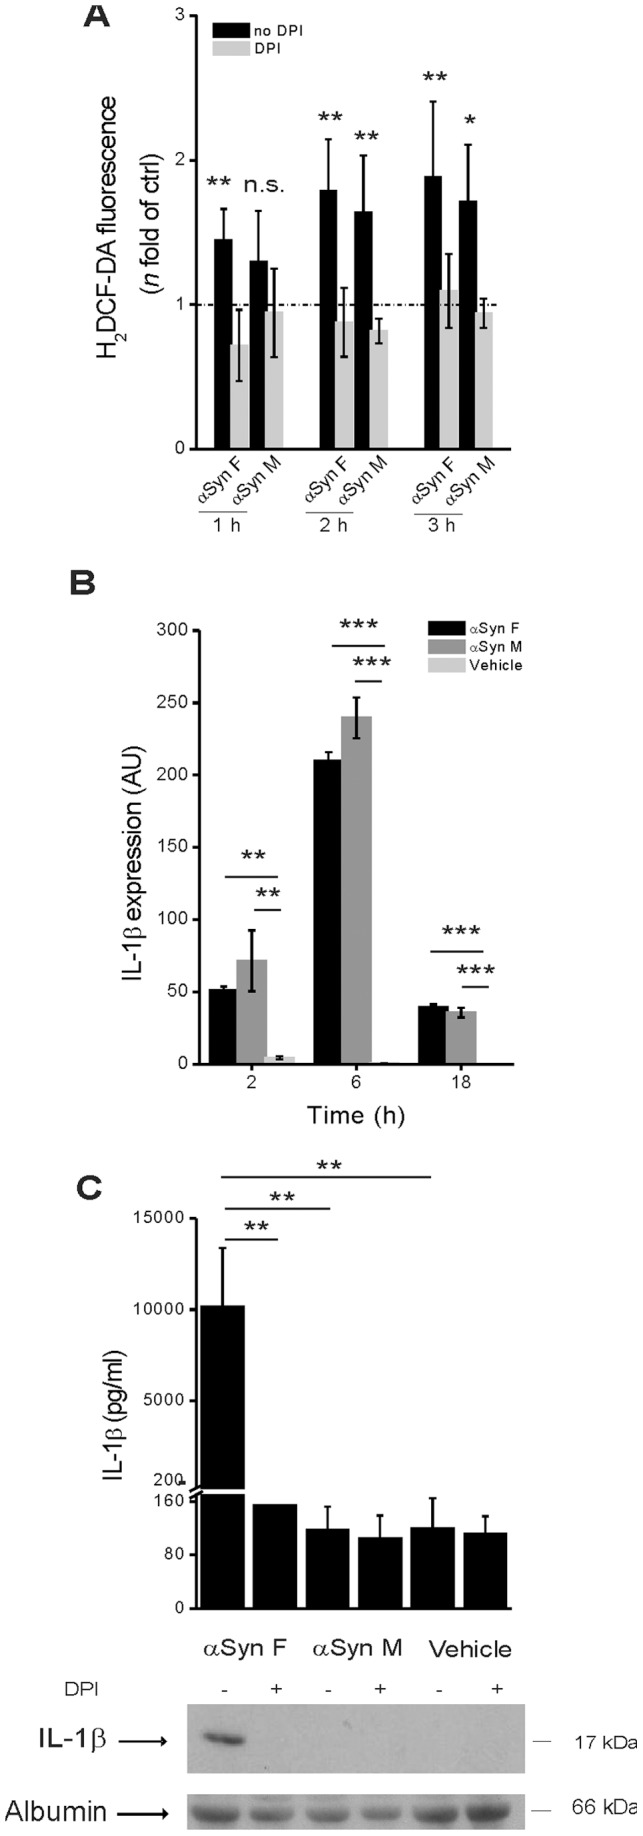
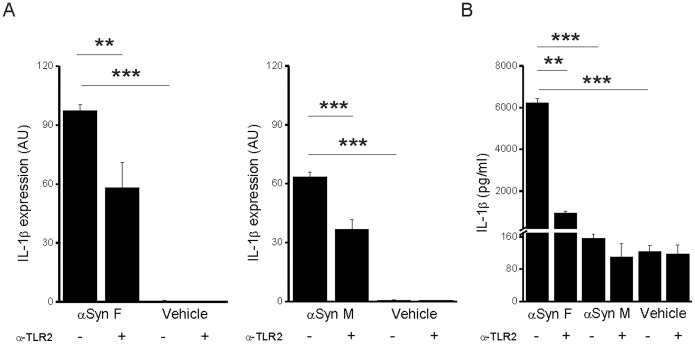
Verification
Claims the paper makes
The claims and statistics of this paper haven’t been checked yet.
Run the check — free, no account needed. It reads the open-access text and checks the sources it cites.
Claims other papers make about this one
Each is checked against this paper’s own text: does it say what the citing paper says it does?
The source backs part of the claim, not all of it — or backs it for a different population, condition or comparison.
In the citing paper
“In an in vitro experiment, both monomeric and fibrillary α-synuclein can stimulate TLR2 and induce the expression of pro-IL-1β, but only fibrillary α-synuclein can activate the NLRP3 inflammasome, resulting in the secretion of active IL-1β.358”
From Role of neuroinflammation in neurodegeneration development (2023) · cites this paper as [358]
Experimental — accuracy not yet measuredThe source backs part of the claim, not all of it — or backs it for a different population, condition or comparison.
In the citing paper
“Targeting caspase-1, a downstream molecule of NLRP3, is another promising method, which was found to decrease the secretion of IL-1β and attenuate the susceptibility of dopaminergic neurons.358”
From Role of neuroinflammation in neurodegeneration development (2023) · cites this paper as [358]
Experimental — accuracy not yet measuredIn the citing paper
“The fibrillar, but not monomeric, form of α-synuclein induced NLRP3- and caspase-1–mediated IL-1β secretion in human monocytes and BV2 microglial cell line (238), or via TLR-2 signaling pathway in rodents microglial cells (250).”
From The gut-brain axis: how microbiota and host inflammasome influence brain physiology and pathology (2020) · cites this paper as [238]
Self-check
Percentages, sums and reported differences re-computed from the paper’s own numbers.
The self-check needs the paper’s full text.
Citations
Cites
Analysis of Relative Gene Expression Data Using Real-Time Quantitative PCR and the 2−ΔΔCT Method
Livak, K. J., & Schmittgen, T. D. (2001) · Methods · doi:10.1006/meth.2001.1262 · Cited by 180,860
Staging of brain pathology related to sporadic Parkinson’s disease
Braak, H., Tredici, K. D., Rüb, U., de Vos, R. A. I., Jansen Steur, E. N. H., & Braak, E. (2003) · Neurobiology of Aging · doi:10.1016/s0197-4580(02)00065-9 · Cited by 10,777
Mutation in the α-Synuclein Gene Identified in Families with Parkinson's Disease
Polymeropoulos, M. H., Lavedan, C., Leroy, E., Ide, S. E., Dehejia, A., Dutra, A., Pike, B., Root, H., Rubenstein, J., Boyer, R., et al. (1997) · Science · doi:10.1126/science.276.5321.2045 · Cited by 8,240
Protein Misfolding, Functional Amyloid, and Human Disease
Chiti, F., & Dobson, C. M. (2006) · Annual Review of Biochemistry · doi:10.1146/annurev.biochem.75.101304.123901 · Cited by 6,497
Martinon, F., Burns, K., & Tschopp, J. (2002) · Molecular Cell · doi:10.1016/s1097-2765(02)00599-3 · Cited by 6,066
Schroder, K., & Tschopp, J. (2010) · Cell · doi:10.1016/j.cell.2010.01.040 · Cited by 5,475
Gout-associated uric acid crystals activate the NALP3 inflammasome
Martinon, F., Pétrilli, V., Mayor, A., Tardivel, A., & Tschopp, J. (2006) · Nature · doi:10.1038/nature04516 · Cited by 5,326
Microglia-mediated neurotoxicity: uncovering the molecular mechanisms
Block, M. L., Zecca, L., & Hong, J.-S. (2007) · Nature Reviews Neuroscience · doi:10.1038/nrn2038 · Cited by 4,110
AlaSOPro mutation in the gene encoding α-synuclein in Parkinson's disease
Krüger, R., Kuhn, W., Müller, T., Woitalla, D., Graeber, M., Kösel, S., Przuntek, H., Epplen, J. T., Schols, L., & Riess, O. (1998) · Nature Genetics · doi:10.1038/ng0298-106 · Cited by 3,836
Cryopyrin activates the inflammasome in response to toxins and ATP
Mariathasan, S., Weiss, D. S., Newton, K., McBride, J., O'Rourke, K., Roose-Girma, M., Lee, W. P., Weinrauch, Y., Monack, D. M., & Dixit, V. M. (2006) · Nature · doi:10.1038/nature04515 · Cited by 3,080
Hornung, V., Bauernfeind, F., Halle, A., Samstad, E. O., Kono, H., Rock, K. L., Fitzgerald, K. A., & Latz, E. (2008) · Nature Immunology · doi:10.1038/ni.1631 · Cited by 3,065
McGeer, P. L., Itagaki, S., Boyes, B. E., & McGeer, E. G. (1988) · Neurology · doi:10.1212/wnl.38.8.1285 · Cited by 2,990
Spillantini, M. G., Crowther, R. A., Jakes, R., Hasegawa, M., & Goedert, M. (1998) · Proceedings of the National Academy of Sciences · doi:10.1073/pnas.95.11.6469 · Cited by 2,868
The new mutation, E46K, of α‐synuclein causes parkinson and Lewy body dementia
Zarranz, J. J., Alegre, J., Gómez‐Esteban, J. C., Lezcano, E., Ros, R., Ampuero, I., Vidal, L., Hoenicka, J., Rodriguez, O., Atarés, B., et al. (2004) · Annals of Neurology · doi:10.1002/ana.10795 · Cited by 2,737
Thioredoxin-interacting protein links oxidative stress to inflammasome activation
Zhou, R., Tardivel, A., Thorens, B., Choi, I., & Tschopp, J. (2010) · Nature Immunology · doi:10.1038/ni.1831 · Cited by 2,708
Innate Immune Activation Through Nalp3 Inflammasome Sensing of Asbestos and Silica
Dostert, C., Pétrilli, V., Van Bruggen, R., Steele, C., Mossman, B. T., & Tschopp, J. (2008) · Science · doi:10.1126/science.1156995 · Cited by 2,658
The NALP3 inflammasome is involved in the innate immune response to amyloid-β
Halle, A., Hornung, V., Petzold, G. C., Stewart, C. R., Monks, B. G., Reinheckel, T., Fitzgerald, K. A., Latz, E., Moore, K. J., & Golenbock, D. T. (2008) · Nature Immunology · doi:10.1038/ni.1636 · Cited by 2,441
LeVine, H. (1993) · Protein Science · doi:10.1002/pro.5560020312 · Cited by 2,284
Inflammasomes in health and disease
Strowig, T., Henao-Mejia, J., Elinav, E., & Flavell, R. (2012) · Nature · doi:10.1038/nature10759 · Cited by 2,230
Li, J.-Y., Englund, E., Holton, J. L., Soulet, D., Hagell, P., Lees, A. J., Lashley, T., Quinn, N. P., Rehncrona, S., Björklund, A., et al. (2008) · Nature Medicine · doi:10.1038/nm1746 · Cited by 1,845
MyD88 is an adaptor protein in the hToll/IL-1 receptor family signaling pathways.
Medzhitov, R., Preston-Hurlburt, P., Kopp, E., Stadlen, A., Chen, C.-Q., Ghosh, S., & Janeway, C. (1998) · Molecules and Cells · doi:10.1016/s1097-2765(00)80136-7 · Cited by 1,783
Activation of the NALP3 inflammasome is triggered by low intracellular potassium concentration
Pétrilli, V, Papin, S., Dostert, C., Mayor, A., Martinon, F., & Tschopp, J. (2007) · Cell Death & Differentiation · doi:10.1038/sj.cdd.4402195 · Cited by 1,445
Masters, S. L., Dunne, A., Subramanian, S. L., Hull, R. L., Tannahill, G. M., Sharp, F. A., Becker, C., Franchi, L., Yoshihara, E., Chen, Z., et al. (2010) · Nature Immunology · doi:10.1038/ni.1935 · Cited by 1,330
Zhang, W., Wang, T., Pei, Z., Miller, D. S., Wu, X., Block, M. L., Wilson, B., Zhang, W., Zhou, Y., Hong, J.-S., et al. (2005) · The FASEB Journal · doi:10.1096/fj.04-2751com · Cited by 1,265
In vivo imaging of microglial activation with [11C](R)-PK11195 PET in idiopathic Parkinson's disease
Gerhard, A., Pavese, N., Hotton, G., Turkheimer, F., Es, M., Hammers, A., Eggert, K., Oertel, W., Banati, R. B., & Brooks, D. J. (2006) · Neurobiology of Disease · doi:10.1016/j.nbd.2005.08.002 · Cited by 1,200
Molecular Cloning of the Interleukin-1β Converting Enzyme
Cerretti, D. P., Kozlosky, C. J., Mosley, B., Nelson, N. C., Ness, K. V., Greenstreet, T. A., March, C. J., Kronheim, S. R., Druck, T., Cannizzaro, L. A., et al. (1992) · Science · doi:10.1126/science.1373520 · Cited by 1,147
Rajamäki, K., Lappalainen, J., Öörni, K., Välimäki, E., Matikainen, S., Kovanen, P. T., & Eklund, K. K. (2010) · PLoS ONE · doi:10.1371/journal.pone.0011765 · Cited by 1,039
Active Caspase-1 Is a Regulator of Unconventional Protein Secretion
Keller, M., Rüegg, A., Werner, S., & Beer, H. (2008) · Cell · doi:10.1016/j.cell.2007.12.040 · Cited by 851
El‐Agnaf, O. M. A., Salem, S. A., Paleologou, K. E., Curran, M. D., Gibson, M. J., Court, J. A., Schlossmacher, M. G., & Allsop, D. (2006) · The FASEB Journal · doi:10.1096/fj.03-1449com · Cited by 715
El-Agnaf, O. M. A., Salem, S. A., Paleologou, K. E., Cooper, L. J., Fullwood, N. J., Gibson, M. J., Curran, M. D., Court, J. A., Mann, D. M. A., Ikeda, S.-I., et al. (2003) · The FASEB Journal · doi:10.1096/fj.03-0098fje · Cited by 590
Endogenous ligands of TLR2 and TLR4: agonists or assistants?
Erridge, C. (2010) · Journal of Leukocyte Biology · doi:10.1189/jlb.1209775 · Cited by 532
de Rijk, M. C., Launer, L. J., Berger, K., Breteler, M. M. B., Dartigues, J. F., Baldereschi, M., Fratiglioni, L., Lobo, A., Martinez-Lage, J., Trenkwalder, C., et al. (2000) · PubMed · Cited by 528
Molecular Mechanism of NLRP3 Inflammasome Activation
Jin, C., & Flavell, R. A. (2010) · Journal of Clinical Immunology · doi:10.1007/s10875-010-9440-3 · Cited by 440
Tokuda, T., Salem, S. A., Allsop, D., Mizuno, T., Nakagawa, M., Qureshi, M. M., Locascio, J. J., Schlossmacher, M. G., & El-Agnaf, O. M. A. (2006) · Biochemical and Biophysical Research Communications · doi:10.1016/j.bbrc.2006.08.024 · Cited by 425
Croisier, E., Moran, L. B., Dexter, D. T., Pearce, R. K., & Graeber, M. B. (2005) · Journal of Neuroinflammation · doi:10.1186/1742-2094-2-14 · Cited by 414
Theodore, S., Cao, S., McLean, P. J., & Standaert, D. G. (2008) · Journal of Neuropathology & Experimental Neurology · doi:10.1097/nen.0b013e31818e5e99 · Cited by 392
Borghi, R., Marchese, R., Negro, A., Marinelli, L., Forloni, G., Zaccheo, D., Abbruzzese, G., & Tabaton, M. (2000) · Neuroscience Letters · doi:10.1016/s0304-3940(00)01153-8 · Cited by 363
Getts, D. R., Terry, R. L., Getts, M. T., Müller, M., Rana, S., Shrestha, B., Radford, J., Van Rooijen, N., Campbell, I. L., & King, N. J. C. (2008) · The Journal of Experimental Medicine · doi:10.1084/jem.20080421 · Cited by 360
Kinetic and Structural Analysis of the Early Oxidation Products of Dopamine
Bisaglia, M., Mammi, S., & Bubacco, L. (2007) · Journal of Biological Chemistry · doi:10.1074/jbc.m610893200 · Cited by 303
Self-citationIL‐1: Discoveries, controversies and future directions
Dinarello, C. A. (2010) · European Journal of Immunology · doi:10.1002/eji.201040319 · Cited by 275
Lee, E.-J., Woo, M.-S., Moon, P., Baek, M., Choi, I.-Y., Kim, W.-K., Junn, E., & Kim, H.-S. (2010) · The Journal of Immunology · doi:10.4049/jimmunol.0903480 · Cited by 267
The plasma alpha-synuclein levels in patients with Parkinson’s disease and multiple system atrophy
Lee, P. H., Lee, G., Park, H. J., Bang, O. Y., Joo, I. S., & Huh, K. (2006) · Journal of Neural Transmission · doi:10.1007/s00702-005-0427-9 · Cited by 242
Ferrari, C. C., Pott Godoy, M. C., Tarelli, R., Chertoff, M., Depino, A. M., & Pitossi, F. J. (2006) · Neurobiology of Disease · doi:10.1016/j.nbd.2006.06.013 · Cited by 235
(2000) · Neurology · doi:10.1212/wnl.54.5.21a · Cited by 209
α-Synuclein Alters Toll-Like Receptor Expression
Béraud, D., Twomey, M. A., Bloom, B., Mittereder, A., Ton, V., Neitzke, K., Chasovskikh, S., Mhyre, T. R., & Maguire‐Zeiss, K. A. (2011) · Frontiers in Neuroscience · doi:10.3389/fnins.2011.00080 · Cited by 203
Alpha-synuclein release by neurons activates the inflammatory response in a microglial cell line
Alvarez‐Erviti, L., Couch, Y., Richardson, J. C., Cooper, J. A. D., & Wood, M. J. A. (2011) · Neuroscience Research · doi:10.1016/j.neures.2010.12.020 · Cited by 199
Djukic, M. (2006) · Brain · doi:10.1093/brain/awl206 · Cited by 195
Genetics of Parkinsonʼs disease
Gasser, T. (2005) · Current Opinion in Neurology · doi:10.1097/01.wco.0000170951.08924.3d · Cited by 192
A new method for purification of recombinant human α-synuclein in Escherichia coli
Huang, C., Ren, G., Zhou, H., & Wang, C.-C. (2005) · Protein Expression and Purification · doi:10.1016/j.pep.2005.02.014 · Cited by 184
Béraud, D., Hathaway, H. A., Trecki, J., Chasovskikh, S., Johnson, D. A., Johnson, J. A., Federoff, H. J., Shimoji, M., Mhyre, T. R., & Maguire‐Zeiss, K. A. (2012) · Journal of Neuroimmune Pharmacology · doi:10.1007/s11481-012-9401-0 · Cited by 179
Origins and Effects of Extracellular α-synuclein: Implications in Parkinson’s Disease
Lee, S. (2007) · Journal of Molecular Neuroscience · doi:10.1007/s12031-007-0012-9 · Cited by 160
Structured Regions of α-Synuclein Fibrils Include the Early-Onset Parkinson's Disease Mutation Sites
Comellas, G., Lemkau, L., Nieuwkoop, A. J., Kloepper, K. D., Ladror, D. T., Ebisu, R., Woods, W. S., Lipton, A. S., George, J. M., & Rienstra, C. M. (2011) · Journal of Molecular Biology · doi:10.1016/j.jmb.2011.06.026 · Cited by 149
Mutant α-Synuclein Overexpression Mediates Early Proinflammatory Activity
Su, X., Federoff, H. J., & Maguire-Zeiss, K. A. (2009) · Neurotoxicity Research · doi:10.1007/s12640-009-9053-x · Cited by 145
Tassi, S., Carta, S., Delfino, L., Caorsi, R., Martini, A., Gattorno, M., & Rubartelli, A. (2010) · Proceedings of the National Academy of Sciences · doi:10.1073/pnas.1000779107 · Cited by 141
Misfolded α-synuclein and toll-like receptors: therapeutic targets for Parkinson's disease
Béraud, D., & Maguire‐Zeiss, K. A. (2011) · Parkinsonism & Related Disorders · doi:10.1016/s1353-8020(11)70008-6 · Cited by 135
Nitrated Alpha-Synuclein and Microglial Neuroregulatory Activities
Reynolds, A. D., Kadiu, I., Garg, S. K., Glanzer, J. G., Nordgren, T. M., Ciborowski, P. S., Banerjee, R. V., & Gendelman, H. E. (2008) · Journal of Neuroimmune Pharmacology · doi:10.1007/s11481-008-9100-z · Cited by 129
Inflammatory Mechanisms of Neurodegeneration in Toxin-Based Models of Parkinson's Disease
Litteljohn, D., Mangano, E. N., Clarke, M., Bobyn, J., Moloney, K., & Hayley, S. P. (2010) · Parkinson s Disease · doi:10.4061/2011/713517 · Cited by 98
Immunological features of α‐synuclein in Parkinson's disease
Roodveldt, C., Christodoulou, J., & Dobson, C. M. (2008) · Journal of Cellular and Molecular Medicine · doi:10.1111/j.1582-4934.2008.00450.x · Cited by 97
Hafner‐Bratkovič, I., Benčina, M., Fitzgerald, K. A., Golenbock, D. T., & Jerala, R. (2012) · Cellular and Molecular Life Sciences · doi:10.1007/s00018-012-1140-0 · Cited by 92
Palokangas, H., Metsikkö, K., & Väänänen, K. (1994) · Journal of Biological Chemistry · doi:10.1016/s0021-9258(17)32480-8 · Cited by 77
van Raaij, M. E., van Gestel, J., Segers‐Nolten, I. M. J., de Leeuw, S. W., & Subramaniam, V. (2008) · Biophysical Journal · doi:10.1529/biophysj.107.127464 · Cited by 68
Mankan, A. K., Kubarenko, A. V., & Hornung, V. (2011) · Clinical & Experimental Immunology · doi:10.1111/j.1365-2249.2011.04534.x · Cited by 58
Su, E. R., Bell, M. J., Wisniewski, S. R., Adelson, P. D., Janesko‐Feldman, K. L., Salonia, R., Clark, R. S. B., Kochanek, P. M., Kagan, V. E., & Bayır, H. (2010) · Developmental Neuroscience · doi:10.1159/000321342 · Cited by 55
Future directions for immune modulation in neurodegenerative disorders: focus on Parkinson’s disease
Maguire‐Zeiss, K. A., & Federoff, H. J. (2010) · Journal of Neural Transmission · doi:10.1007/s00702-010-0431-6 · Cited by 46
Cognet, I., de Coignac, A. B., Magistrelli, G., Jeannin, P., Aubry, J., Maisnier-Patin, K., Caron, G., Chevalier, S., Humbert, F., Nguyen, T. N., et al. (2003) · Journal of Immunological Methods · doi:10.1016/s0022-1759(02)00506-9 · Cited by 43
A Statistical-Mechanical Theory of Fibril Formation in Dilute Protein Solutions
van Gestel, J., & de Leeuw, S. W. (2006) · Biophysical Journal · doi:10.1529/biophysj.105.076000 · Cited by 28
Translocation of α-Synuclein Expressed in Escherichia coli
Ren, G., Wang, X., Hao, S., Hu, H., & Wang, C.-C. (2007) · Journal of Bacteriology · doi:10.1128/jb.01406-06 · Cited by 22
Cited by
Sorted by citations
The NLRP3 Inflammasome: an overview of mechanisms of activation and regulation
Kelley, N., Jeltema, D., Duan, Y., & He, Y. (2019) · International Journal of Molecular Sciences · doi:10.3390/ijms20133328 · Cited by 3,539
Inflammasomes: mechanism of action, role in disease, and therapeutics
Guo, H., Callaway, J. B., & Ting, J. P.-Y. (2015) · Nature Medicine · doi:10.1038/nm.3893 · Cited by 3,340
Ageing as a risk factor for neurodegenerative disease
Hou, Y., Dan, X., Babbar, M., Wei, Y., Hasselbalch, S. G., Croteau, D. L., & Bohr, V. A. (2019) · Nature Reviews Neurology · doi:10.1038/s41582-019-0244-7 · Cited by 3,310
Role of neuroinflammation in neurodegeneration development
Zhang, W., Xiao, D., Mao, Q., & Xia, H. (2023) · Signal Transduction and Targeted Therapy · doi:10.1038/s41392-023-01486-5 · Cited by 1,668
Microglia in physiology and disease
Wolf, S. A., Boddeke, H. W. G. M., & Kettenmann, H. (2017) · Annual Review of Physiology · doi:10.1146/annurev-physiol-022516-034406 · Cited by 1,426
Metadata
- Authors
- Codolo, G., Plotegher, N., Pozzobon, T., Brucale, M., Tessari, I., Bubacco, L., & de Bernard, M.
- Affiliations
- University of Padua (IT)
- Veneto Institute of Molecular Medicine (IT)
- Institute of Nanostructured Materials (IT)
- Corresponding author
- Bubacco, Luigi
- Venue
- PLoS ONE
- Publisher
- Public Library of Science (PLoS)
- Published
- 2013-01-31
- Volume
- 8
- Issue
- 1
- Pages
- e55375
- ISSN
- 1932-6203 (ISSN-L)
- PMC
- PMC3561263
- OpenAlex
- W2015283405
- Cited by
- 585
- References
- 67
- Citations by year
- 2026: 23 · 2025: 38 · 2024: 56 · 2023: 59 · 2022: 68 · 2021: 65 · 2020: 58 · 2019: 53 · 2018: 48 · 2017: 31 · 2016: 27 · 2015: 30 · 2014: 23 · 2013: 5
- FWCI
- 12.83
- Type
- journal article
- Language
- en
- Open access
- gold
- doi.org
- Locations
- PLoS ONE (publishedVersion, cc-by)
- Europe PMC (PubMed Central) (publishedVersion, other-oa)
- PubMed Central (publishedVersion, cc-by)
- PubMed (publishedVersion)
- Padua Research Archive (University of Padova) (submittedVersion, cc-by)
- DOAJ (DOAJ: Directory of Open Access Journals) (submittedVersion, cc-by-sa)
- Figshare (submittedVersion, cc-by)
- Funders
- Fondazione Cariplo (2011-0485)
- Università degli Studi di Padova
- Topics
- Life Sciences › Biochemistry, Genetics and Molecular Biology › Molecular Biology › Inflammasome and immune disorders
- Health Sciences › Medicine › Clinical Neurology › Parkinson's Disease Mechanisms and Treatments
- Life Sciences › Neuroscience › Neurology › Neuroinflammation and Neurodegeneration Mechanisms
- Keywords
- alpha-synuclein aggregation, NLRP3 inflammasome, IL-1β, Parkinson's disease, synucleinopathies, TLR2, microglial activation, phagocytosis, reactive oxygen species, cathepsin B, Lewy bodies, neuroinflammation, neurodegeneration
- MeSH terms
- NLR Family, Pyrin Domain-Containing 3 Protein, Analysis of Variance, Carrier Proteins, Humans, Inflammation, Neurons, Parkinson Disease, Phagocytosis, Spectrometry, Fluorescence, Spectrophotometry, Ultraviolet, Thiazoles, Blotting, Western, Lewy Bodies, DNA Primers, Microscopy, Confocal, Microscopy, Atomic Force, Microscopy, Electron, Transmission, Toll-Like Receptor 2, alpha-Synuclein, Benzothiazoles, Interleukin-1beta, Chromatography, Reverse-Phase, Inflammasomes, Real-Time Polymerase Chain Reaction
About these checks
Registry, retraction, Cites and statistics results are computed, not judged, with one exception: a printed reference that no index lists is read once by a model before it counts as a citation error. Claims are extracted by a model and kept only when their quote appears verbatim in the text; each cited source is then checked, with a model’s help, for whether it says what the claim relies on. Those verdicts can be wrong — read the claim’s quote and the cited source before relying on one.
Statistics and arithmetic are recomputed, not judged.
Confidence bands are shown only for fields calibrated on our annotated test set. None is calibrated yet, so no band is shown.
What counts as a claim ›How we measure confidence ›How we check this ›
Are you an author, or do you see a problem with this page? Request a review
