

The DOI matches its Crossref record; 19 of the 19 references it cites were found in a registry or an index.
Single-Subject Grey Matter Graphs in Alzheimer's Disease
Open accessAbstract
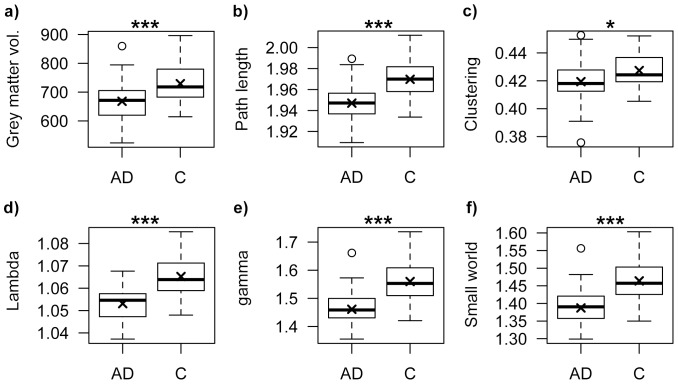
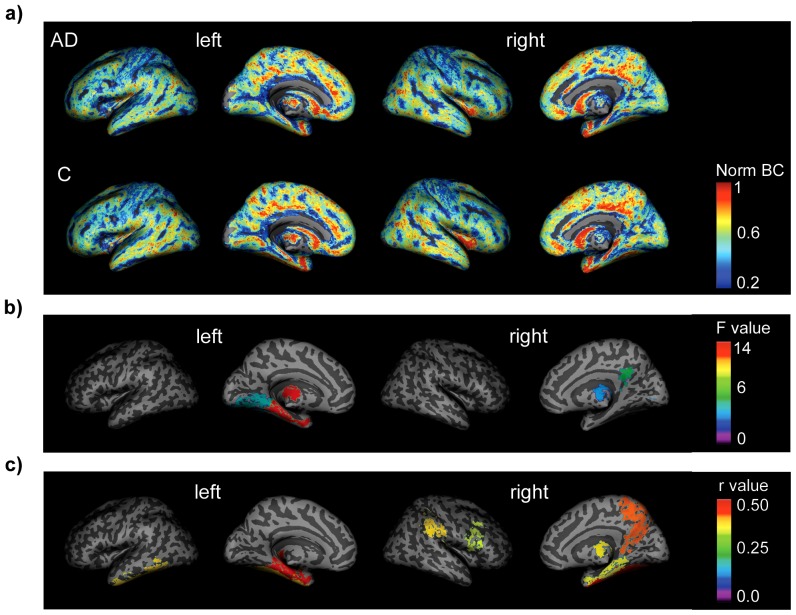
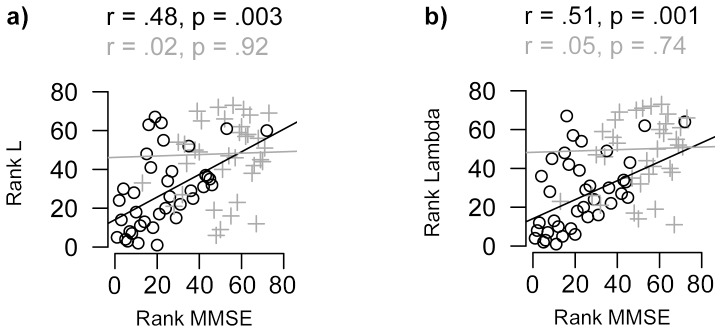
Coordinated patterns of cortical morphology have been described as structural graphs and previous research has demonstrated that properties of such graphs are altered in Alzheimer's disease (AD). However, it remains unknown how these alterations are related to cognitive deficits in individuals, as such graphs are restricted to group-level analysis. In the present study we investigated this question in single-subject grey matter networks. This new method extracts large-scale structural graphs where nodes represent small cortical regions that are connected by edges when they show statistical similarity. Using this method, unweighted and undirected networks were extracted from T1 weighted structural magnetic resonance imaging scans of 38 AD patients (19 female, average age 72±4 years) and 38 controls (19 females, average age 72±4 years). Group comparisons of standard graph properties were performed after correcting for grey matter volumetric measurements and were correlated to scores of general cognitive functioning. AD networks were characterised by a more random topology as indicated by a decreased small world coefficient (p = 3.53×10(-5)), decreased normalized clustering coefficient (p = 7.25×10(-6)) and decreased normalized path length (p = 1.91×10(-7)). Reduced normalized path length explained significantly (p = 0.004) more variance in measurements of general cognitive decline (32%) in comparison to volumetric measurements (9%). Altered path length of the parahippocampal gyrus, hippocampus, fusiform gyrus and precuneus showed the strongest relationship with cognitive decline. The present results suggest that single-subject grey matter graphs provide a concise quantification of cortical structure that has clinical value, which might be of particular importance for disease prognosis. These findings contribute to a better understanding of structural alterations and cognitive dysfunction in AD.
Overview
The claims and statistics of this paper haven’t been checked yet.
Run the check — free, no account needed. It reads the open-access text and checks the sources it cites.
Integrity signals
Registry
Cites
Statistics
Figures
Verification
Claims the paper makes
The claims and statistics of this paper haven’t been checked yet.
Run the check — free, no account needed. It reads the open-access text and checks the sources it cites.
Claims other papers make about this one
Each is checked against this paper’s own text: does it say what the citing paper says it does?
The cited source says what the claim attributes to it.
In the citing paper
“However, some studies have observed conflicting results, including lower characteristic path length in DTI (Daianu et al., 2013), gray matter (Tijms, Moller et al., 2013), fMRI (Sanz-Arigita et al., 2010), EEG (de Haan et al., 2009), and magneto-encephalogram (MEG; Stam et al., 2009) connectomes in patients with AD.”
From Functional and structural connectome properties in the 5XFAD transgenic mouse model of Alzheimer’s disease (2018) · cites this paper as Tijms, Moller et al., 2013
Self-check
Percentages, sums and reported differences re-computed from the paper’s own numbers.
The self-check needs the paper’s full text.
Citations
Cites
Kok, J. S., Berg, I. J., & Scherder, E. J. A. (2013) · Dementia and Geriatric Cognitive Disorders Extra · doi:10.1159/000353441 · Cited by 20,589
Neuropathological stageing of Alzheimer-related changes.
Braak, H., & Braak, E. (1991) · Acta Neuropathologica · doi:10.1007/bf00308809 · Cited by 16,123
Mapping the structural core of human cerebral cortex
Hagmann, P., Cammoun, L., Gigandet, X., Meuli, R., Honey, C. J., Wedeen, V. J., & Sporns, O. (2008) · PLoS Biology · doi:10.1371/journal.pbio.0060159 · Cited by 4,173
A PROPOSED MECHANISM OF EMOTION
PAPEZ, J. W. (1937) · Archives of Neurology And Psychiatry · doi:10.1001/archneurpsyc.1937.02260220069003 · Cited by 3,563
The economy of brain network organization
Bullmore, E., & Sporns, O. (2012) · Nature Reviews Neuroscience · doi:10.1038/nrn3214 · Cited by 3,284
The Human Connectome: A Structural Description of the Human Brain
Sporns, O., Tononi, G., & Kötter, R. (2005) · PLoS Computational Biology · doi:10.1371/journal.pcbi.0010042 · Cited by 3,260
Buckner, R. L., Sepulcre, J., Talukdar, T., Krienen, F. M., Liu, H., Hedden, T., Andrews-Hanna, J. R., Sperling, R. A., & Johnson, K. A. (2009) · The Journal of Neuroscience · doi:10.1523/jneurosci.5062-08.2009 · Cited by 2,862
Changes in grey matter induced by training
Draganski, B., Gaser, C., Busch, V., Schuierer, G., Bogdahn, U., & May, A. (2004) · Nature · doi:10.1038/427311a · Cited by 2,373
Buckner, R. L., Snyder, A. Z., Shannon, B. J., LaRossa, G., Sachs, R., Fotenos, A. F., Sheline, Y. I., Klunk, W. E., Mathis, C. A., Morris, J. C., et al. (2005) · The Journal of Neuroscience · doi:10.1523/jneurosci.2177-05.2005 · Cited by 2,140
Jack, C. R., Albert, M. S., Knopman, D. S., McKhann, G. M., Sperling, R. A., Carrillo, M. C., Thies, B., & Phelps, C. H. (2011) · Alzheimer's & Dementia · doi:10.1016/j.jalz.2011.03.004 · Cited by 2,042
Research works printed but not linked: 76
- JA Hardy, 1992, Alzheimer's disease: the amyloid cascade hypothesis, Science, 256, 184, 10.1126/science.1566067 · DOI · Paper page
- MC De Lacoste, 1993, The role of cortical connectivity in Alzheimer's disease pathogenesis: a review and model system, Neurobiol Aging, 14, 1, 10.1016/0197-4580(93)90015-4 · DOI
- X Delbeuck, 2003, Alzheimer's disease as a disconnection syndrome?, Neuropsychol Rev, 13, 79, 10.1023/A:1023832305702 · DOI
- RA Sperling, 2009, Amyloid deposition is associated with impaired default network function in older persons without dementia, Neuron, 63, 178, 10.1016/j.neuron.2009.07.003 · DOI · Paper page
- A Takashima, 2009, Amyloid-β, tau, and dementia, J Alzheimers Dis, 17, 729, 10.3233/JAD-2009-1090 · DOI
- GB Frisoni, 2002, Detection of grey matter loss in mild Alzheimer's disease with voxel based morphometry, J Neurol Neurosurg Psychiatry, 73, 657, 10.1136/jnnp.73.6.657 · DOI
- G Karas, 2004, Global and local gray matter loss in mild cognitive impairment and Alzheimer's disease, Neuroimage, 23, 708, 10.1016/j.neuroimage.2004.07.006 · DOI · Paper page
- MH Rosenbloom, 2011, Distinct clinical and metabolic deficits in PCA and AD are not related to amyloid distribution, Neurology, 76, 1789, 10.1212/WNL.0b013e31821cccad · DOI
- A Shiino, 2006, Four subgroups of Alzheimer's disease based on patterns of atrophy using VBM and a unique pattern for early onset disease, Neuroimage, 33, 17, 10.1016/j.neuroimage.2006.06.010 · DOI
- GR Ridgway, 2012, Early-onset Alzheimer disease clinical variants: Multivariate analyses of cortical thickness, Neurology, 79, 80, 10.1212/WNL.0b013e31825dce28 · DOI
- C Gratton, 2012, Focal brain lesions to critical locations cause widespread disruption of the modular organization of the brain, J Cogn Neurosci, 24, 1275, 10.1162/jocn_a_00222 · DOI
- O Sporns, 2004, Organization, development and function of complex brain networks, Trends Cogn Sci, 8, 418, 10.1016/j.tics.2004.07.008 · DOI · Paper page
- CJ Stam, 2012, The organization of physiological brain networks, Clin Neurophysiol, 123, 1067, 10.1016/j.clinph.2012.01.011 · DOI
- Y He, 2007, Small-world anatomical networks in the human brain revealed by cortical thickness from MRI, Cereb Cortex, 17, 2407, 10.1093/cercor/bhl149 · DOI
- D Bassett, 2008, Hierarchical organization of human cortical networks in health and schizophrenia, J Neurosci, 28, 9239, 10.1523/JNEUROSCI.1929-08.2008 · DOI
- ZJ Chen, 2008, Revealing modular architecture of human brain structural networks by using cortical thickness from MRI, Cereb Cortex, 18, 2374, 10.1093/cercor/bhn003 · DOI · Paper page
- G Sanabria-Diaz, 2010, Surface area and cortical thickness descriptors reveal different attributes of the structural human brain networks, Neuroimage, 50, 1497, 10.1016/j.neuroimage.2010.01.028 · DOI
- BM Tijms, 2012, Similarity-based extraction of individual networks from gray matter MRI scans, Cereb Cortex, 22, 1530, 10.1093/cercor/bhr221 · DOI
- A Mechelli, 2005, Structural covariance in the human cortex, J Neurosci, 25, 8303, 10.1523/JNEUROSCI.0357-05.2005 · DOI · Paper page
- J Lerch, 2006, Mapping anatomical correlations across cerebral cortex (MACACC) using cortical thickness from MRI, Neuroimage, 31, 993, 10.1016/j.neuroimage.2006.01.042 · DOI
- Y He, 2008, Structural insights into aberrant topological patterns of large-scale cortical networks in Alzheimer's disease, J Neurosci, 28, 4756, 10.1523/JNEUROSCI.0141-08.2008 · DOI · Paper page
- Y Li, 2012, Discriminant analysis of longitudinal cortical thickness changes in Alzheimer's disease using dynamic and network features, Neurobiol Aging 33, 427
- Z Yao, 2010, Abnormal cortical networks in mild cognitive impairment and Alzheimer's disease, PLoS Comp Biol, 6, e1001006, 10.1371/journal.pcbi.1001006 · DOI
- C Stam, 2009, Graph theoretical analysis of magnetoencephalographic functional connectivity in Alzheimer's disease, Brain, 132, 213, 10.1093/brain/awn262 · DOI
- W de Haan, 2009, Functional neural network analysis in frontotemporal dementia and Alzheimer's disease using EEG and graph theory, BMC Neurosci, 10, 101, 10.1186/1471-2202-10-101 · DOI
- EC Mormino, 2011, Relationships between beta-amyloid and functional connectivity in different components of the default mode network in aging, Cereb Cortex, 21, 2399, 10.1093/cercor/bhr025 · DOI
- W de Haan, 2012, Activity dependent degeneration explains hub vulnerability in Alzheimer's disease, PLoS Comp Biol, 8, e1002582, 10.1371/journal.pcbi.1002582 · DOI
- GM Mckhann, 2011, The diagnosis of dementia due to Alzheimer's disease: Recommendations from the National Institute on Aging-Alzheimer’s Association workgroups on diagnostic guidelines for Alzheimer's disease, Alzheimers Dement, 7, 263, 10.1016/j.jalz.2011.03.005 · DOI · Paper page
- MF Folstein, 1975, “Mini-mental state.” A practical method for grading the cognitive state of patients for the clinician, J Psychiatr Res, 12, 189
- M Jenkinson, 2001, A global optimisation method for robust affine registration of brain images, Med Image Anal, 5, 143, 10.1016/S1361-8415(01)00036-6 · DOI
- C Nikou, 1999, Robust voxel similarity metrics for the registration of dissimilar single and multimodal images, Pattern Recognition, 32, 1351, 10.1016/S0031-3203(98)00167-8 · DOI
- J Weese, 1999, Gray-value based registration of CT and MR images by maximization of local correlation, Medical Image Computing and Computer-Assisted Intervention–MICCAI', 99, 656, 10.1007/10704282_71 · DOI
- T VanCourt, 2005, Three-dimensional template correlation: object recognition in 3D voxel data, Computer Architecture for Machine Perception, 2005 CAMP 2005 Proceedings Seventh International Workshop on, 153, 10.1109/CAMP.2005.52 · DOI
- G Penney, 1998, A comparison of similarity measures for use in 2D-3D medical image registration, Lect Notes Comput Sc, 1496, 1153, 10.1007/BFb0056305 · DOI
- A Barrat, 2004, The architecture of complex weighted networks, Proc Natl Acad Sci U S A, 101, 3747, 10.1073/pnas.0400087101 · DOI
- M Rubinov, 2010, Complex network measures of brain connectivity: uses and interpretations, Neuroimage, 52, 1059, 10.1016/j.neuroimage.2009.10.003 · DOI · Paper page
- D Watts, 1998, Collective dynamics of “small-world” networks, Nature, 393, 440, 10.1038/30918 · DOI · Paper page
- L Freeman, 1977, A set of measures of centrality based on betweenness, Sociometry, 40, 35, 10.2307/3033543 · DOI
- MD Humphries, 2008, Network “Small-World-Ness”: A quantitative method for determining canonical network equivalence, PLoS ONE, 3, e0002051, 10.1371/journal.pone.0002051 · DOI · Paper page
- S Maslov, 2002, Specificity and stability in topology of protein networks, Science, 296, 910, 10.1126/science.1065103 · DOI · Paper page
- AL Barabasi, 1999, Emergence of scaling in random networks, Science, 286, 509, 10.1126/science.286.5439.509 · DOI · Paper page
- D Bassett, 2006, Small-world brain networks, Neuroscientist, 12, 512, 10.1177/1073858406293182 · DOI · Paper page
- M Kaiser, 2011, A tutorial in connectome analysis: topological and spatial features of brain networks, Neuroimage, 57, 892, 10.1016/j.neuroimage.2011.05.025 · DOI · Paper page
- QK Telesford, 2011, The brain as a complex system: using network science as a tool for understanding the brain, Brain Connect, 1, 295, 10.1089/brain.2011.0055 · DOI
- Conover W, Iman RL (1981) Rank transformations as a bridge between parametric and nonparametric statistics. American Statistician: 124–129. · DOI · Paper page
- WJ Conover, 1982, Analysis of covariance using the rank transformation, Biometrics, 38, 715, 10.2307/2530051 · DOI
- A Zalesky, 2010, Whole-brain anatomical networks: does the choice of nodes matter?, Neuroimage, 50, 970, 10.1016/j.neuroimage.2009.12.027 · DOI · Paper page
- N Tzourio-Mazoyer, 2002, Automated anatomical labeling of activations in SPM using a macroscopic anatomical parcellation of the MNI MRI single-subject brain, Neuroimage, 15, 273, 10.1006/nimg.2001.0978 · DOI · Paper page
- Y Benjamini, 1995, Controlling the false discovery rate: a practical and powerful approach to multiple testing, Journal of the Royal Statistical Society Series B (Methodological), 57, 289, 10.1111/j.2517-6161.1995.tb02031.x · DOI · Paper page
- Y Benjamini, 2001, The control of the false discovery rate in multiple testing under dependency, The Annals of Statistics, 29, 1165, 10.1214/aos/1013699998 · DOI · Paper page
- T Andrews, 1997, Correlated size variations in human visual cortex, lateral geniculate nucleus, and optic tract, J Neurosci, 17, 2859, 10.1523/JNEUROSCI.17-08-02859.1997 · DOI
- M Raichle, 2001, A default mode of brain function, Proc Natl Acad Sci U S A, 98, 676, 10.1073/pnas.98.2.676 · DOI · Paper page
- MD Greicius, 2004, Default-mode network activity distinguishes Alzheimer's disease from healthy aging: evidence from functional MRI, Proc Natl Acad Sci U S A, 101, 4637, 10.1073/pnas.0308627101 · DOI · Paper page
- SARB Rombouts, 2005, Altered resting state networks in mild cognitive impairment and mild Alzheimer's disease: An fMRI study, Hum Brain Mapp, 26, 231, 10.1002/hbm.20160 · DOI · Paper page
- A Burggren, 2002, Specificity of brain activation patterns in people at genetic risk for Alzheimer disease, American Journal of Geriatric Psych, 10, 44, 10.1097/00019442-200201000-00006 · DOI
- E Reiman, 2004, Functional brain abnormalities in young adults at genetic risk for late-onset Alzheimer's dementia, Proc Natl Acad Sci U S A, 101, 284, 10.1073/pnas.2635903100 · DOI · Paper page
- DC Van Essen, 1997, A tension-based theory of morphogenesis and compact wiring in the central nervous system, Nature, 385, 313, 10.1038/385313a0 · DOI
- C Hilgetag, 2004, Clustered organization of cortical connectivity, Neuroinformatics, 2, 353, 10.1385/NI:2:3:353 · DOI
- G Gong, 2012, Convergence and divergence of thickness correlations with diffusion connections across the human cerebral cortex, Neuroimage, 59, 1239, 10.1016/j.neuroimage.2011.08.017 · DOI
- I Ferrer, 1995, Transforming growth factor alpha immunoreactivity in the developing and adult brain, Neuroscience, 66, 189, 10.1016/0306-4522(94)00584-R · DOI
- K Kiuchi, 2009, Abnormalities of the uncinate fasciculus and posterior cingulate fasciculus in mild cognitive impairment and early Alzheimer's disease: A diffusion tensor tractography study, Brain Research, 1287, 184, 10.1016/j.brainres.2009.06.052 · DOI
- G Gong, 2009, Age- and gender-related differences in the cortical anatomical network, J Neurosci, 29, 15684, 10.1523/JNEUROSCI.2308-09.2009 · DOI
- M Greicius, 2003, Functional connectivity in the resting brain: a network analysis of the default mode hypothesis, Proc Natl Acad Sci U S A, 100, 253, 10.1073/pnas.0135058100 · DOI · Paper page
- AR Laird, 2009, Investigating the functional heterogeneity of the default mode network using coordinate-based meta-analytic modeling, J Neurosci, 29, 14496, 10.1523/JNEUROSCI.4004-09.2009 · DOI
- W De Haan, 2012, Disrupted modular brain dynamics reflect cognitive dysfunction in Alzheimer's disease, Neuroimage, 59, 3085, 10.1016/j.neuroimage.2011.11.055 · DOI
- DS Bassett, 2011, Conserved and variable architecture of human white matter connectivity, Neuroimage, 54, 1262, 10.1016/j.neuroimage.2010.09.006 · DOI
- A Fornito, 2010, Network scaling effects in graph analytic studies of human resting-state FMRI data, Front Syst Neurosci, 4, 22
- J Hänggi, 2011, Globally Altered Structural Brain Network Topology in Grapheme-Color Synesthesia, J Neurosci, 31, 5816, 10.1523/JNEUROSCI.0964-10.2011 · DOI
- T Paus, 1996, Human cingulate and paracingulate sulci: pattern, variability, asymmetry, and probabilistic map, Cereb Cortex, 6, 207, 10.1093/cercor/6.2.207 · DOI
- M Pievani, 2011, Functional network disruption in the degenerative dementias, Lancet Neurol, 10, 829, 10.1016/S1474-4422(11)70158-2 · DOI · Paper page
- Dai D, He H, Vogelstein J, Hou Z (2011) Network-based classification using cortical thickness of AD patients. Machine Learning in Medical Imaging: 193–200. · DOI
- L Zhou, 2011, Hierarchical anatomical brain networks for MCI prediction: Revisiting volumetric measures, PLoS ONE, 6, e21935, 10.1371/journal.pone.0021935 · DOI
- CJ Stam, 2007, Small-world networks and functional connectivity in Alzheimer's disease, Cereb Cortex, 17, 92, 10.1093/cercor/bhj127 · DOI
- C-Y Lo, 2010, Diffusion tensor tractography reveals abnormal topological organization in structural cortical networks in Alzheimer's disease, J Neurosci, 30, 16876, 10.1523/JNEUROSCI.4136-10.2010 · DOI
- N Langer, 2011, Functional brain network efficiency predicts intelligence, Hum Brain Mapp, 33, 1393, 10.1002/hbm.21297 · DOI
- AJ Mitchell, 2008, The clinical significance of subjective memory complaints in the diagnosis of mild cognitive impairment and dementia: a meta-analysis, Int J Geriat Psychiatry, 23, 1191, 10.1002/gps.2053 · DOI
Cited by
Sorted by citations
Modern network science of neurological disorders
Stam, C. J. (2014) · Nature reviews. Neuroscience · doi:10.1038/nrn3801 · Cited by 1,327
Self-citationAlzheimer's disease: connecting findings from graph theoretical studies of brain networks
Tijms, B. M., Wink, A. M., de Haan, W., van der Flier, W. M., Stam, C. J., Scheltens, P., & Barkhof, F. (2013) · Neurobiology of Aging · doi:10.1016/j.neurobiolaging.2013.02.020 · Cited by 416
“Several studies have found moderate to strong correlations between graph properties and neuropsychological measurements in AD and MCI (de Haan et al., 2009, 2012c; Lo et al., 2010; SanzArigita et al., 2010; Shu et al., 2012; Stam et al., 2007, 2009; Tijms et al., 2013 Wang et al., 2012).”
BackgroundMethodInfluentialSelf-citationHuman brain mapping: A systematic comparison of parcellation methods for the human cerebral cortex
Arslan, S., Ktena, S. I., Makropoulos, A., Robinson, E. C., Rueckert, D., & Parisot, S. (2018) · NeuroImage · doi:10.1016/j.neuroimage.2017.04.014 · Cited by 374
“It has been common525 practice in recent neuroscience studies to explore several neurological (Tijms et al., 2013; Fornito et al., 2015) and neuro-developmental disorders (Jafri et al., 2008; Liu et al., 2008; Dennis et al., 2011; Fornito et al., 2012) from a network perspective.”
BackgroundAmsterdam Dementia Cohort: Performing Research to Optimize Care
van der Flier, W. M., & Scheltens, P. (2018) · Journal of Alzheimer s Disease · doi:10.3233/jad-170850 · Cited by 388
Self-citationThe human connectome in Alzheimer disease — relationship to biomarkers and genetics
Yu, M., Sporns, O., & Saykin, A. J. (2021) · Nature Reviews Neurology · doi:10.1038/s41582-021-00529-1 · Cited by 265
Relationship Between White Matter Hyperintensities, Cortical Thickness, and Cognition
Tuladhar, A. M., Reid, A. T., Shumskaya, E., de Laat, K. F., van Norden, A. G. W., van Dijk, E. J., Norris, D. G., & de Leeuw, F.-E. (2015) · Stroke · doi:10.1161/strokeaha.114.007146 · Cited by 195
Dai, Z., & He, Y. (2014) · Neuroscience Bulletin · doi:10.1007/s12264-013-1421-0 · Cited by 173
“In contrast, Tijms et al.([28]) investigated the graph properties of a single-individual gray-matter network in AD and found decreases in clustering coefficients, characteristic path lengths, normalized clustering coeffi cients, and normalized characteristic path lengths.”
BackgroundInfluentialComplex Brain Network Analysis and Its Applications to Brain Disorders: A Survey
Liu, J., Li, M., Pan, Y. F., Lan, W., Zheng, R., Wu, F., & Wang, J. (2017) · Complexity · doi:10.1155/2017/8362741 · Cited by 147
“[96] found that, compared with the HC group, the AD group exhibited decreased small-world index, while Wang et al.”
BackgroundResultInfluentialPereira, J. B., Mijalkov, M., Kakaei, E., Mecocci, P., Vellas, B., Tsolaki, M., Kłoszewska, I., Soininen, H., Spenger, C., Lovestone, S., et al. (2016) · Cerebral Cortex · doi:10.1093/cercor/bhw128 · Cited by 142
“Key words: closeness centrality, clustering, modularity, structural covariance networks, transitivity”
BackgroundMears, D. J., & Pollard, H. B. (2016) · Journal of Neuroscience Research · doi:10.1002/jnr.23705 · Cited by 122
“Examples include epilepsy (Ponten et al., 2007; van Die-ssen et al., 2013; Bernhardt et al., 2015), dementia (Stam et al., 2007; Agosta et al., 2013; Tijms et al., 2013), Parkinson’s disease (Skidmore et al., 2011; Olde Dubbelink et al., 2014), schizophrenia (Micheloyannis et al., 2006; van den…”
BackgroundData-driven modelling of neurodegenerative disease progression: thinking outside the black box
Young, A. L., Oxtoby, N. P., Garbarino, S., Fox, N. C., Barkhof, F., Schott, J. M., & Alexander, D. C. (2024) · Nature reviews. Neuroscience · doi:10.1038/s41583-023-00779-6 · Cited by 120
“Joint inference of the data-driven disease time axis and biomarker trajectories is performed by iteratively fitting a set of biomarker trajectories and temporally realigning individuals to improve their alignment with the fitted biomarker trajectories.”
Self-citationLei, D., Pinaya, W. H. L., Young, J., van Amelsvoort, T., Marcelis, M. C., Donohoe, G. J., Mothersill, D., Corvin, A. P., Vieira, S., Huang, X., et al. (2019) · Human Brain Mapping · doi:10.1002/hbm.24863 · Cited by 100
“This may confirmed the promising results of previous studies that had investigated this measure in individuals at familial risk for schizophrenia (Tijms et al., 2015) and patients with Alzheimer's disease (Tijms, Moller et al., 2013; Tijms, Wink et al., 2013; Tijms et al., 2014; Tijms et al., 2016).”
ResultGenetic variants in Alzheimer disease — molecular and brain network approaches
Gaiteri, C., Mostafavi, S., Honey, C. J., Jager, P. L. D., & Bennett, D. A. (2016) · Nature Reviews Neurology · doi:10.1038/nrneurol.2016.84 · Cited by 97
Reduced integration and improved segregation of functional brain networks in Alzheimer’s disease
Kabbara, A., Eid, H., Falou, W. E., Khalil, M. A., Wendling, F., & Hassan, M. (2018) · Journal of Neural Engineering · doi:10.1088/1741-2552/aaaa76 · Cited by 94
Phillips, D. J., McGlaughlin, A., Ruth, D. M., Jager, L. R., & Soldan, A. (2015) · NeuroImage Clinical · doi:10.1016/j.nicl.2015.01.007 · Cited by 92
“…of disease severity (Heet al., 2008; Yaoet al., 2010; Zhaoet al., 2012),others have reported a decrease (Li et al., 2012; Stam et al., 2009; Sun et al., 2014; Tijms et al., 2013a) and still others found no difference (Bai et al., 2012; Lo et al., 2010; Sanz-Arigita et al., 2010; Stam et al., 2007).”
BackgroundMethodResultInfluentialIndividual‐level brain morphological similarity networks: Current methodologies and applications
Cai, M., Ma, J., Wang, Z., Zhao, Y., Zhang, Y., Wang, H., Xue, H., Chen, Y., Zhang, Y., Wang, C., et al. (2023) · CNS Neuroscience & Therapeutics · doi:10.1111/cns.14384 · Cited by 78
“47,48 The morphological similarity measurement can better reveal cortical structural changes and impairments in memory as well as cognition in patients with AD.”
BackgroundMak, E., Gabel, S., Mirette, H., Su, L., Williams, G. B., Waldman, A., Wells, K., Ritchie, K., Ritchie, C., & O’Brien, J. (2017) · Ageing Research Reviews · doi:10.1016/j.arr.2016.10.001 · Cited by 71
“In contrast, others have reported decrease clustering in AD (Tijms et al., 2013a).”
Batallé, D., Muñoz‐Moreno, E., Figueras, F., Bargalló, N., Eixarch, E., & Gratacós, E. (2013) · NeuroImage · doi:10.1016/j.neuroimage.2013.07.045 · Cited by 75
“Recently, a number of published reports have suggested approaches to extract individual brain networks based on the analysis of the similarities of GM features (Raj et al., 2010; Tijms et al., 2012, 2013; Zhou et al., 2011).”
BackgroundAltered topology of the functional speech production network in non-fluent/agrammatic variant of PPA
Mandelli, M. L., Welch, A. E., Vilaplana, E., Watson, C., Battistella, G., Brown, J. A., Possin, K. L., Hubbard, H. I., Miller, Z. A., Henry, M. L., et al. (2018) · Cortex · doi:10.1016/j.cortex.2018.08.002 · Cited by 67
Zheng, W., Yao, Z., Xie, Y., Fan, J., & Hu, B. (2018) · Biological Psychiatry Cognitive Neuroscience and Neuroimaging · doi:10.1016/j.bpsc.2018.06.004 · Cited by 63
Tijms, B. M., Yeung, H. M., Sikkes, S. A. M., Möller, C., Smits, L. L., Stam, C. J., Scheltens, P., van der Flier, W. M., & Barkhof, F. (2014) · Brain Connectivity · doi:10.1089/brain.2013.0209 · Cited by 67
Self-citationGray matter networks and clinical progression in subjects with predementia Alzheimer's disease
Tijms, B. M., ten Kate, M., Gouw, A. A., Borta, A., Verfaillie, S. C. J., Teunissen, C. E., Scheltens, P., Barkhof, F., & van der Flier, W. M. (2017) · Neurobiology of Aging · doi:10.1016/j.neurobiolaging.2017.09.011 · Cited by 69
“We previously have shown that worse grey matter network disruptions are associated with worse disease severity and cognitive dysfunction [20,21].”
Self-citationStability of graph theoretical measures in structural brain networks in Alzheimer’s disease
Mårtensson, G., Pereira, J. B., Mecocci, P., Vellas, B., Tsolaki, M., Kłoszewska, I., Soininen, H., Lovestone, S., Simmons, A., Volpe, G., et al. (2018) · Scientific Reports · doi:10.1038/s41598-018-29927-0 · Cited by 60
Gray matter network disruptions and amyloid beta in cognitively normal adults
Tijms, B. M., Kate, M. T., Wink, A. M., Visser, P. J., Ecay, M., Clerigue, M., Estanga, A., Garcia Sebastian, M., Izagirre, A., Villanua, J., et al. (2016) · Neurobiology of Aging · doi:10.1016/j.neurobiolaging.2015.10.015 · Cited by 59
Self-citationBrain gray matter network organization in psychotic disorders
Zhang, W., Lei, D., Keedy, S., Ivleva, E. I., Eum, S., Li, Y., Tamminga, C. A., Clementz, B. A., Keshavan, M. S., Pearlson, G. D., et al. (2019) · Neuropsychopharmacology · doi:10.1038/s41386-019-0586-2 · Cited by 56
Hafkemeijer, A., Möller, C., Dopper, E. G. P., Jiskoot, L. C., van den Berg‐Huysmans, A. A., Swieten, J. C. V., van der Flier, W. M., Vrenken, H., Pijnenburg, Y. A. L., Barkhof, F., et al. (2015) · Human Brain Mapping · doi:10.1002/hbm.23081 · Cited by 59
“Our findings are in line with the observations of decreased network integrity [Montembeault et al., 2015; Spreng and Turner, 2013; Tijms et al., 2013] and cortical shrinking [He et al., 2008; Reid and Evans, 2013] in this network in AD compared with controls.”
ResultSelf-citationChen, T., Kendrick, K. M., Wang, J., Wu, M. C., Li, K., Huang, X., Luo, Y., Lui, S., Sweeney, J. A., & Gong, Q. (2017) · Human Brain Mapping · doi:10.1002/hbm.23534 · Cited by 59
“Second, while the construction of similarity-based individual structural networks has been successfully applied to other neuropsychiatric disorders [Tijms et al., 2013, 2014], the biological significance of these network alterations needs to be more fully understood.”
BackgroundMethodGray matter networks and cognitive impairment in multiple sclerosis
Rimkus, C. D. M., Schoonheim, M. M., Steenwijk, M. D., Vrenken, H., Eijlers, A. J. C., Killestein, J., Wattjes, M. P., Leite, C. C., Barkhof, F., & Tijms, B. M. (2018) · Multiple Sclerosis Journal · doi:10.1177/1352458517751650 · Cited by 50
“10,11 The first gray matter network studies in MS based on cortical thickness inter-regional correlation analysis have demonstrated that gray matter networks become disorganized, 12,13 which seems to be associated with white matter lesion load 12 and disrupted functional connectivity.”
Self-citationDisruption of Resting Functional Connectivity in Alzheimer’s Patients and At-Risk Subjects
Krajčovičová, L., Mareček, R., Mikl, M., & Rektorová, I. (2014) · Current Neurology and Neuroscience Reports · doi:10.1007/s11910-014-0491-3 · Cited by 51
Verfaillie, S. C. J., Slot, R. E. R., Dicks, E., Prins, N. D., Overbeek, J. M., Teunissen, C. E., Scheltens, P., Barkhof, F., van der Flier, W. M., & Tijms, B. M. (2018) · Human Brain Mapping · doi:10.1002/hbm.24065 · Cited by 50
Self-citationNovel Cortical Thickness Pattern for Accurate Detection of Alzheimer’s Disease
Zheng, W., Yao, Z., Hu, B., Gao, X., Cai, H., Moore, P. T., & Initiative, A. F. T. A. D. N. (2015) · Journal of Alzheimer s Disease · doi:10.3233/jad-150311 · Cited by 42
Vignando, M., ffytche, D., Lewis, S. J. G., Lee, P. H., Chung, S. J., Weil, R. S., Hu, M. T., Mackay, C. E., Griffanti, L., Pins, D., et al. (2022) · Nature Communications · doi:10.1038/s41467-022-28087-0 · Cited by 42
Beheshti, I., Maikusa, N., Matsuda, H., Demirel, H., & Anbarjafari, G. (2016) · Journal of Alzheimer's Disease · doi:10.3233/jad-160850 · Cited by 42
Gray Matter Network Disruptions and Regional Amyloid Beta in Cognitively Normal Adults
ten Kate, M., Visser, P. J., Bakardjian, H., Barkhof, F., Sikkes, S. A. M., van der Flier, W. M., Scheltens, P., Hampel, H., Habert, M.-O., Dubois, B., et al. (2018) · Frontiers in Aging Neuroscience · doi:10.3389/fnagi.2018.00067 · Cited by 41
Self-citationMultiplex Networks for Early Diagnosis of Alzheimer's Disease
Amoroso, N., Rocca, M. L., Bruno, S., Maggipinto, T., Monaco, A., Bellotti, R., & Tangaro, S. (2018) · Frontiers in Aging Neuroscience · doi:10.3389/fnagi.2018.00365 · Cited by 59
Grey matter networks in people at increased familial risk for schizophrenia
Tijms, B. M., Sprooten, E., Job, D. E., Johnstone, E. C., Owens, D. G. C., Willshaw, D. J., Seriès, P., & Lawrie, S. M. (2015) · Schizophrenia Research · doi:10.1016/j.schres.2015.08.025 · Cited by 42
“Wehave previously demonstrated that an a priori difference in the amount inweak connections can influence other network property values, even if the connectivity density is identical (Tijms et al., 2013).”
BackgroundSelf-citationFujii, H., Sato, W., Kimura, Y., Matsuda, H., Ota, M., Maikusa, N., Suzuki, F., Amano, K., Shin, I., Yamamura, T., et al. (2020) · Journal of Neuroimaging · doi:10.1111/jon.12751 · Cited by 37
Kesler, S. R., Acton, P., Rao, V., & Ray, W. J. (2018) · Network Neuroscience · doi:10.1162/netn_a_00048 · Cited by 34
Altered Network Topology in Patients with Primary Brain Tumors After Fractionated Radiotherapy
Bahrami, N., Seibert, T. M., Karunamuni, R. A., Bartsch, H., Krishnan, A. P., Farid, N., Hattangadi-Gluth, J. A., & McDonald, C. R. (2017) · Brain Connectivity · doi:10.1089/brain.2017.0494 · Cited by 36
“…that RT may result in damage to vascular endothelial cells and to the hippocampus (Kim et al., 2004; Seibert et al., 2017), studies that have applied graph theory to examine cortical networks in patients with AD may serve as good models (He et al., 2008; Pereira et al., 2016; Tijms et al., 2013b).”
BackgroundInfluentialA Graph Theory Approach to Clarifying Aging and Disease Related Changes in Cognitive Networks
Wright, L. M., Marco, M. D., & Venneri, A. (2021) · Frontiers in Aging Neuroscience · doi:10.3389/fnagi.2021.676618 · Cited by 32
Structural covariance analysis for neurodegenerative and neuroinflammatory brain disorders
Mongay‐Ochoa, N., González‐Escamilla, G., Fleischer, V., Pareto, D., Rovira, À., Sastre‐Garriga, J., & Groppa, S. (2025) · Brain · doi:10.1093/brain/awaf151 · Cited by 32
“Patients with a more severe cognitive impairment have been shown to display more random graph-based morphometric properties, 41 as indicated by correlations between the average path length, clustering coefficient and the Mini-Mental State Examination (MMSE) scores, particularly evident in the left…”
Influentialvan Duinkerken, E., IJzerman, R. G., Klein, M., Moll, A. C., Snoek, F. J., Scheltens, P., Pouwels, P. J. W., Barkhof, F., Diamant, M., & Tijms, B. M. (2015) · Human Brain Mapping · doi:10.1002/hbm.23096 · Cited by 28
“This is similar to our previous research also showing that using 20 random reference graphs is sufficient to obtain stable network statistics [Tijms et al., 2013].”
BackgroundResultSelf-citationWatson, C. G., Stopp, C. D., Newburger, J. W., & Rivkin, M. J. (2018) · Brain and Behavior · doi:10.1002/brb3.834 · Cited by 31
“A vertex was considered to be a hub if its betweenness centrality was at least one standard deviation greater than the mean across all vertices for that density (Bernhardt et al., 2011; Hosseini et al., 2013; Tijms et al., 2013; Wang et al., 2013).”
BackgroundAlzhemimer’s Disease is Characterized by Lower Segregation in Resting-State Eyes-Closed EEG
Aydın, S. (2024) · Journal of Medical and Biological Engineering · doi:10.1007/s40846-024-00917-0 · Cited by 32
“However, the following studies did not find group differences in global connectivity between AD and controls with respect to resting-state fMRI data [15, 49].”
Divergent topological networks in Alzheimer’s disease: a diffusion kurtosis imaging analysis
Cheng, J.-X., Zhang, H., Peng, Z.-K., Xu, Y. Q., Tang, H., Wu, J., & Xu, J. L. (2018) · Translational Neurodegeneration · doi:10.1186/s40035-018-0115-y · Cited by 27
“On the contrary, decreased Lp in AD was also demonstrated by using sMRI and DTI [17, 54].”
MethodDisrupted grey matter network morphology in pediatric posttraumatic stress disorder
Niu, R., Lei, D., Chen, F., Chen, Y., Suo, X., Li, L., Lui, S., Huang, X., Sweeney, J. A., & Gong, Q. (2018) · NeuroImage Clinical · doi:10.1016/j.nicl.2018.03.030 · Cited by 35
Dyrba, M., Mohammadi, R., Grothe, M. J., Kirste, T., & Teipel, S. J. (2020) · Frontiers in Aging Neuroscience · doi:10.3389/fnagi.2020.00099 · Cited by 47
Reduced local segregation of single‐subject gray matter networks in adult PTSD
Niu, R., Lei, D., Chen, F., Chen, Y., Suo, X., Li, L., Lui, S., Huang, X., Sweeney, J. A., & Gong, Q. (2018) · Human Brain Mapping · doi:10.1002/hbm.24330 · Cited by 26
Tau-related grey matter network breakdown across the Alzheimer’s disease continuum
Pelkmans, W., Ossenkoppele, R., Dicks, E., Strandberg, O. T., Barkhof, F., Tijms, B. M., Pereira, J. B., & Hansson, O. (2021) · Alzheimer s Research & Therapy · doi:10.1186/s13195-021-00876-7 · Cited by 26
“In AD dementia patients nearly all network metrics were abnormal, suggesting that with pronounced neurodegeneration GM networks exhibit significant topological alterations, which is in line with previous studies in AD dementia [18, 22, 23].”
ResultSelf-citationStructural cortical network reorganization associated with early conversion to multiple sclerosis
Tur, C., Eshaghi, A., Altmann, D. R., Jenkins, T. M., Prados, F., Grussu, F., Charalambous, T., Schmidt, A., Sebastien Ourselin, A., Clayden, J. D., et al. (2018) · Scientific Reports · doi:10.1038/s41598-018-29017-1 · Cited by 24
Brain Structural Covariance Network Topology in Remitted Posttraumatic Stress Disorder
Sun, D., Davis, S. L., Haswell, C. C., Swanson, C. A., Workgroup, M.-A. M., LaBar, K. S., Fairbank, J. A., & Morey, R. A. (2018) · Frontiers in Psychiatry · doi:10.3389/fpsyt.2018.00090 · Cited by 24
“An single-subject gray matter graph method has been developed in recent years (78, 79) and should be utilized in future studies of PTSD and remission.”
MethodJiang, J., Zhou, H., Duan, H., Liu, X., Zuo, C., Huang, Z., Yu, Z., & Yan, Z. (2017) · Heliyon · doi:10.1016/j.heliyon.2017.e00475 · Cited by 27
“A decrease clustering in the AD group could also be found [39, 40], etc.”
BackgroundCoronary Heart Disease and Cortical Thickness, Gray Matter and White Matter Lesion Volumes on MRI
Vuorinen, M., Damangir, S., Niskanen, E. I., Miralbell, J., Rusanen, M., Spulber, G., Soininen, H. S., Kivipelto, M., & Solomon, A. (2014) · PLoS ONE · doi:10.1371/journal.pone.0109250 · Cited by 20
Rozhkov, A. (2024) · Applied Energy · doi:10.1016/j.apenergy.2024.122854 · Cited by 25
Wang, X., Cui, X., Ding, C., Li, D., Chen, C., Wang, B., & Xiang, J. (2020) · Journal of Magnetic Resonance Imaging · doi:10.1002/jmri.27453 · Cited by 24
“However, hubs are also the weakest links in the network.(33) Studies have shown that hubs in the network may be selectively vulnerable in AD patients.”
BackgroundDicks, E., van der Flier, W. M., Scheltens, P., Barkhof, F., & Tijms, B. M. (2020) · Neurobiology of Aging · doi:10.1016/j.neurobiolaging.2020.05.008 · Cited by 25
“We and others have shown that gray matter networks are disrupted in AD (He et al., 2008; Pereira et al., 2016; Tijms et al., 2013a,b; Yao et al., 2010), associated with cognitive impairment (Tijms et al., 2013a, 2014), and related to faster disease progression and cognitive decline in the…”
Self-citationBrain structural connectivity atrophy in Alzheimer's diseasePreprint
Amoroso, N., Rocca, M. L., Bruno, S., Maggipinto, T., Monaco, A., Bellotti, R., & Tangaro, S. (2017) · arXiv (Cornell University) · doi:10.48550/arxiv.1709.02369 · Cited by 13
“Several studies have already pointed out, especially with group-wise single layer approaches 51 , how these features can describe significant differences among healthy and diseased subjects.”
BackgroundDisrupted brain gray matter networks in drug-naïve participants with essential tremor
Yang, J., Lei, D., Peng, J., Suo, X., Pinaya, W. H. L., Li, W., Li, J., Kemp, G. J., Peng, R., & Gong, Q. (2021) · Neuroradiology · doi:10.1007/s00234-021-02653-7 · Cited by 21
Hypermetabolic Cerebellar Connectome in Alzheimer's Disease
Gupta, V. K., Booth, S., Ko, J. H., & Initiative, A. D. N. (2021) · Brain Connectivity · doi:10.1089/brain.2020.0937 · Cited by 22
“…of short path length and high clustering in the AD network suggests an evolutionary optimization of the equilibrium between information segregation (represented by nodes forming particular clusters) and information integration (represented by interactions among clusters; Tijms et al., 2013a).”
Multivariate regression analysis of structural MRI connectivity matrices in Alzheimer’s disease
Rasero, J., Amoroso, N., Rocca, M. L., Tangaro, S., Bellotti, R., Stramaglia, S., & Initiative, A. D. N. (2017) · PLoS ONE · doi:10.1371/journal.pone.0187281 · Cited by 18
Vermunt, L., Dicks, E., Wang, G., Dincer, A., Flores, S. E., Keefe, S., Berman, S., Cash, D. M., Chhatwal, J. P., Cruchaga, C., et al. (2020) · Brain Communications · doi:10.1093/braincomms/fcaa102 · Cited by 20
Self-citationZheng, W., Yao, Z., Li, Y., Zhang, Y., Hu, B., Wu, D., & Initiative, A. D. N. (2019) · Frontiers in Human Neuroscience · doi:10.3389/fnhum.2019.00399 · Cited by 19
Wang, B., Miao, L., Niu, Y., Cao, R., Li, D., Yan, P., Guo, H., Yan, T., Wu, J., Xiang, J., et al. (2018) · Journal of Alzheimer s Disease · doi:10.3233/jad-180603 · Cited by 24
The Brain Network Hub Degeneration in Alzheimer’s Disease
Jin, S., Wang, J., & Yong He, A. (2024) · Biophysics Reports · doi:10.52601/bpr.2024.230025 · Cited by 11
“Specifically, using a cube-based correlation method for single-subject morphological brain networks, Tijms and colleagues found AD-related betweenness decreases in the posterior cingulate gyrus, parahippocampal gyrus, lingual gyrus, and bilateral thalamus (Tijms et al. 2013a).”
MethodResultGrey matter network trajectories across the Alzheimer’s disease continuum and relation to cognition
Dicks, E., Vermunt, L., van der Flier, W. M., Barkhof, F., Scheltens, P., Tijms, B. M., & Initiative, A. D. N. (2020) · Brain Communications · doi:10.1093/braincomms/fcaa177 · Cited by 20
Self-citationAltered structural connectivity networks in dementia with lewy bodies
Nicastro, N., Mak, E., Surendranathan, A., Rittman, T., Rowe, J., & O'Brien, J. (2021) · Brain Imaging and Behavior · doi:10.1007/s11682-020-00444-x · Cited by 17
Single-subject structural cortical networks in clinically isolated syndrome
Collorone, S., Prados, F., Hagens, M. H. J., Tur, C., Kanber, B., Sudre, C. H., Lukas, C., Gasperini, C., Oreja‐Guevara, C., Andělová, M., et al. (2019) · Multiple Sclerosis Journal · doi:10.1177/1352458519865739 · Cited by 17
Self-citationVignando, M., Ffytche, D., Lewis, S., Lee, P., Chung, S., Weil, R., Hu, M., Mackay, C., Griffanti, L., Pins, D., et al. (2021) · medRxiv · doi:10.1101/2021.02.17.21251558 · Cited by 16
“A hub was categorised as such if its betweenness centrality was greater than the mean plus 1 standard deviation - calculated on all vertices at the same density (e.g. Bernhardt et al., 2011; Hosseini et al., 2013; Tijms et al., 2013; Wang et al., 2013; Watson et al., 2018).”
BackgroundHawkins, R., Shatil, A. S., Lee, L., Sengupta, A., Zhang, L., Morrow, S. A., & Aviv, R. I. (2020) · American Journal of Neuroradiology · doi:10.3174/ajnr.a6435 · Cited by 17
“Reduction in l is indicative of a more random network and mirrors prior findings in MS, mild cognitive impairment, and Alzheimer disease.(13,23,24) Our results reinforce the link between reduced white matter integrity and impairment, particularly in executive functioning and processing speed.”
Noroozıan, M. (2015) · Neurologic Clinics · doi:10.1016/j.ncl.2015.08.005 · Cited by 18
Li, W., Wang, M., Zhu, W., Qin, Y., Huang, Y., & Chen, X. (2016) · Scientific Reports · doi:10.1038/srep34156 · Cited by 15
Quantifying uncertainty in brain network measures using Bayesian connectomics
Janssen, R., Hinne, M., Heskes, T., & van Gerven, M. (2014) · Frontiers in Computational Neuroscience · doi:10.3389/fncom.2014.00126 · Cited by 15
Wang, Y.-Q., Li, J.-L., Jin, S.-H., Wang, J., Lv, Y.-T., Zou, Q.-H., & Wang, J.-H. (2024) · NeuroImage · doi:10.1016/j.neuroimage.2024.120673 · Cited by 14
“…have shown that various brain disorders were associated with anomalous topological organization for 1D-PD MCNs, such as Alzheimer ’ s disease (Tijms et al., 2013, 2014), multiple sclerosis (Fleischer et al., 2023; Yang et al., 2023), and depression (Chen et al., 2017; Han et al., 2023; Qiu…”
Tau trajectory in Alzheimer’s disease: Evidence from the connectome-based computational models
Bitra, V. R., Challa, S. R., Adiukwu, P. C., & Rapaka, D. (2023) · Brain Research Bulletin · doi:10.1016/j.brainresbull.2023.110777 · Cited by 15
Li, W., Yang, C., Wu, S., Nie, Y., Zhang, X., Lu, M., Chu, T., & Shi, F. (2018) · Frontiers in Neuroscience · doi:10.3389/fnins.2018.00927 · Cited by 13
Li, Q., Li, X., Wang, X., Li, Y., Li, K., Yu, Y., Yin, C., Li, S., & Han, Y. (2016) · Neural Plasticity · doi:10.1155/2016/3462309 · Cited by 20
“Previous studies have demonstrated that the cortical thickness and GM volume can be used as morphological descriptors to study the complex cortical networks, and networks based on the cortical thickness and GM volume followed the small-world properties [10–12, 43, 44].”
BackgroundDrenthen, G. S., Backes, W. H., Freeze, W. M., Jacobs, H. I. L., Verheggen, I. C. M., van Boxtel, M. P. J., Hoff, E. I., Verhey, F. R., & Jansen, J. F. A. (2022) · Journal of Alzheimer’s Disease · doi:10.3233/jad-220175 · Cited by 10
Oxtoby, N., Ferreira, F. S., Mihalik, A., Wu, T., Brudfors, M., Lin, H., Rau, A., Blumberg, S. B., Robu, M., Zor, C., et al. (2019) · ABCD-NP@MICCAI · doi:10.1007/978-3-030-31901-4_14 · Cited by 10
Cantero, J. L., Atienza, M., Sánchez‐Juan, P., Rodríguez‐Rodríguez, E., Vázquez‐Higuera, J. L., Pozueta, A., González‐Suárez, A., Vilaplana, E., Pegueroles, J., Montal, V., et al. (2017) · Neurobiology of Aging · doi:10.1016/j.neurobiolaging.2017.12.010 · Cited by 11
Ding, H., Wang, Z., Tang, Y., Wang, T., Qi, M., Dou, W., Qian, L., Gao, Y., Zhong, Q., Yang, X., et al. (2023) · Quantitative Imaging in Medicine and Surgery · doi:10.21037/qims-22-1373 · Cited by 10
“Moreover, an inter-individual level analysis was proposed recently, based on cortical similarities in gray matter morphology within single cases (19,21,29-34).”
InfluentialXiao, Y., Gao, L., Hu, Y., & Initiative, T. A. D. N. (2024) · Frontiers in Neuroscience · doi:10.3389/fnins.2024.1366761 · Cited by 10
“These findings are in line with previous structural (Tijms et al., 2013a; Sheng et al., 2021; Ng et al., 2022) and functional (Stam et al., 2009; Sanz-Arigita et al., 2010) network studies in AD.”
BackgroundResultChen, T., Zhu, J., Tsai, S., & Yang, A. C. (2024) · Alzheimer s Research & Therapy · doi:10.1186/s13195-024-01448-1 · Cited by 8
“Since research on individual-based structural networks is still developing, few studies have focused on the micro-scale patterns and investigated the single-subject networks in individuals with AD [48, 49].”
BackgroundAge and Sex-Related Effects on Single-Subject Gray Matter Networks in Healthy Participants
Yoko, S., Sato, N., Maikusa, N., Sone, D., Ota, M., Kimura, Y., Chiba, E., Okita, K., Yamao, T., Nakaya, M., et al. (2023) · Journal of Personalized Medicine · doi:10.3390/jpm13030419 · Cited by 8
“In Alzheimer’s disease, a typical age-related neurodegenerative disorder, gray matter networks are known to disrupt and move to random networks [11].”
BackgroundMethodShigemoto, Y., Sone, D., Okita, K., Maikusa, N., Yamao, T., Kimura, Y., Suzuki, F., Fujii, H., Kato, K., Sato, N., et al. (2021) · eNeurologicalSci · doi:10.1016/j.ensci.2021.100309 · Cited by 9
Ruiz-Gómez, S. J., Hornero, R., Poza, J., Santamaría-Vázquez, E., Rodríguez-González, V., Maturana-Candelas, A., & Gómez, C. (2021) · Journal of Neural Engineering · doi:10.1088/1741-2552/abd82c · Cited by 11
“Some works that investigated the average clustering coefficient did not find differences between AD and control subjects [14–16], others found significant decreases in AD [12, 17] and other studies also found an increased clustering in AD [18–20].”
BackgroundResultCognitive Performance Deficits and Dysgraphia in Alzheimer’s Disease Patients
Onofri, E., Mercuri, M., Salesi, M., Ricciardi, M. R., & Archer, T. (2015) · Open Medicine Journal · doi:10.2174/1874220301501010006 · Cited by 3
“In Western industrial nations, Alzheimer’s disease (AD) represents the most common form of dementia [5, 6], approximately 80% of cases [7], occupying fourth place among the causes of death (after heart disease and circulatory disorders, cancer and cerebral hemorrhage); the secondary forms of dementia, such as vascular…”
BackgroundChen, H.-F., Xu, J.-X., Lv, W.-P., Hu, Z.-Q., Ke, Z.-H., Qin, R.-M., Chen, Y., & Xu, Y. (2023) · Brain Research Bulletin · doi:10.1016/j.brainresbull.2023.110714 · Cited by 7
“The graph feature values in the parahippocampal gyrus, hippocampus, and precuneus had the highest correlations with cognitive decline in comparison with other brain regions (Tijms, 2013).”
Siddiqui, M., François, M., Rainey‐Smith, S. R., Martins, R. N., Masters, C. L., Ames, D. J., Rowe, C. C., Macaulay, L. S., Fenech, M. F., & Leifert, W. R. (2020) · Life · doi:10.3390/life10080141 · Cited by 8
Michelutti, M., Urso, D., Tafuri, B., Gnoni, V., Giugno, A., Zecca, C., Dell’Abate, M. T., Vilella, D., Manganotti, P., Blasi, R. D., et al. (2025) · Journal of Alzheimer s Disease · doi:10.1177/13872877251316794 · Cited by 7
“– 76 The latter demonstrated that, despite alterations of individual graph metrics and a tendency to randomization were documented by structural 74,75 and functional 76,77 covariance network analyses, such networks retained a general small-world organization, 74 – 77 as observed in our study.”
Altered Structural Brain Network Topology in Patients With Primary Craniocervical Dystonia
Wang, X., Hu, W.-H., Wang, H., Gao, D., Liu, Y.-Y., Zhang, X., Jiang, Y., Mo, J.-J., Meng, F.-G., Zhang, K., et al. (2022) · Frontiers in Neurology · doi:10.3389/fneur.2022.763305 · Cited by 6
Ng, K., Qian, X., Ng, K. K., Ji, F., Rosa-Neto, P., Gauthier, S., Kandiah, N., & Zhou, J. (2022) · bioRxiv · doi:10.7554/elife.77745 · Cited by 6
“…networks by computing intracortical similarities in GM morphology ( Tijms et al., 2012 ) showed that single-subject GM graph properties were associated with individual differences of clinical progression in AD ( Tijms et al., 2018 ; Tijms et al., 2014 ; Vermunt et al., 2020 ; Tijms et al., 2013 ).”
BackgroundNetwork Analyses and Nervous System Disorders
Medaglia, J. D., & Bassett, D. S. (2016) · Oxford University Press eBooks · doi:10.1093/acrefore/9780190264086.013.121 · Cited by 16
Individual-specific networks for prediction modelling – A scoping review of methods
Gregorich, M., Melograna, F., Sunqvist, M., Michiels, S., Steen, K. V., & Heinze, G. (2022) · BMC Medical Research Methodology · doi:10.1186/s12874-022-01544-6 · Cited by 6
“%) examined the normalized clustering coefficient and characteristic path length obtained by dividing the CC and CPL by the CC and CPL of multiple randomly generated networks [18, 20, 79, 81, 84, 88].”
Sanabria-Díaz, G., Démonet, J., Rodríguez‐Herreros, B., Draganski, B., Kherif, F., & Melie‐García, L. (2021) · NeuroImage Clinical · doi:10.1016/j.nicl.2021.102799 · Cited by 5
Lazarou, I., Georgiadis, K., Nikolopoulos, S., Oikonomou, V. P., Tsolaki, A., Kompatsiaris, I. Y., Tsolaki, M., & Kugiumtzis, D. (2020) · Brain Sciences · doi:10.3390/brainsci10060392 · Cited by 36
The relationship between negative life events and cortical structural connectivity in adolescents
Sibilia, F., Jost-Mousseau, C., Banaschewski, T., Barker, G. J., Büchel, C., Desrivières, S., Flor, H., Grigis, A., Garavan, H., Gowland, P. A., et al. (2024) · IBRO Neuroscience Reports · doi:10.1016/j.ibneur.2024.01.012 · Cited by 5
“Morphological similarity be-tween all cube pairs (ROIs) was calculated based on linear correlation (Tijms et al., 2013), rotating each cube relative to the other one to find the maximum linear correlation between them (this was the final correlation coefficient value considered for each voxel pair).”
BackgroundMethodYang, S., Wu, Y., Sun, L., Lu, Y., Qian, K., Kuang, H., Meng, J., & Wu, Y. (2023) · Brain Sciences · doi:10.3390/brainsci13101493 · Cited by 4
“The cube-based method constructs an SCN by partitioning the subject’s gray matter into cubes of 6 mm 3 in size [48], defining each cube as a node, and calculating the similarity of each cube Brain Sci. 2023 , 13 , 1493 11 of 13 as an edge, which is a relatively good method for the construction of…”
MethodCai, H.-M., Liu, H., Yang, D., Wu, G.-R., Hu, B., & Chen, J. (2023) · IEEE journal of biomedical and health informatics · doi:10.1109/jbhi.2023.3250711 · Cited by 4
“…an abnormal small-world property; Yao et al. [12] found the greatest clustering coefficient and the longest absolute path length in AD; Tijms et al. [13] found decreased small-world index in AD; Pereira et al. [14] found that all patient groups exhibited increased path length, reduced transitivity,…”
BackgroundOta, M., Numata, Y., Kitabatake, A., Tsukada, E., Kaneta, T., Asada, T., Meno, K., Uchida, K., Suzuki, H., Korenaga, T., et al. (2021) · Psychiatry Research Neuroimaging · doi:10.1016/j.pscychresns.2021.111415 · Cited by 3
Structural similarity networks reveal brain vulnerability in dementia
Montagnese, M., Ebneabbasi, A., García-San-Martín, N., Pecci-Terroba, C., Romero-García, R., Morgan, S. E., Cole, J. H., Seidlitz, J., Rittman, T., & Bethlehem, R. A. I. (2025) · Alzheimer s & Dementia · doi:10.1002/alz.70973 · Cited by 5
“62,63 The predominance of negative deviations, indicating that regions are becoming less morphometricallysimilartotherestofthecortexthanexpectediscon-sistent with a potential alteration in the coordinated structural organization of the cortex.”
Metadata
- Authors
- Tijms, B. M., Möller, C., Vrenken, H., Wink, A. M., de Haan, W., van der Flier, W. M., Stam, C. J., Scheltens, P., & Barkhof, F.
- Affiliations
- Amsterdam UMC Location Vrije Universiteit Amsterdam (NL)
- Corresponding author
- Tijms, Betty M.
- ORCID
- Venue
- PLoS ONE
- Publisher
- Public Library of Science (PLoS)
- Published
- 2013-03-11
- Volume
- 8
- Issue
- 3
- Pages
- e58921
- ISSN
- 1932-6203 (ISSN-L)
- PMC
- PMC3594199
- OpenAlex
- W2058087702
- Cited by
- 132
- References
- 102
- Citations by year
- 2026: 2 · 2025: 6 · 2024: 12 · 2023: 8 · 2022: 11 · 2021: 15 · 2020: 11 · 2019: 6 · 2018: 18 · 2017: 11 · 2016: 10 · 2015: 12 · 2014: 7 · 2013: 3
- FWCI
- 5.85
- Type
- journal article
- Language
- en
- Update notices
- correction (2013-09-09)
- Open access
- gold
- doi.org
- Locations
- PLoS ONE (publishedVersion, cc-by)
- Europe PMC (PubMed Central) (publishedVersion, cc-by)
- PubMed Central (publishedVersion, cc-by)
- PubMed (publishedVersion)
- DOAJ (DOAJ: Directory of Open Access Journals) (submittedVersion, cc-by-sa)
- UCL Discovery (University College London) (submittedVersion)
- Pure Amsterdam UMC (submittedVersion)
- Data Archiving and Networked Services (DANS) (submittedVersion, other-oa)
- Data Archiving and Networked Services (DANS) (submittedVersion)
- Funders
- Stichting Dioraphte
- Alzheimer Nederland
- Topics
- Life Sciences › Neuroscience › Cognitive Neuroscience › Functional Brain Connectivity Studies
- Health Sciences › Medicine › Psychiatry and Mental health › Dementia and Cognitive Impairment Research
- Life Sciences › Neuroscience › Cellular and Molecular Neuroscience › Alzheimer's disease research and treatments
- Keywords
- Alzheimer's disease, structural graph, small-world property, path length, clustering coefficient, cognitive decline, cortical morphology, hippocampus, parahippocampal gyrus, precuneus, fusiform gyrus, gray matter volume, disease prognosis
- MeSH terms
- Aged, Alzheimer Disease, Brain Mapping, Electroencephalography, Female, Humans, Magnetic Resonance Imaging, Male, Psychiatric Status Rating Scales, Severity of Illness Index, Case-Control Studies, Neuroimaging
About these checks
Registry, retraction, Cites and statistics results are computed, not judged, with one exception: a printed reference that no index lists is read once by a model before it counts as a citation error. Claims are extracted by a model and kept only when their quote appears verbatim in the text; each cited source is then checked, with a model’s help, for whether it says what the claim relies on. Those verdicts can be wrong — read the claim’s quote and the cited source before relying on one.
Statistics and arithmetic are recomputed, not judged.
Confidence bands are shown only for fields calibrated on our annotated test set. None is calibrated yet, so no band is shown.
What counts as a claim ›How we measure confidence ›How we check this ›
Are you an author, or do you see a problem with this page? Request a review
