

Graphical Tools for Network Meta-Analysis in STATA
Open accessThe DOI matches its Crossref record; 51 of the 51 references it cites were found in a registry or an index.
Abstract
Network meta-analysis synthesizes direct and indirect evidence in a network of trials that compare multiple interventions and has the potential to rank the competing treatments according to the studied outcome. Despite its usefulness network meta-analysis is often criticized for its complexity and for being accessible only to researchers with strong statistical and computational skills. The evaluation of the underlying model assumptions, the statistical technicalities and presentation of the results in a concise and understandable way are all challenging aspects in the network meta-analysis methodology. In this paper we aim to make the methodology accessible to non-statisticians by presenting and explaining a series of graphical tools via worked examples. To this end, we provide a set of STATA routines that can be easily employed to present the evidence base, evaluate the assumptions, fit the network meta-analysis model and interpret its results.
Overview
The claims and statistics of this paper haven’t been checked yet.
Free: it reads the open-access text and checks the first 5 claims that cite a source we can check. Create a free account to check every claim.
Integrity signals
Registry
Cites
Statistics
Figures
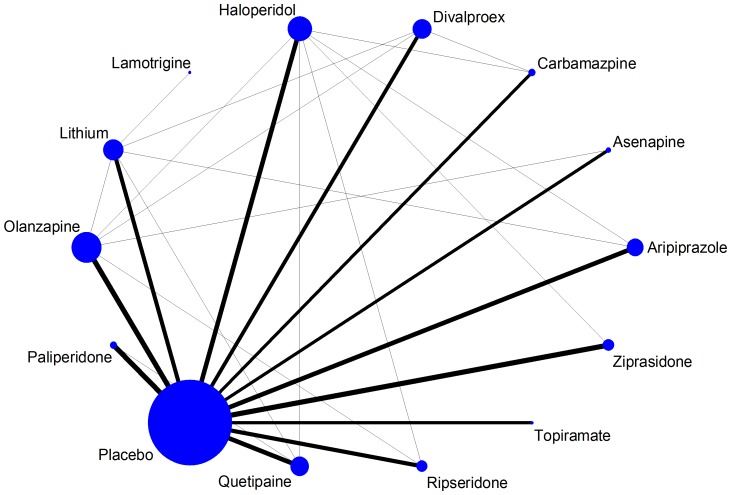
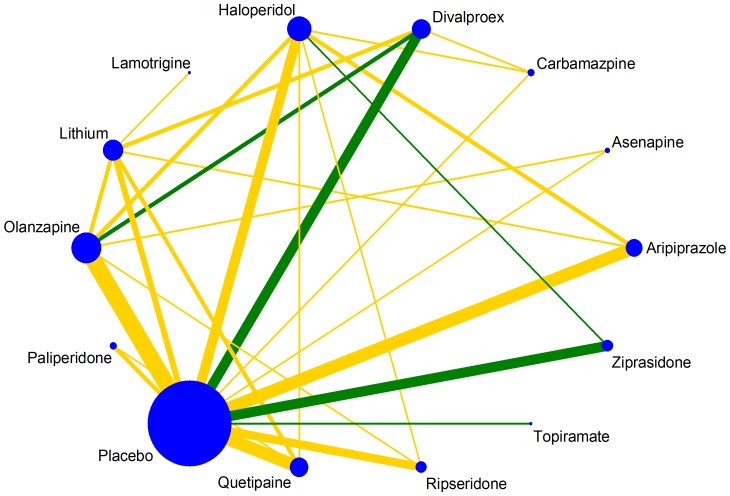

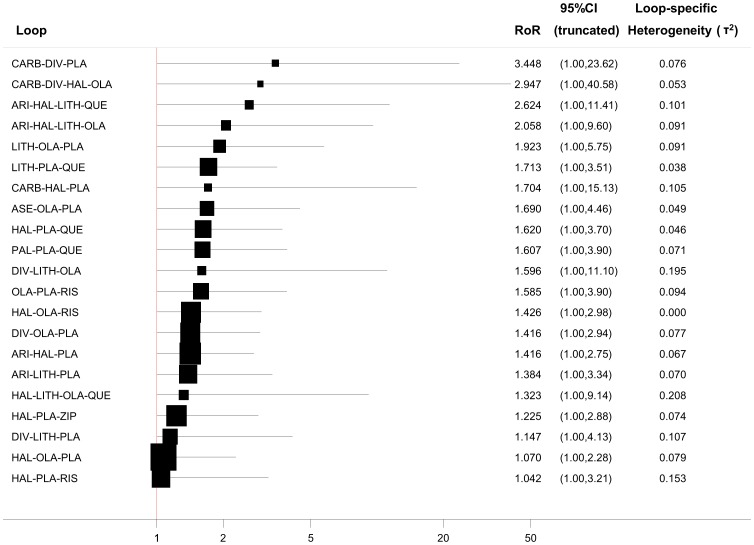


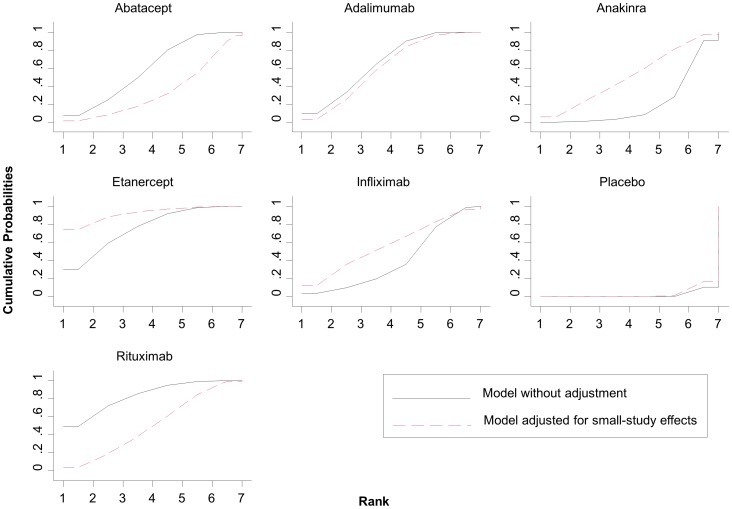


Verification
Claims the paper makes
The claims and statistics of this paper haven’t been checked yet.
Free: it reads the open-access text and checks the first 5 claims that cite a source we can check. Create a free account to check every claim.
Claims other papers make about this one
Each is checked against this paper’s own text: does it say what the citing paper says it does?
The source backs part of the claim, not all of it — or backs it for a different population, condition or comparison.
In the citing paper
“We used comparisonadjusted funnel plots to assess publi cation bias.23”
From Comparative efficacy and acceptability of antidepressants, psychotherapies, and their combination for acute treatment of children and adolescents with depressive disorder: a systematic review and network meta-analysis (2020) · cites this paper as [23]
Experimental — accuracy not yet measuredThe source backs part of the claim, not all of it — or backs it for a different population, condition or comparison.
In the citing paper
“The statistical examination of the transitivity assumption was conducted using tests of local and global inconsistency 20 .”
From Psychotherapies for depression: a network meta-analysis covering efficacy, acceptability and long-term outcomes of all main treatment types (2021) · cites this paper as [20]
Experimental — accuracy not yet measuredThe source backs part of the claim, not all of it — or backs it for a different population, condition or comparison.
In the citing paper
“Small-study effects and potential publication bias were investigated by visual inspection of contour-enhanced, comparison-adjusted funnel plots, and an Egger's test.[26][27][28]”
From Comparative efficacy and tolerability of pharmacological interventions for acute bipolar depression in adults: a systematic review and network meta-analysis (2023) · cites this paper as [27]
Experimental — accuracy not yet measuredThe cited source says what the claim attributes to it.
In the citing paper
“We used comparison-adjusted funnel plots to investigate whether results in imprecise trials differ from those in more precise trials.17”
The cited source says what the claim attributes to it.
In the citing paper
“For each outcome with ≥10 studies, the comparison-adjusted funnel plot was used to assess small-study effects,17 where the overall treatment effect for each comparison was estimated under the fixed-effect meta-analysis model.”
2 more claims about this paper
Create a free account to see every claim other papers make about this one.
Self-check
Percentages, sums and reported differences re-computed from the paper’s own numbers.
The self-check needs the paper’s full text.
Citations
Cites
Bias in meta-analysis detected by a simple, graphical test
Egger, M., Smith, G. D., Schneider, M., & Minder, C. (1997) · BMJ · doi:10.1136/bmj.315.7109.629 · Cited by 56,722 · cited 1×
“It is the most common tool used to assess the presence of small-study effects in a meta-analysis [34].”
MethodMeta-analysis in clinical trials
DerSimonian, R., & Laird, N. (1986) · Controlled Clinical Trials · doi:10.1016/0197-2456(86)90046-2 · Cited by 39,552 · cited 1×
“Method of moments and restricted maximum likelihood are those most commonly used and have been implemented in STATA’s metan command along with an empirical Bayes method [32,33].”
MethodThe Handbook of Research Synthesis and Meta-Analysis
(2019) · doi:10.7758/9781610448864 · Cited by 4,553 · cited 1×
“freedom (in NMA we suggest this is set to number of studies – number of comparisons with data – 1 [41]) and m̂ is the metaanalysis summary effect.”
BackgroundSalanti, G., Ades, A. E., & Ioannidis, J. P. A. (2011) · Journal of Clinical Epidemiology · doi:10.1016/j.jclinepi.2010.03.016 · Cited by 3,766 · cited 4×
“So-called rankograms and cumulative ranking probability plots have been suggested as a reliable and comprehensive graphical way to present ranking probabilities and their uncertainty [2].”
BackgroundMethodInfluentialSelf-citationInterpretation of random effects meta-analyses
Riley, R. D., Higgins, J. P. T., & Deeks, J. J. (2011) · BMJ · doi:10.1136/bmj.d549 · Cited by 2,884 · cited 2×
“and predictive ranking probabilities (the probability that each treatment will be placed in each rank in a future study [39,40]) can be estimated with the suboption predict.”
BackgroundSelf-citationA Re-Evaluation of Random-Effects Meta-Analysis
Higgins, J. P. T., Thompson, S. G., & Spiegelhalter, D. J. (2009) · Journal of the Royal Statistical Society Series A: Statistics in Society · doi:10.1111/j.1467-985x.2008.00552.x · Cited by 2,569 · cited 2×
“and predictive ranking probabilities (the probability that each treatment will be placed in each rank in a future study [39,40]) can be estimated with the suboption predict.”
BackgroundSelf-citationChecking consistency in mixed treatment comparison meta-analysis
Dias, S., Welton, N. J., Caldwell, D. M., & Ades, A. E. (2010) · Statistics in Medicine · doi:10.1002/sim.3767 · Cited by 2,521 · cited 1×
“Several approaches have been developed to deal with inconsistency in a network of interventions [26–29].”
BackgroundCombination of direct and indirect evidence in mixed treatment comparisons
Lu, G., & Ades, A. E. (2004) · Statistics in Medicine · doi:10.1002/sim.1875 · Cited by 2,166 · cited 1×
“Thus, in the presence of multi-arm trials, researchers have often preferred to perform NMA in a Bayesian framework that offers more flexibility [21,22].”
BackgroundConsistency and inconsistency in network meta-analysis: concepts and models for multi-arm studies
Higgins, J. P. T., Jackson, D., Barrett, J. K., Lu, G., Ades, A. E., & White, I. R. (2012) · Research Synthesis Methods · doi:10.1002/jrsm.1044 · Cited by 2,098 · cited 1×
“recently described NMA as a multivariate meta-analysis model [23,24].”
MethodSelf-citationBucher, H. C., Guyatt, G. H., Griffith, L. E., & Walter, S. D. (1997) · Journal of Clinical Epidemiology · doi:10.1016/s0895-4356(97)00049-8 · Cited by 2,052 · cited 1×
“The integration of direct evidence (from studies directly comparing interventions) with indirect evidence (information about two treatments derived via a common comparator) increases the precision in the estimates and produces a relative ranking of all treatments for the studied outcome [1,2].”
Background
Cited by
Items 801–900 of 1,012
Prat, L. I., Wilson, P., Freeman, S. C., Sutton, A. J., Cooper, N. J., Roccarina, D., Benmassaoud, A., Torres, M. C. P., Hawkins, N., Cowlin, M., et al. (2019) · Cochrane Database of Systematic Reviews · doi:10.1002/14651858.cd013120.pub2 · Cited by 29
“In addition, we will use design-by-treatment full interaction model and inconsistency factor (IF) plots to assess inconsistency (Higgins 2012; Chaimani 2013).”
MethodInfluentialEffect of Dipeptidyl Peptidase-4 Inhibitors on Heart Failure: A Network Meta-Analysis
Guo, W., Li, L., Su, Q., Dai, W., & Ye, Z. (2017) · Value in Health · doi:10.1016/j.jval.2017.04.010 · Cited by 29
“Additionally, we created a comparison-adjusted funnel plot to detect the presence of any publication bias [13,15].”
BackgroundMethodAn, R., Wang, D., Liang, X.-L., Chen, Q., Pang, Q., & Liu, H. (2023) · Frontiers in Oncology · doi:10.3389/fonc.2023.1083000 · Cited by 29
“We estimated the ranking probabilities for each intervention for all treatments (31).”
Yu, Q., Kong, Z., Zou, L., Chapman, R. F., Shi, Q., & Nie, J. (2023) · Journal of Exercise Science & Fitness · doi:10.1016/j.jesf.2023.09.001 · Cited by 29
Yoosuf, B. T., Panda, A. K., Muhammed Favas, K. T., Bharti, S. K., Devana, S. K., & Bansal, D. (2024) · Scientific Reports · doi:10.1038/s41598-024-61977-5 · Cited by 29
“The comparison-adjusted funnel plot was utilized to evaluate small-study effects for each outcome with ≥ 10 studies, where the overall treatment effect for every comparison was estimated employing random-effect meta-analysis model 24 .”
MethodYang, Z.-S., Lai, H., Jhou, H., Chan, W.-H., & Chen, P. (2024) · Journal of Clinical Anesthesia · doi:10.1016/j.jclinane.2024.111657 · Cited by 26
Zhao, X., Liu, T., He, Y., Fang, W., Li, X., & Jiang, W. (2024) · BMJ Open · doi:10.1136/bmjopen-2024-086323 · Cited by 25
“27 Additionally, we will employ the node-splitting method 28 and heat maps to assess the local inconsistency of the model by separating evidence on particular comparisons into direct and indirect evidence.”
Turrini, G., Purgato, M., Cadorin, C., Bartucz, M. B., Cristofalo, D., Gastaldon, C., Nosè, M., Ostuzzi, G., Papola, D., Prina, E., et al. (2024) · The Lancet Regional Health - Europe · doi:10.1016/j.lanepe.2024.101152 · Cited by 39
“…within each closed loop of nodes, 43,44 and comparing the goodness of fi t for a NMA model that assumes consistency with a model that allows for incoherence in a “ design by treatment interaction model ” framework, 45 – 47 using the Stata commands mvmeta 48 and ifplot 49 in the Stata network suite.”
Hopkin, G., Au, A., Collier, V. J., Yudkin, J. S., Basu, S., & Naci, H. (2019) · Medical Decision Making · doi:10.1177/0272989x19835239 · Cited by 26
Xu, F., & Sun, W. (2019) · Frontiers in Pharmacology · doi:10.3389/fphar.2019.00795 · Cited by 25
“2 (StataCorp, College Station, TX, USA) (Chaimani et al., 2013).”
BackgroundInfluentialMigliorini, F., Eschweiler, J., Trivellas, A., Rath, B., Driessen, A., Tingart, M., & Arentini, P. (2020) · Archives of Orthopaedic and Trauma Surgery · doi:10.1007/s00402-020-03448-w · Cited by 25
Chang, Y.-L., Tung, Y., Tu, Y., Yeh, H., Yang, J., Hsu, P., Kim, S.-E., Wu, M., Liou, W., & Shiu, S. (2020) · BMJ Open Gastroenterology · doi:10.1136/bmjgast-2020-000472 · Cited by 32
“22 Comparison-adjusted funnel plots 23 and Egger’s tests were used to examine potential small-study bias after treatments were ordered from the oldest to the newest.”
Chatzakis, C., Sotiriadis, A., Tsakmaki, E., Papagianni, M., Paltoglou, G., Dinas, K. D., & Mastorakos, G. P. (2021) · Nutrients · doi:10.3390/nu13072284 · Cited by 31
“Statistical agreement between two different sources of evidence is represented by values close to those shown in [18].”
BackgroundMethodInfluentialDhippayom, T., Boonpattharatthiti, K., Thammathuros, T., Dilokthornsakul, P., Sakunrag, I., & Devine, B. (2021) · Thrombosis and Haemostasis · doi:10.1055/a-1677-9608 · Cited by 28
“SUCRA values range from 0 to 100%, the larger the SUCRA value, the better the rank of the treatment.(19) We considered a p-value of <0.”
BackgroundLiang, J., Hu, F., Tang, H., Jiang, F.-H., Sang, Y., Hong, Y., Wang, Q., Nuer, K., & Kang, X. (2022) · Journal of the European Academy of Dermatology and Venereology · doi:10.1111/jdv.18688 · Cited by 30
Wydall, S., Žolger, D., Owolabi, A. A., Nzekwu, B., Onwochei, D. N., & Desai, N. (2023) · Canadian Journal of Anesthesia/Journal canadien d anesthésie · doi:10.1007/s12630-022-02389-9 · Cited by 25
“Network meta-analysis with a common heterogeneity parameter and frequentist and multivariate methods was conducted for an outcome if the direct comparisons between trials of three or more interventions could be linked into a network.(29,30) Empirical and simulation studies suggest no important differences in the perfo…”
MethodYang, X., Liao, T., Wang, Y., Ren, L., & Zeng, J. (2024) · Clinical Psychology Review · doi:10.1016/j.cpr.2024.102501 · Cited by 33
Xiao, J., Wu, W.-X., Ye, Y., Lin, W., & Wang, L. (2015) · American Journal of Therapeutics · doi:10.1097/mjt.0000000000000242 · Cited by 27
“The synthesis of indirect evidence (information about 2 intervention obtained from a common comparator) and direct evidence (studies comparing the interventions directly) enhances the precision in evaluation and produces a relative ranking of all the treatments for the studied outcome.(34) In each closed loop, we use…”
MethodMcClurg, D., Pollock, A., Campbell, P., Hazelton, C., Elders, A., Hagen, S., & Hill, D. C. (2016) · Cochrane Database of Systematic Reviews · doi:10.1002/14651858.cd012337 · Cited by 34
Pharmacological interventions for acute hepatitis B infection
Mantzoukis, K., Rodríguez‐Perálvarez, M., Buzzetti, E., Thorburn, D., Davidson, B. R., Tsochatzis, E. A., & Gurusamy, K. S. (2017) · Cochrane Database of Systematic Reviews · doi:10.1002/14651858.cd011645.pub2 · Cited by 32
Arai, Y., Jo, T., Matsui, H., Kondo, T., & Takaori‐Kondo, A. (2017) · Haematologica · doi:10.3324/haematol.2017.174615 · Cited by 28
Ciliberto, D., Staropoli, N., Caglioti, F., Chiellino, S., Ierardi, A., Ingargiola, R., Botta, C., Arbitrio, M., Correale, P., Tassone, P., et al. (2018) · Critical Reviews in Oncology/Hematology · doi:10.1016/j.critrevonc.2018.03.003 · Cited by 28
Qian, D., Zhang, T., Tan, X., Zheng, P., Liang, Z., Xie, J., Jiang, J., & Situ, B. (2018) · PLoS ONE · doi:10.1371/journal.pone.0202563 · Cited by 29
“The small-study effects of active treatments versus placebo were assessed using comparison-adjusted funnel plots [23].”
MethodFour reconstruction methods after laparoscopic distal gastrectomy
Ma, Y., Li, F., Zhou, X., Wang, B., Lu, S., Wang, W., Yu, S., & Fu, W. (2019) · Medicine · doi:10.1097/md.0000000000018381 · Cited by 25
Vors, C., Allaire, J., Mejía, S. B., Khan, T. A., Sievenpiper, J. L., & Lamarche, B. (2020) · Advances in Nutrition · doi:10.1093/advances/nmaa086 · Cited by 29
“Data for the network meta-analysis were managed and analyzed with the use of STATA/SE version 13 (StataCorp).”
MethodInfluentialCao, G., Wu, X., Wang, Z., Tian, X., Zhang, C., Wu, X., Zhang, H., Jing, G., & Yan, T. (2020) · BMJ Open · doi:10.1136/bmjopen-2019-034626 · Cited by 27
Bae, J. (2014) · Epidemiology and Health · doi:10.4178/epih/e2014019 · Cited by 32
Martínez-Vizcaíno, V., Amaro-Gahete, F. J., Fernández-Rodríguez, R., Garrido-Miguel, M., Cavero-Redondo, I., & Pozuelo-Carrascosa, D. P. (2022) · Sports Medicine · doi:10.1007/s40279-021-01607-6 · Cited by 24
“, type of exercises or pharmacological interventions) was the most effective [39].”
BackgroundSoe, K. K., Krikeerati, T., Pheerapanyawaranun, C., Niyomnaitham, S., Phinyo, P., & Thongngarm, T. (2023) · Frontiers in Pharmacology · doi:10.3389/fphar.2023.1184552 · Cited by 28
“A hierarchical clustering analysis was conducted using twodimensional plots to group treatments according to their underlying SUCRA on efficacy and acceptability (Chaimani et al., 2013).”
MethodZhu, J., Yuan, K., Rana, S., Jakki, S. L., Bhat, A., Liang, L., & Wang, C. (2024) · Scientific Reports · doi:10.1038/s41598-024-58616-4 · Cited by 24
“As the SUCRA value became larger, the treatment demonstrated better efficacy 27 .”
MethodEfficacy of topical agents in oral mucositis prevention: Systematic review and network meta‐analysis
Coppini, M., Caponio, V. C. A., Mauceri, R., Bizzoca, M. E., Laino, L., Lorenzo‐Pouso, A. I., Russo, D., Troiano, G., Silva, F. F. V. E., Muzio, L. L., et al. (2024) · Oral Diseases · doi:10.1111/odi.15046 · Cited by 26
Dang, C., Wang, Q., Zhuang, Y., Li, Q., Feng, L., Xiong, Y., & Lu, Y. (2024) · Frontiers in Pharmacology · doi:10.3389/fphar.2024.1451032 · Cited by 34
Wang, H., Xin, X., & Pan, Y. (2025) · BMC Public Health · doi:10.1186/s12889-025-22570-1 · Cited by 31
“The consistency of each loop was evaluated by calculating the inconsistency factor and its 95% CI[23].”
Thakur, E. R., Khasawneh, M., Moayyedi, P., Black, C. J., & Ford, A. C. (2025) · The Lancet. Gastroenterology & hepatology · doi:10.1016/s2468-1253(25)00238-9 · Cited by 27
Liu, J., Fan, M., Zhao, J., Zhao, B.-C., Zhang, C., Liu, C., & Dong, Y. (2015) · International Journal of Cardiology · doi:10.1016/j.ijcard.2015.12.005 · Cited by 24
Wade, R., Rice, S. J. C., Llewellyn, A., Moloney, E., Jones-Diette, J. S., Stoniute, J., Wright, K. E., Layton, A., Levell, N. J., Stansby, G. P., et al. (2017) · Health Technology Assessment · doi:10.3310/hta21800 · Cited by 27
“Graph produced using published Stata code.(347) Fraction, fractionated microneedle radiofrequency.”
MethodLiu, T., He, Z., Dang, J., & Li, G. (2019) · Radiation Oncology · doi:10.1186/s13014-019-1239-7 · Cited by 24
“To rank probabilities of all available treatments, the surfaces under the cumulative ranking curve (SUCRAs) were calculated [24].”
Emara, R., Krois, J., & Schwendicke, F. (2020) · Journal of Dentistry · doi:10.1016/j.jdent.2020.103330 · Cited by 27
Kim, Y. J., Hwang, S. D., & Lim, S. K. (2020) · Frontiers in Endocrinology · doi:10.3389/fendo.2020.00553 · Cited by 24
Daly, C., Mbuagbaw, L. C. E., Thabane, L., Straus, S. E., & Hamid, J. S. (2020) · BMC Medical Research Methodology · doi:10.1186/s12874-020-01128-2 · Cited by 25
Yu, H., Li, X., Chen, S., Zhang, L., Yang, G., Welle, K., Gathen, M., & Kabir, K. (2021) · Journal of Investigative Surgery · doi:10.1080/08941939.2020.1871535 · Cited by 24
“The treatment rankings and SUCRA values were measured.”
MethodInfluentialChiu, Y., Chang, K. C., Wu, W., Hsu, P., & Özçakar, L. (2021) · Pharmaceuticals · doi:10.3390/ph14080788 · Cited by 25
“The 95% CI of the inconsistency factor was employed to determine the existence of inconsistency in certain loops [18].”
BackgroundMethodRajadurai, S. G., Maharajan, M. K., Veettil, S. K., & Gopinath, D. (2021) · Journal of Fungi · doi:10.3390/jof7080637 · Cited by 28
“Publication bias was examined with a comparisonadjusted funnel plot [33].”
MethodZhang, L., Wang, J., & Wang, C. (2021) · Developmental Medicine & Child Neurology · doi:10.1111/dmcn.15072 · Cited by 24
“The SUCRA values range from 0% (indicating no chance the treatment is the most efficacious) to 100% (indicating the treatment is certainly the most efficacious).(23,24) There is a lack of a concrete methodology of assessing acrossstudies bias (publication bias) in network meta-analysis, thus the comparison-adjusted fu…”
MethodZhang, L., Qi, H., Xie, Y., Zheng, W., Liu, X., Cai, D.-B., Ng, C. H., Ungvari, G. S., & Xiang, Y. (2021) · Frontiers in Psychiatry · doi:10.3389/fpsyt.2021.728204 · Cited by 28
“RCTs with multiple arms were split into several two-arms trials when inputting into Stata (29) (e.g., a RCT with three treatment arms was split into three two-arm studies); therefore, the total number of studies and the overall sample size in Stata (n = 87, sample size = 6,567) were more than in WinBUGS (n = 62, sampl…”
MethodBacterial phospholipases C with dual activity: phosphatidylcholinesterase and sphingomyelinase
Monturiol‐Gross, L., Villalta-Romero, F., Flores-Dı́az, M., & Alape‐Girón, A. (2021) · FEBS Open Bio · doi:10.1002/2211-5463.13320 · Cited by 24
Chang, P., Chen, K.-H., Jhou, H., Lee, C., Chou, S., Chen, P., & Chang, T. (2022) · Journal of Personalized Medicine · doi:10.3390/jpm12040512 · Cited by 28
“Comparison-adjusted funnel plots were created, and Egger’s test was applied to evaluate small study effects and publication biases [40,50].”
MethodChao, Y.-C., Chen, P., Su, W., Yeh, H.-W., Su, C.-C., Wu, Y., Chiang, H.-S., Jhou, H., & Shieh, Y. (2022) · Journal of Dental Sciences · doi:10.1016/j.jds.2022.05.013 · Cited by 27
“Comparison-adjusted funnel plots were constructed, and Egger’s test was applied to evaluate publication biases and small study effects.(33) All network meta-analyses were performed using the statistical package Netmeta (Version 1.”
MethodFang, Y., Yue, B.-W., Ma, H., & Yuan, Y.-P. (2022) · Medicine · doi:10.1097/md.0000000000029310 · Cited by 25
“The rank of effect estimation for each treatment was investigated using the surface under the cumulative rank curve of the P rank score of STATA.”
MethodInfluentialYunusa, I. U., Rashid, N., Seyedin, R., Paratane, D., & Rajagopalan, K. (2023) · Journal of Geriatric Psychiatry and Neurology · doi:10.1177/08919887231154933 · Cited by 28
“Finally, we created cluster ranking plots using the SUCRA values to simultaneously compare AAPs based on efficacy, safety, and acceptability outcomes.(48) A cluster ranking analysis is a technique used for categorizing groups based on their characteristics in such a way that the degree of association is high between m…”
MethodGiri, S., Jearth, V., Seth, V., Darak, H., & Sundaram, S. (2023) · Clinical and Experimental Hepatology · doi:10.5114/ceh.2023.126077 · Cited by 26
“Inconsistency plots were created for the assessment of agreement of direct and indirect evidence [20].”
Sud, S., Fan, E., Adhikari, N. K. J., Friedrich, J. O., Ferguson, N. D., Combes, A., Guérin, C., & Guyatt, G. H. (2024) · Intensive Care Medicine · doi:10.1007/s00134-024-07492-7 · Cited by 28
“We measured between-study heterogeneity using I 2 and visually assessed for publication bias using a funnel plot [40, 41].”
Network Meta-Analysis for Complex Social Interventions: Problems and Potential
Grant, E. S., & Calderbank-Batista, T. (2013) · Journal of the Society for Social Work and Research · doi:10.5243/jsswr.2013.25 · Cited by 24
Interventions for hereditary haemochromatosis
Buzzetti, E., Kalafateli, M., Thorburn, D., Davidson, B. R., Tsochatzis, E. A., & Gurusamy, K. S. (2017) · Cochrane Database of Systematic Reviews · doi:10.1002/14651858.cd011647.pub2 · Cited by 30
Chen, X., Huang, T., Cao, X., & Xu, G. (2017) · American Journal of Cardiovascular Drugs · doi:10.1007/s40256-017-0245-0 · Cited by 28
“Additionally, we used SUCRA probabilities to rank the pharmacologic strategies [17].”
Veettil, S. K., Jinatongthai, P., Nathisuwan, S., Teerawattanapong, N., Ching, S. M., Lim, K. G., Saokaew, S., Phisalprapa, P., Reid, C. M., & Chaiyakunapruk, N. (2018) · Clinical Epidemiology · doi:10.2147/clep.s174120 · Cited by 26
“Publication bias was examined with a comparison-adjusted funnel plot.(48) For statistical analysis, we used Stata version 14.”
MethodInduction immunosuppression in adults undergoing liver transplantation: a network meta-analysis
Best, L. M., Leung, J., Freeman, S. C., Sutton, A. J., Cooper, N. J., Milne, E., Cowlin, M., Payne, A., Walshaw, D., Thorburn, D., et al. (2020) · Cochrane Database of Systematic Reviews · doi:10.1002/14651858.cd013203.pub2 · Cited by 32
“In addition, we used design-bytreatment full interaction model and inconsistency factor (IF) plots to assess inconsistency when applicable (Higgins 2012; Chaimani 2013).”
MethodInfluentialYu, Y.-T., Deng, J., Jin, X.-R., Zhang, Z.-Z., Zhang, X., & Zhou, X. (2020) · Medicine · doi:10.1097/md.0000000000019661 · Cited by 24
“Network meta-analysis compares multiple treatments simultaneously by combining direct and indirect evidence of the relative treatment effects.([20]) We used inconsistency factors (IFs) to estimate heterogeneity in each closed loop, and a 95% CI (IF) value of zero indicated the absence of statistical significance.”
MethodMavridis, D., Efthimiou, O., Leucht, S., & Salanti, G. (2015) · Journal of Clinical Epidemiology · doi:10.1016/j.jclinepi.2015.05.027 · Cited by 27
“As there is often a dilemma in choosing between analyzing all trials or a subset that is believed to be less prone to bias, the methods used provide a compromise where all trials are used but the results are adjusted for SSEs or PB.”
BackgroundMethodSelf-citationSchwingshackl, L., Chaimani, A., Bechthold, A., Iqbal, K., Stelmach-Mardas, M., Hoffmann, G., Schwedhelm, C., Schlesinger, S., & Boeing, H. (2016) · Systematic Reviews · doi:10.1186/s13643-016-0302-9 · Cited by 23
Self-citationFurukawa, T. A., Miura, T., Chaimani, A., Leucht, S., Cipriani, A., Noma, H., Mitsuyasu, H., Kanba, S., & Salanti, G. (2016) · BMC Research Notes · doi:10.1186/s13104-016-2019-1 · Cited by 23
“With netweight, a command for NMA in STATA [8], we can obtain the contribution matrix showing contributions from each direct comparison to the network estimates even in a large network like our example, and then we can calculate the composition of each level of risk of bias in network estimates quantitatively.”
BackgroundMethodSelf-citationThe treatment modalities of masticatory muscle pain a network meta-analysis
Feng, J., Luo, M., Ma, J., Tian, Y., Han, X., & Bai, D. (2019) · Medicine · doi:10.1097/md.0000000000017934 · Cited by 23
“Considering that study size would influence the credibility of comparative results, funnel plot was drawn to show if any smallstudy effects existed between direct comparions.([22,29]) Smallstudy effect was deemed insignificant if the dots were on the zero line or symmetrical to the zero line in the funnel plot.”
BackgroundMethodInfluentialLong, Y., Zhou, Z.-F., Zhou, S., & Zhang, G. (2024) · International Journal of Nursing Studies · doi:10.1016/j.ijnurstu.2024.104904 · Cited by 32
Pharmacologic Management of Acute Pain in Children: A Systematic Review and Network Meta-Analysis
Olejnik, L. J., Lima, J. P., Sadeghirad, B., Busse, J. W., Flórez, I. D., Ali, S., Bunker, J., Jomaa, D., Bleik, A., & Eltorki, M. (2025) · Archives of Pediatrics and Adolescent Medicine · doi:10.1001/jamapediatrics.2024.5920 · Cited by 27
Atypical antipsychotics for autism spectrum disorder: a network meta-analysis
Meza, N., Franco, J. V. A., Sguassero, Y., Núñez, V., Liquitay, C. M. E., Rees, R., Williams, K. J., Rojas, V., Rojas, F., Pringsheim, T. M., et al. (2025) · Cochrane Database of Systematic Reviews · doi:10.1002/14651858.cd014965.pub2 · Cited by 41
Desborough, M., Hadjinicolaou, A. V., Chaimani, A., Trivella, M., Vyas, P., Doree, C. J., Hopewell, S., Stanworth, S. J., & Estcourt, L. J. (2016) · Cochrane Database of Systematic Reviews · doi:10.1002/14651858.cd012055.pub2 · Cited by 23
Self-citationZhong, X.-L., Dong, Y., Xu, W., Huang, Y., Wang, H.-F., Zhang, T., Sun, L. J., Tan, L., Dong, Q., & Yu, J. (2021) · Journal of Stroke · doi:10.5853/jos.2020.02698 · Cited by 27
“6) 16,602 (100) NA 3,239 (20) 0 NA 0 3 150.”
Park, S.-K., Lim, T., Cho, H.-Y., Yoon, H., Lee, H., Lee, J., Yoo, S., Kim, J., & Kim, W. H. (2021) · Scientific Reports · doi:10.1038/s41598-021-91314-z · Cited by 26
Effect of Exercise on Motor Symptoms in Patients With Parkinson's Disease: A Network Meta-analysis
Álvarez‐Bueno, C., Deeks, J. J., Cavero‐Redondo, I., Jolly, K. B., Torres-Costoso, A. I., Price, M. J., Fernández‐Rodríguez, R., & Martínez‐Vizcaíno, V. (2021) · Journal of Geriatric Physical Therapy · doi:10.1519/jpt.0000000000000322 · Cited by 28
Zhuo, Y., Xu, M., Shifeng, D., Zhang, Y., Lu, X., Wu, B., & Zhang, H. (2021) · Annals of Palliative Medicine · doi:10.21037/apm-21-1127 · Cited by 25
“In our study, a higher SUCRA score represented the better intervention timepoint for acupuncture in stroke (29).”
BackgroundXu, Z., Sun, W. J., Zhang, D., Chung, V. C., & Wong, S. Y. S. (2021) · Aging & Mental Health · doi:10.1080/13607863.2021.1998356 · Cited by 26
“Publication bias was examined via detecting the visual asymmetry of the funnel plot (Chaimani et al., 2013).”
MethodJongkhajornpong, P., Anothaisintawee, T., Lekhanont, K., Numthavaj, P., McKay, G. J., Attia, J., & Thakkinstian, A. (2021) · Cornea · doi:10.1097/ico.0000000000002943 · Cited by 23
Charitakis, E., Metelli, S., Karlsson, L., Antoniadis, A. P., Rizas, K. D., Liuba, I., Almroth, H., Jönsson, A. H., Schwieler, J. H., Tsartsalis, D., et al. (2022) · BMC Medicine · doi:10.1186/s12916-022-02385-2 · Cited by 27
“evaluate the presence of small-study effects [5, 21], namely whether results in imprecise studies differ from those in more precise studies.”
ResultSelf-citationXiong, Y., Wang, Q., Liu, Y., Wei, J., & Chen, X. (2022) · Frontiers in Pharmacology · doi:10.3389/fphar.2022.1023660 · Cited by 26
“In our analysis, global inconsistency was evaluated by the design-bytreatment interaction approach (Chaimani et al., 2013).”
MethodYan, R., Cai, H., Cui, Y., Su, D., Cai, G., Lin, F., & Feng, T. (2022) · European Journal of Neurology · doi:10.1111/ene.15651 · Cited by 23
Szapáry, L. B., Tornyos, D., Kupó, P., Lukács, R., Abdallaoui, O. E. A. E., & Komócsi, A. (2022) · Frontiers in Cardiovascular Medicine · doi:10.3389/fcvm.2022.1036609 · Cited by 24
“To assess publication bias, a comparison-adjusted funnel plot, (an extension of the common funnel plot in cases of multiple treatment comparisons) was used displaying Eggers’ test results in support (16).”
MethodWang, X., Shi, X., Lv, J., Zhang, J., Huo, Y., Zuo, G., Lu, G.-T., Liu, C., & She, Y.-F. (2022) · Frontiers in Psychiatry · doi:10.3389/fpsyt.2022.1067329 · Cited by 25
“0, which shows the SUCRA scores for all interventions, with higher SUCRA values denoting a higher treatment class (39).”
BackgroundPeng, Y., Zhao, Q., Liao, Z., Ma, Y., & Ma, D. (2023) · Cancer · doi:10.1002/cncr.34664 · Cited by 27
“network plots to illustrate the direct comparative and indirect comparative relationships of the treatment options included in the trials.(26) Paired meta‐analyses were performed for two and more head‐to‐head comparisons, applying I(2) 27 in visual forest plots to assess heterogeneity between studies, all of which wer…”
MethodLi, J., Shi, H., Zhou, F., Xie, L. H., & Lin, R. (2023) · Journal of Clinical Gastroenterology · doi:10.1097/mcg.0000000000001902 · Cited by 25
Management of frailty: a protocol of a network meta-analysis of randomized controlled trials
Negm, A. M., Kennedy, C. C., Thabane, L., Veroniki, A. A., Adachi, J. D., Richardson, J. A., Cameron, I. D., Giangregorio, A., & Παπαϊωάννου, Α. (2017) · Systematic Reviews · doi:10.1186/s13643-017-0522-7 · Cited by 28
“We will chronologically order the treatments (from the oldest to the newest) [50].”
MethodLopez-Olivo, M. A., Kakpovbia‐Eshareturi, V., Bordes, J. D., Barbo, A., Christensen, R., & Suarez-Almazor, M. E. (2018) · Arthritis Care & Research · doi:10.1002/acr.23474 · Cited by 24
“We used network meta-analysis to statistically infer from combined direct and indirect evidence (23), using Stata, version 14.”
MethodMapping the characteristics of network meta-analyses on drug therapy: A systematic review
Tonin, F. S., Steimbach, L. M., Mendes, A. M., Borba, H. H. L., Pontarolo, R., & Fernández-Llimós, F. (2018) · PLoS ONE · doi:10.1371/journal.pone.0196644 · Cited by 26
Noone, C., Dwyer, C. P., Murphy, J., Newell, J., & Molloy, G. J. (2018) · Systematic Reviews · doi:10.1186/s13643-018-0791-9 · Cited by 29
Qian, T., Zhao, M., Wan, Y., Li, M.-X., & Xu, X. (2018) · BMJ Open · doi:10.1136/bmjopen-2018-022700 · Cited by 23
Zhang, D., Wu, J., Duan, X., Wang, K., Ni, M., Liu, S., Zhang, X., Zhang, B., & Zhao, Y. (2019) · Integrative Cancer Therapies · doi:10.1177/1534735419827098 · Cited by 24
“ison-adjusted funnel plot was utilized to test for the potential publication bias.(25,26) Moreover, we adopted sur-”
MethodWu, Z., Zhang, X., Li, Z., Liu, Y., Jin, H., Chen, Q., & Guo, J. (2019) · Orthodontics and Craniofacial Research · doi:10.1111/ocr.12339 · Cited by 23
Hu, Z., Tang, Q., Sang, C.-M., Tang, L., Li, X., Zheng, G., Feng, Z., Xuan, J., Shen, Z.-H., Shen, L., et al. (2019) · BMJ Open · doi:10.1136/bmjopen-2018-024595 · Cited by 28
Ye, L., Jiaqi, Z., Jianchao, W., Zhaohui, F., Liang, Y., & Zhang, X. (2020) · Therapeutic Advances in Chronic Disease · doi:10.1177/2040622320953349 · Cited by 27
Han, B., Zhang, P., Zhao, H., Zhang, X., Gao, H., Dong, J., Zeng, L., Pi, P., & Pei, J. (2024) · Psycho-Oncology · doi:10.1002/pon.6370 · Cited by 25
“35 (5) Network funnel plots were visually inspected using symmetry criteria to check for publication bias in the NMA.”
Sunlakawit, C., Chaimanakarn, C., Srimaneekarn, N., & Osiri, S. (2024) · Journal of Endodontics · doi:10.1016/j.joen.2024.08.005 · Cited by 29
Li, J., Zhou, Z., Hao, S., & Zang, L. (2024) · European Journal of Applied Physiology · doi:10.1007/s00421-024-05688-9 · Cited by 29
“Inconsist-ency factors (IFs) with 95% CI were calculated to evaluate the consistency of each closed loop, and consistency was indicated by the lower limit of the 95% CI being equal to 0 (Chaimani et al. 2013).”
Kou, W., Li, S., Yan, R., Zhang, J., Wan, Z., & Feng, T. (2025) · Journal of Neurology · doi:10.1007/s00415-025-13051-x · Cited by 25
“9 and 10) [102].”
Veroniki, A. A., Straus, S. E., Ashoor, H. M., Hamid, J. S., Hemmelgarn, B. R., Holroyd-Leduc, J. M., Majumdar, S. R., McAuley, G., & Tricco, A. C. (2016) · BMJ Open · doi:10.1136/bmjopen-2015-010251 · Cited by 23
“We will draw a comparison-adjusted funnel plot 40 for both the MMSE and SAE.”
MethodNetwork meta-analysis in health psychology and behavioural medicine: a primer
Molloy, G. J., Noone, C., Caldwell, D. M., Welton, N. J., & Newell, J. (2018) · Health Psychology Review · doi:10.1080/17437199.2018.1457449 · Cited by 25
“There are packages available in Stata for conducting NMA within the frequentist framework, including mvmeta, network (White, 2009) and network graphs (Chaimani et al., 2013).”
MethodThom, H. H. Z., Ender, F., Samavedam, S., Vivez, C. P., Gupta, S., Dhariwal, M., de Haan, J., & O’Boyle, D. (2019) · PLoS ONE · doi:10.1371/journal.pone.0220498 · Cited by 26
“Integrating data from the evidence pool of a SLR on the effect of various IOL materials and design on PCO and the incidence of Nd:YAG capsulotomy was essential to understand the comparative effectiveness of treatments and relative ranking of different IOL materials [39].”
MethodWen, F., Du, H., Ding, L., Hu, J., Huang, Z., Huang, H., Li, K., Mo, Y., & Kuang, A. (2020) · PLoS ONE · doi:10.1371/journal.pone.0234123 · Cited by 25
Erre, G. L., Sebastiani, M., Fenu, M. A., Zinellu, A., Floris, A., Cavagna, L., Renzoni, E. A., Manfredi, A., Passiu, G., Woodman, R. J., et al. (2020) · Journal of Clinical Medicine · doi:10.3390/jcm9082560 · Cited by 25
“Loops in which the lower confidence interval limit of the IF reaches the zero line are considered to present no statistically significant inconsistency [20].”
BackgroundCho, Y., Choi, G. J., Ahn, E. J., & Kang, H. (2021) · PLoS ONE · doi:10.1371/journal.pone.0243865 · Cited by 31
“A random-effects NMA based on a frequentist framework was performed using STATA software (version 15; StataCorp LP, College Station, TX) based on mvmeta with NMA graphical tools developed by Chaimani and colleagues [26].”
BackgroundMethodSoftware to Conduct a Meta-Analysis and Network Meta-Analysis
Daly, C., & Soobiah, C. (2021) · Methods in molecular biology · doi:10.1007/978-1-0716-1566-9_14 · Cited by 26
Diet Therapeutics Interventions for Obesity: A Systematic Review and Network Meta-Analysis
Morsali, M., Poorolajal, J., Shahbazi, F., Vahidinia, A., & Doosti‐Irani, A. (2021) · Journal of Research in Health Sciences · doi:10.34172/jrhs.2021.63 · Cited by 23
Metadata
- Authors
- Chaimani, A., Higgins, J. P. T., Mavridis, D., Spyridonos, P., & Salanti, G.
- Affiliations
- University of Ioannina (GR)
- University of Bristol (GB)
- Corresponding author
- Salanti, Georgia
- Venue
- PLoS ONE
- Publisher
- Public Library of Science (PLoS)
- Published
- 2013-10-03
- Volume
- 8
- Issue
- 10
- Pages
- e76654
- ISSN
- 1932-6203 (ISSN-L)
- PMC
- PMC3789683
- OpenAlex
- W2091808438
- Semantic Scholar
- c99555607f865f8e0d32e5054195b29ccecc06cf
- Cited by
- 2,473
- References
- 51
- Citations by year
- 2026: 222 · 2025: 237 · 2024: 256 · 2023: 252 · 2022: 267 · 2021: 298 · 2020: 228 · 2019: 186 · 2018: 182 · 2017: 154 · 2016: 99 · 2015: 65 · 2014: 26 · 2013: 1
- FWCI
- 70.14
- Type
- journal article
- Language
- en
- Open access
- gold
- doi.org
- Locations
- PLoS ONE (publishedVersion, cc-by)
- Europe PMC (PubMed Central) (publishedVersion, cc-by)
- PubMed Central (publishedVersion, cc-by)
- PubMed (publishedVersion)
- RePEc: Research Papers in Economics (submittedVersion)
- DOAJ (DOAJ: Directory of Open Access Journals) (submittedVersion)
- Figshare (submittedVersion, cc-by)
- Bristol Research (University of Bristol) (submittedVersion)
- Funders
- FP7 Ideas: European Research Council (260559)
- Topics
- Social Sciences › Decision Sciences › Statistics, Probability and Uncertainty › Meta-analysis and systematic reviews
- Physical Sciences › Mathematics › Statistics and Probability › Statistical Methods in Clinical Trials
- Social Sciences › Sociology and Political Science › Delphi Technique in Research
- Keywords
- network meta-analysis, graphical tools, treatment ranking, non-statisticians
- MeSH terms
- Acute Disease, Arthritis, Rheumatoid, Bipolar Disorder, Data Interpretation, Statistical, Humans, Research Design, Meta-Analysis as Topic, Models, Statistical, Odds Ratio, Treatment Outcome, Antirheumatic Agents, Antimanic Agents
About these checks
Registry, retraction, Cites and statistics results are computed, not judged, with one exception: a printed reference that no index lists is read once by a model before it counts as a citation error. Claims are extracted by a model and kept only when their quote appears verbatim in the text; each cited source is then checked, with a model’s help, for whether it says what the claim relies on. Those verdicts can be wrong — read the claim’s quote and the cited source before relying on one.
Statistics and arithmetic are recomputed, not judged.
Confidence bands are shown only for fields calibrated on our annotated test set. None is calibrated yet, so no band is shown.
What counts as a claim ›How we measure confidence ›How we check this ›
Are you an author, or do you see a problem with this page? Request a review
Data sources
Bibliographic data: Semantic Scholar, OpenAlex, Crossref.
Contains information from the Semantic Scholar Academic Graph Datasets, made available under the ODC Attribution License (ODC-BY 1.0).
Semantic Scholar’s data is described in: Kinney, R., et al. (2023). The Semantic Scholar Open Data Platform. arXiv:2301.10140.
