

The DOI matches its Crossref record; 58 of the 58 references it cites were found in a registry or an index; none of the 57 sources its claims cite is checked for support yet.
Organizing Heterogeneous Samples Using Community Detection of GIMME-Derived Resting State Functional Networks
Open accessAbstract
Clinical investigations of many neuropsychiatric disorders rely on the assumption that diagnostic categories and typical control samples each have within-group homogeneity. However, research using human neuroimaging has revealed that much heterogeneity exists across individuals in both clinical and control samples. This reality necessitates that researchers identify and organize the potentially varied patterns of brain physiology. We introduce an analytical approach for arriving at subgroups of individuals based entirely on their brain physiology. The method begins with Group Iterative Multiple Model Estimation (GIMME) to assess individual directed functional connectivity maps. GIMME is one of the only methods to date that can recover both the direction and presence of directed functional connectivity maps in heterogeneous data, making it an ideal place to start since it addresses the problem of heterogeneity. Individuals are then grouped based on similarities in their connectivity patterns using a modularity approach for community detection. Monte Carlo simulations demonstrate that using GIMME in combination with the modularity algorithm works exceptionally well--on average over 97% of simulated individuals are placed in the accurate subgroup with no prior information on functional architecture or group identity. Having demonstrated reliability, we examine resting-state data of fronto-parietal regions drawn from a sample (N = 80) of typically developing and attention-deficit/hyperactivity disorder (ADHD) -diagnosed children. Here, we find 5 subgroups. Two subgroups were predominantly comprised of ADHD, suggesting that more than one biological marker exists that can be used to identify children with ADHD based from their brain physiology. Empirical evidence presented here supports notions that heterogeneity exists in brain physiology within ADHD and control samples. This type of information gained from the approach presented here can assist in better characterizing patients in terms of outcomes, optimal treatment strategies, potential gene-environment interactions, and the use of biological phenomenon to assist with mental health.
Overview
AI snapshot
Written from the paper’s full text.
TL;DR
The paper introduces a data-driven method that combines GIMME-derived individual directed functional connectivity maps with Newman modularity community detection to identify subgroups of individuals based on brain physiology alone. In simulations it recovered subgroups with high accuracy, and in resting-state fMRI from 80 children it found five subgroups, with two predominantly ADHD, supporting heterogeneity within ADHD and control samples.
Key findings
- In Monte Carlo simulations (100 individuals, 10 brain regions), GIMME recovered group-level connections for all 100 datasets and, on average, 99.73% (SD = 0.09%, range = 95–100%) of individual connections accurately in presence and direction.
- Community detection placed on average 97.23% (SD = 1.87%, range = 92–100%) of simulated individuals into the correct subgroup without prior group information.
- In the empirical sample of 80 children (32 ADHD, 48 typically developing controls), the method found 5 subgroups; ADHD and control participants were distributed across subgroups at greater than chance levels (χ² = 12.32, df = 4, p = .015), while sex distribution did not differ from chance (χ² = 3.65, df = 4, p = .456).
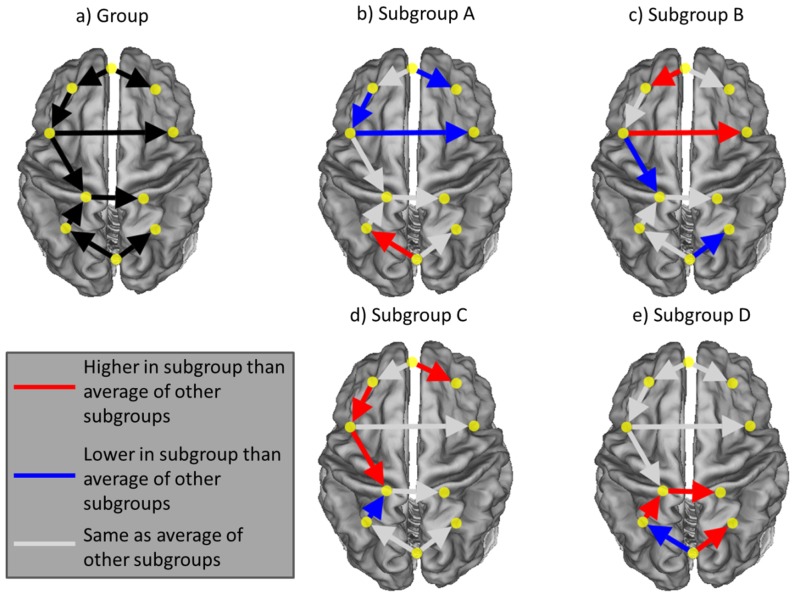
- Comparing ADHD and control as homogeneous diagnostic groups revealed no significant differences in path weights, but subgroup analyses showed different connectivity patterns: e.g., subgroup B had weaker L dlPFC→L IPS connectivity, while subgroup D had stronger L dlPFC→L IPS connectivity and decreased L FC→R FC connectivity.
Methods
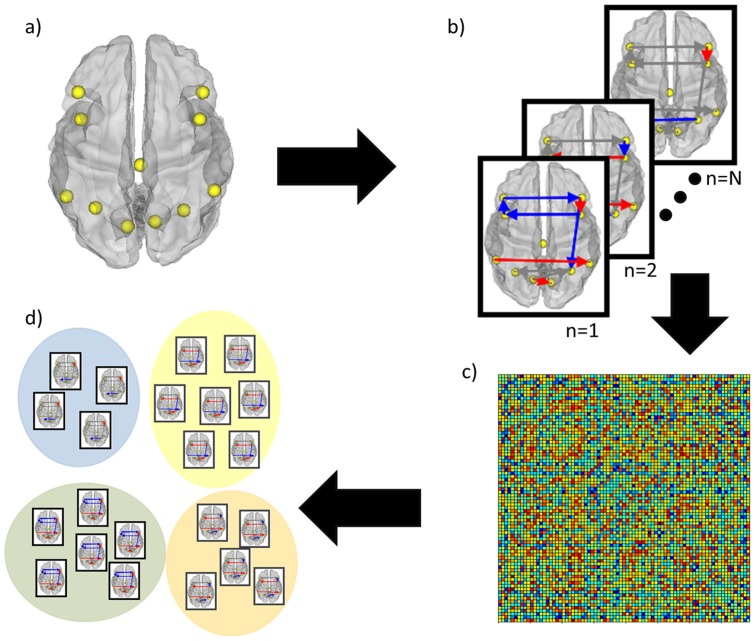
- Resting-state fMRI data were analyzed from simulated datasets and an empirical sample of 80 children aged 7–12; 11 fronto-parietal ROIs were selected, and individual directed functional connectivity maps were estimated with GIMME within a unified structural equation modeling framework.
- Each individual’s contemporaneous connection weights were vectorized, correlated with every other individual’s vector to form a similarity matrix, binarized at a data-driven threshold, and submitted to Newman’s modularity community detection algorithm.
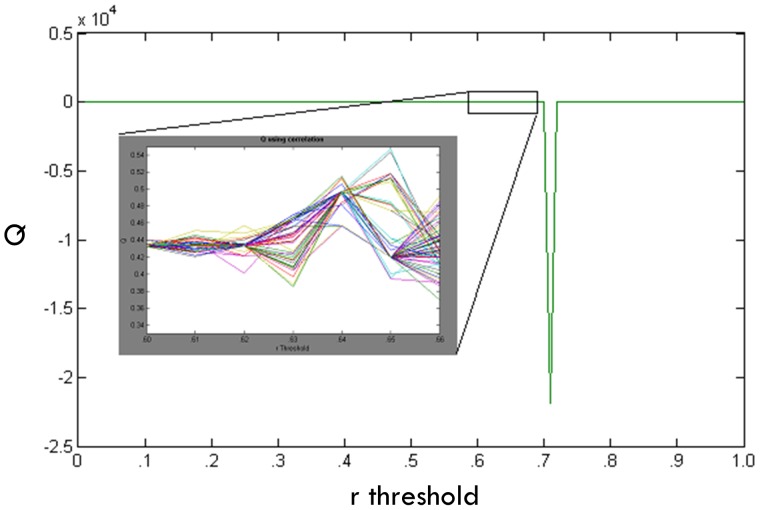
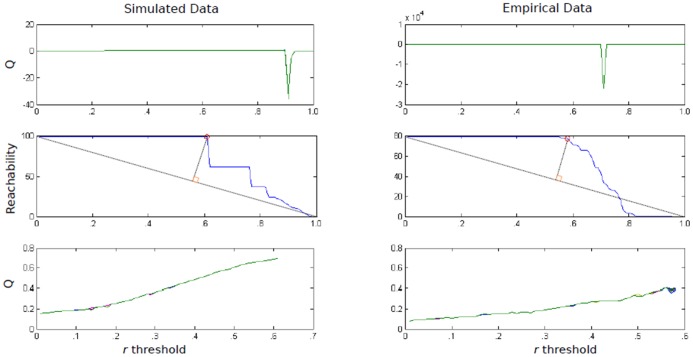
- Threshold selection used stability of the modularity index Q across 100 runs and a reachability criterion; robustness of community structure was tested via perturbation and variation of information, and subgroup connection weights were compared using ANOVA with FDR correction at alpha = 0.05.
Limitations
- The paper states that community detection algorithms have proliferated without formal comparison, that Newman’s algorithm is widely used but likely not optimal for all situations, and that many fMRI community detection approaches were tested on larger adjacency matrices and may not be optimal for smaller matrices where nodes are participants.
- The paper also states that similarity-matrix construction could vary with preprocessing choices such as global signal regression, that lagged paths could alternatively be used, and that individual-level paths were omitted because their heterogeneity produced groups too small to be useful; future work is needed for non-normally distributed data.
- Evident from the text: the empirical findings come from a modest cross-sectional sample (N = 80) with no independent replication or outcome/treatment validation, and the “protective” versus “risk” subgroup interpretations are proposed as hypotheses rather than confirmed clinical predictions.
Model-written summary. Check it against the paper before relying on it.
Integrity signals
Registry
Cites
Statistics
Figures
Verification
Claims the paper makes
38 Not checked yet · 36 Own result · 31 Own interpretation · 10 No basis given · 1 Own method
A result the paper reports from its own data — it cites no other source for it, so there is none to check. The quote shows it is in the paper.
In the paper
“Monte Carlo simulations demonstrate that using GIMME in combination with the modularity algorithm works exceptionally well - on average over 97% of simulated individuals are placed in the accurate subgroup with no prior information on functional architecture or group identity.”
- Also stated in: § Simulated data · boosted
“The community detection algorithm described above then identified the subgroups excellently: 97.23% (std. = 1.87%, range = 92–100%) of the individuals within each data set were placed in subgroups with those who shared their simulated brain map pattern.”
§ Organizing Heterogeneous Samples Using Community Detection of GIMME-Derived Resting State Functional Networks > Abstract
boosteddirect- Asserted: passes — The authors put it forward as true.
- Checkable: passes — It can be checked against evidence.
- Load-bearing: passes — The paper’s conclusions depend on it.
- Based: passes — The paper gives a reason why it holds.
- Also stated in: § Simulated data · boosted
A result the paper reports from its own data — it cites no other source for it, so there is none to check. The quote shows it is in the paper.
In the paper
“Having demonstrated reliability, we examine resting-state data of fronto-parietal regions drawn from a sample (N = 80) of typically developing and attention-deficit/hyperactivity disorder (ADHD) -diagnosed children. Here, we find 5 subgroups.”
§ Organizing Heterogeneous Samples Using Community Detection of GIMME-Derived Resting State Functional Networks > Abstract
plainn = 80- Asserted: passes — The authors put it forward as true.
- Checkable: passes — It can be checked against evidence.
- Load-bearing: passes — The paper’s conclusions depend on it.
- Based: passes — The paper gives a reason why it holds.
A result the paper reports from its own data — it cites no other source for it, so there is none to check. The quote shows it is in the paper.
In the paper
“Two subgroups were predominantly comprised of ADHD, suggesting that more than one biological marker exists that can be used to identify children with ADHD based from their brain physiology.”
§ Organizing Heterogeneous Samples Using Community Detection of GIMME-Derived Resting State Functional Networks > Abstract
plaincorrelationaln = 80- Asserted: passes — The authors put it forward as true.
- Checkable: passes — It can be checked against evidence.
- Load-bearing: passes — The paper’s conclusions depend on it.
- Based: passes — The paper gives a reason why it holds.
A result the paper reports from its own data — it cites no other source for it, so there is none to check. The quote shows it is in the paper.
In the paper
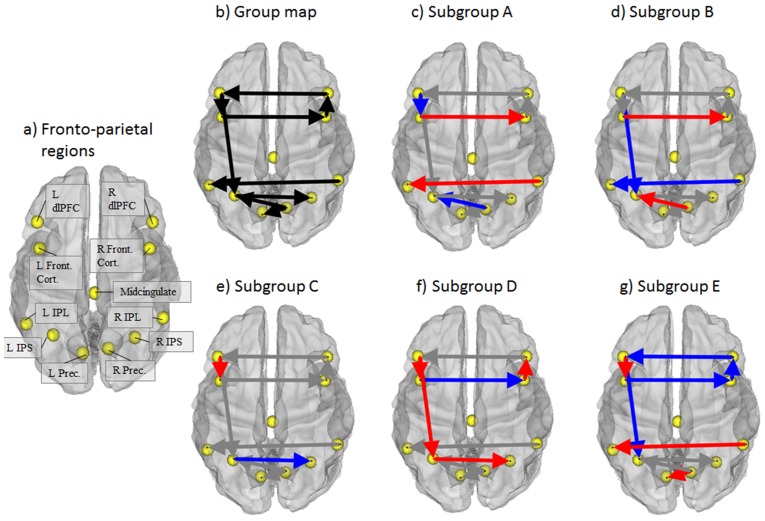
“Indeed, subgroup D (risk) appears to have decreased connectivity from the L FC to the R FC when compared to the average of the other groups”
§ Organizing Heterogeneous Samples Using Community Detection of GIMME-Derived Resting State Functional Networks > Results > Empirical data
hedged- Asserted: passes — The authors put it forward as true.
- Checkable: passes — It can be checked against evidence.
- Load-bearing: passes — The paper’s conclusions depend on it.
- Based: passes — The paper gives a reason why it holds.
The paper states this without a source or data behind it here, so there is nothing to check it against. The quote shows it is in the paper.
In the paper
“As depicted in Figure 2 and the top panel of Figure 3, the Q index becomes unstable at certain thresholds.”
§ Organizing Heterogeneous Samples Using Community Detection of GIMME-Derived Resting State Functional Networks > Methods > Subgrouping with community detection
plain- Asserted: passes — The authors put it forward as true.
- Checkable: passes — It can be checked against evidence.
- Load-bearing: passes — The paper’s conclusions depend on it.
- Based: passes — The paper gives a reason why it holds.
A result the paper reports from its own data — it cites no other source for it, so there is none to check. The quote shows it is in the paper.
In the paper
“The proportions of males and females in each of the subgroups were not different than what one would expect by chance (χ2 = 3.65, df = 4, p = .456).”
§ Organizing Heterogeneous Samples Using Community Detection of GIMME-Derived Resting State Functional Networks > Results > Empirical data
plain- Asserted: passes — The authors put it forward as true.
- Checkable: passes — It can be checked against evidence.
- Load-bearing: unclear — It is unclear whether the paper’s conclusions depend on it.
- Based: passes — The paper gives a reason why it holds.
A result the paper reports from its own data — it cites no other source for it, so there is none to check. The quote shows it is in the paper.
In the paper
“every potential connection between regions was found for at least one person”
§ Organizing Heterogeneous Samples Using Community Detection of GIMME-Derived Resting State Functional Networks > Results > Empirical data
plain- Asserted: passes — The authors put it forward as true.
- Checkable: passes — It can be checked against evidence.
- Load-bearing: passes — The paper’s conclusions depend on it.
- Based: passes — The paper gives a reason why it holds.
A result the paper reports from its own data — it cites no other source for it, so there is none to check. The quote shows it is in the paper.
In the paper
“For each threshold we see that the reachability drops prior to the Q index reaching maximum instability (Figure 3, middle panel).”
§ Organizing Heterogeneous Samples Using Community Detection of GIMME-Derived Resting State Functional Networks > Methods > Subgrouping with community detection
plaincorrelational- Asserted: passes — The authors put it forward as true.
- Checkable: passes — It can be checked against evidence.
- Load-bearing: passes — The paper’s conclusions depend on it.
- Based: passes — The paper gives a reason why it holds.
A result the paper reports from its own data — it cites no other source for it, so there is none to check. The quote shows it is in the paper.
In the paper
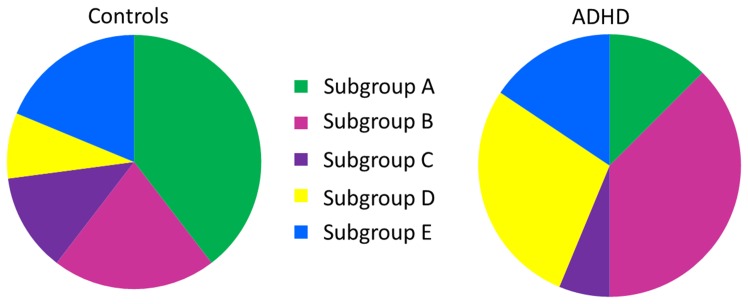
“ADHD and TDC participants, however, were placed in different subgroups at levels greater than chance (χ2 = 12.32, df = 4; p = .015; Figure 7).”
§ Organizing Heterogeneous Samples Using Community Detection of GIMME-Derived Resting State Functional Networks > Results > Empirical data
plaincorrelational- Asserted: passes — The authors put it forward as true.
- Checkable: passes — It can be checked against evidence.
- Load-bearing: passes — The paper’s conclusions depend on it.
- Based: passes — The paper gives a reason why it holds.
A result the paper reports from its own data — it cites no other source for it, so there is none to check. The quote shows it is in the paper.
In the paper
“ANOVA results consistently revealed significant differences in connection weights across the subgroups that corresponded with the patterns used to create the data that was consistent across the 100 simulated data sets (Figure 4b–e).”
§ Organizing Heterogeneous Samples Using Community Detection of GIMME-Derived Resting State Functional Networks > Results > Simulated data
plaincorrelational- Asserted: passes — The authors put it forward as true.
- Checkable: passes — It can be checked against evidence.
- Load-bearing: passes — The paper’s conclusions depend on it.
- Based: passes — The paper gives a reason why it holds.
- It may state two separate claims as one. 30
- The quote only partly states this claim. 1
- Probably not a substantial claim. 30
A result the paper reports from its own data — it cites no other source for it, so there is none to check. The quote shows it is in the paper.
In the paper
“The subgroups were consistently recovered in the simulated data and were robust to minor perturbations.”
§ Organizing Heterogeneous Samples Using Community Detection of GIMME-Derived Resting State Functional Networks > Results > Simulated data
plain- Asserted: passes — The authors put it forward as true.
- Checkable: passes — It can be checked against evidence.
- Load-bearing: passes — The paper’s conclusions depend on it.
- Based: passes — The paper gives a reason why it holds.
It may state two separate claims as one.
In the paper
“Importantly, subgroup B had lower directed connectivity strength from the left dorsolateral prefrontal cortex (L dlPFC) to the left intraparietal sulcus (L IPS), which is consistent with previous research on deficits in attention [44].”
§ Organizing Heterogeneous Samples Using Community Detection of GIMME-Derived Resting State Functional Networks > Results > Empirical data
What the sources say
- Not checked yetcites [44] C Liston, 2009, Psychosocial stress reversibly disrupts prefrontal processing and attentional control, Proceedings of the National Academy of Sciences of the United States of America source
plaincorrelational- Asserted: passes — The authors put it forward as true.
- Checkable: passes — It can be checked against evidence.
- Load-bearing: unclear — It is unclear whether the paper’s conclusions depend on it.
- Based: passes — The paper gives a reason why it holds.
It may state two separate claims as one.
A result the paper reports from its own data — it cites no other source for it, so there is none to check. The quote shows it is in the paper.
In the paper
“Subgroups B and D contain a high percentage of the ADHD children, who make up a large part of these subgroups.”
§ Organizing Heterogeneous Samples Using Community Detection of GIMME-Derived Resting State Functional Networks > Results > Empirical data
plaincorrelational- Asserted: passes — The authors put it forward as true.
- Checkable: passes — It can be checked against evidence.
- Load-bearing: passes — The paper’s conclusions depend on it.
- Based: passes — The paper gives a reason why it holds.
It may state two separate claims as one.
A result the paper reports from its own data — it cites no other source for it, so there is none to check. The quote shows it is in the paper.
In the paper
“The smaller subgroups C and E are disproportionately control, but contain relatively small percentages of the control sample.”
§ Organizing Heterogeneous Samples Using Community Detection of GIMME-Derived Resting State Functional Networks > Results > Empirical data
plaincorrelational- Asserted: passes — The authors put it forward as true.
- Checkable: passes — It can be checked against evidence.
- Load-bearing: unclear — It is unclear whether the paper’s conclusions depend on it.
- Based: passes — The paper gives a reason why it holds.
It may state two separate claims as one.
A result the paper reports from its own data — it cites no other source for it, so there is none to check. The quote shows it is in the paper.
In the paper
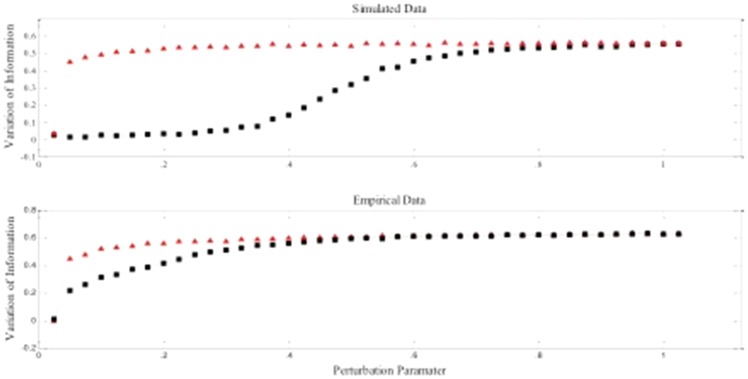
“The community assignments remain similar for the simulated individuals until a perturbation level of about .5 (i.e., random assignment of 50% of the edges), at which point 20% of the vertices are assigned different communities than the original and we see this variation of information increasing steadily past this point.”
§ Organizing Heterogeneous Samples Using Community Detection of GIMME-Derived Resting State Functional Networks > Results > Simulated data
plaindirect- Asserted: passes — The authors put it forward as true.
- Checkable: passes — It can be checked against evidence.
- Load-bearing: unclear — It is unclear whether the paper’s conclusions depend on it.
- Based: passes — The paper gives a reason why it holds.
It may state two separate claims as one.
A result the paper reports from its own data — it cites no other source for it, so there is none to check. The quote shows it is in the paper.
In the paper
“but like subgroup A had strong directed influence of the left frontal cortex (L FC) on the R FC.”
§ Organizing Heterogeneous Samples Using Community Detection of GIMME-Derived Resting State Functional Networks > Results > Empirical data
plaindirect- Asserted: passes — The authors put it forward as true.
- Checkable: passes — It can be checked against evidence.
- Load-bearing: unclear — It is unclear whether the paper’s conclusions depend on it.
- Based: passes — The paper gives a reason why it holds.
The quote only partly states this claim.
A result the paper reports from its own data — it cites no other source for it, so there is none to check. The quote shows it is in the paper.
In the paper
“The connectivity map depicted in Figure 5b provides the connectivity pattern of the fronto-parietal region set common for the majority of individuals in the whole sample (i.e. connections found to be significant for the majority, or the “group map”).”
§ Organizing Heterogeneous Samples Using Community Detection of GIMME-Derived Resting State Functional Networks > Results > Empirical data
plain- Asserted: passes — The authors put it forward as true.
- Checkable: passes — It can be checked against evidence.
- Load-bearing: fails — The paper’s conclusions may not depend on it.
- Based: passes — The paper gives a reason why it holds.
Probably not a substantial claim. The paper’s conclusions may not depend on it.
In the paper
“Regarding the robustness of the solution as quantified using VI, the curves for the empirical and random data remain distinct and thus the network of individuals can be said to show community structure (see Figure 6b; [24]).”
§ Organizing Heterogeneous Samples Using Community Detection of GIMME-Derived Resting State Functional Networks > Results > Empirical data
What the sources say
- Not checked yetcites [24] B Karrer, 2008, Robustness of community structure in networks, Physical Review E source
plaincorrelational- Asserted: passes — The authors put it forward as true.
- Checkable: passes — It can be checked against evidence.
- Load-bearing: passes — The paper’s conclusions depend on it.
- Based: passes — The paper gives a reason why it holds.
It may state two separate claims as one.
A result the paper reports from its own data — it cites no other source for it, so there is none to check. The quote shows it is in the paper.
In the paper
“However, the other ADHD-dominant subgroup had increased connectivity between these two regions but had decreased connectivity between the right and left frontal cortex.”
§ Organizing Heterogeneous Samples Using Community Detection of GIMME-Derived Resting State Functional Networks > Discussion
plaincorrelational- Asserted: passes — The authors put it forward as true.
- Checkable: passes — It can be checked against evidence.
- Load-bearing: passes — The paper’s conclusions depend on it.
- Based: passes — The paper gives a reason why it holds.
It may state two separate claims as one.
A result the paper reports from its own data — it cites no other source for it, so there is none to check. The quote shows it is in the paper.
In the paper
“Additionally, the high degree of heterogeneity with regards to the individual-level paths necessitated that we omit these when creating the similarity matrices since including individual-level results via a distance measure (as opposed to correlation) resulted in groups that were too small to offer any value over individual-level analysis.”
§ Organizing Heterogeneous Samples Using Community Detection of GIMME-Derived Resting State Functional Networks > Discussion
plaindirect- Asserted: passes — The authors put it forward as true.
- Checkable: passes — It can be checked against evidence.
- Load-bearing: passes — The paper’s conclusions depend on it.
- Based: passes — The paper gives a reason why it holds.
It may state two separate claims as one.
A result the paper reports from its own data — it cites no other source for it, so there is none to check. The quote shows it is in the paper.
In the paper
“Although the majority of ADHD-diagnosed children fell into two subgroups, about a third were spread across the three subgroups comprised of predominantly typically developing control.”
§ Organizing Heterogeneous Samples Using Community Detection of GIMME-Derived Resting State Functional Networks > Discussion
plain- Asserted: passes — The authors put it forward as true.
- Checkable: passes — It can be checked against evidence.
- Load-bearing: passes — The paper’s conclusions depend on it.
- Based: passes — The paper gives a reason why it holds.
It may state two separate claims as one.
None of the sources cited for this claim have been checked yet.
In the paper
“Two, given that brain processes can best be thought of as coordinated activity of disparate regions across time [14], [15], we necessitated an approach for arriving at precise brain connectivity maps that quantifies relations among brain regions across time for each individual.”
§ Organizing Heterogeneous Samples Using Community Detection of GIMME-Derived Resting State Functional Networks > Introduction
What the sources say
- Not checked yetcites [14] O Sporns, 2004, Organization, development and function of complex brain networks, Trends Cogn Sci source
- Not checked yetcites [15] G Tononi, 1994, A measure for brain complexity: relating functional segregation and integration in the nervous system, Proceedings of the National Academy of Sciences source
plain- Asserted: passes — The authors put it forward as true.
- Checkable: fails — It may be too vague to check against evidence.
- Load-bearing: passes — The paper’s conclusions depend on it.
- Based: passes — The paper gives a reason why it holds.
Probably not a substantial claim. It may be too vague to check against evidence.
In the paper
“Moreover, assuming within-group homogeneity will likely cause misleading results at the aggregate level [8]–[10] in addition to missing important features for subpopulations within a given category.”
§ Organizing Heterogeneous Samples Using Community Detection of GIMME-Derived Resting State Functional Networks > Introduction
What the sources say
- Not checked yetcites [8]–[10]
hedgedconditional- Asserted: passes — The authors put it forward as true.
- Checkable: passes — It can be checked against evidence.
- Load-bearing: passes — The paper’s conclusions depend on it.
- Based: passes — The paper gives a reason why it holds.
It may state two separate claims as one.
In the paper
“A critical review of literature reveals that these assumptions are rarely met [5]–[7].”
§ Organizing Heterogeneous Samples Using Community Detection of GIMME-Derived Resting State Functional Networks > Introduction
What the sources say
- Not checked yetcites [5]–[7]
plain- Asserted: passes — The authors put it forward as true.
- Checkable: passes — It can be checked against evidence.
- Load-bearing: passes — The paper’s conclusions depend on it.
- Based: passes — The paper gives a reason why it holds.
It may state two separate claims as one.
None of the sources cited for this claim have been checked yet.
In the paper
“Brain connectivity maps have been used to identify systematic differences between subgroups and conditions in both clinical and non-clinical populations (e.g., [5], [13]).”
§ Organizing Heterogeneous Samples Using Community Detection of GIMME-Derived Resting State Functional Networks > Introduction
What the sources say
- Not checked yetcites [5] FG Hillary, 2011, Examining working memory task acquisition in a disrupted neural network, Brain source
- Not checked yetcites [13] AM Beltz, 2013, Changes in alcohol-related brain networks across the first year of college: a prospective pilot study using fMRI effective connectivity mapping, Addict Behav source
plaincorrelational- Asserted: passes — The authors put it forward as true.
- Checkable: passes — It can be checked against evidence.
- Load-bearing: passes — The paper’s conclusions depend on it.
- Based: passes — The paper gives a reason why it holds.
Probably not a substantial claim.
None of the sources cited for this claim have been checked yet.
In the paper
“Most evidence for this phenomenon has been from neuropsychological data and behavior or symptom report (e.g., [2]), with recent evidence suggesting heterogeneity in the biological components as well [48].”
§ Organizing Heterogeneous Samples Using Community Detection of GIMME-Derived Resting State Functional Networks > Discussion
What the sources say
- Not checked yetcites [2] DA Fair, 2012, Distinct neuropsychological subgroups in typically developing youth inform heterogeneity in children with ADHD, Proc Natl Acad Sci U S A source
- Not checked yetcites [48] D Fair, 2013, Distinct Neural Signatures Detected for ADHD Subtypes After Controlling for Micro-Movements in Resting State Functional Connectivity MRI Data, Frontiers in Systems Neuroscience source
hedged- Asserted: passes — The authors put it forward as true.
- Checkable: passes — It can be checked against evidence.
- Load-bearing: passes — The paper’s conclusions depend on it.
- Based: passes — The paper gives a reason why it holds.
Probably not a substantial claim. It may state two separate claims as one.
A conclusion the paper draws from its own results — it cites no other source for it, so there is none to check. The quote shows it is in the paper.
In the paper
“Hence there appears to be some connections that exist for the majority of individuals while there also exists a large degree of heterogeneity in the structure of connections as evidenced by the extra connections uncovered at the individual level.”
§ Organizing Heterogeneous Samples Using Community Detection of GIMME-Derived Resting State Functional Networks > Results > Empirical data
hedged- Asserted: passes — The authors put it forward as true.
- Checkable: passes — It can be checked against evidence.
- Load-bearing: passes — The paper’s conclusions depend on it.
- Based: passes — The paper gives a reason why it holds.
It may state two separate claims as one.
In the paper
“These preprocessing steps are thought to reduce spurious variance unlikely to reflect neuronal activity [38].”
§ Organizing Heterogeneous Samples Using Community Detection of GIMME-Derived Resting State Functional Networks > Data Acquisition and Processing
What the sources say
- Not checked yetcites [38] MD Fox, 2007, Spontaneous fluctuations in brain activity observed with functional magnetic resonance imaging, Nat Rev Neurosci source
hedgedconditional- Asserted: passes — The authors put it forward as true.
- Checkable: passes — It can be checked against evidence.
- Load-bearing: fails — The paper’s conclusions may not depend on it.
- Based: passes — The paper gives a reason why it holds.
Probably not a substantial claim. The paper’s conclusions may not depend on it.
A conclusion the paper draws from its own results — it cites no other source for it, so there is none to check. The quote shows it is in the paper.
In the paper
“The development of treatments, preventative, and intervention strategies for a given individual also suffer from this confound.”
§ Organizing Heterogeneous Samples Using Community Detection of GIMME-Derived Resting State Functional Networks > Introduction
plaindirect- Asserted: passes — The authors put it forward as true.
- Checkable: fails — It may be too vague to check against evidence.
- Load-bearing: fails — The paper’s conclusions may not depend on it.
- Based: fails — The paper may give no reason why it holds.
Probably not a substantial claim. It may be too vague to check against evidence. The paper’s conclusions may not depend on it. The paper may give no reason why it holds.
- Rests on an assumption: Studies examining the etiology of any given disorder typically ignore the potential heterogeneity that exists within current symptom-based classifications.
In the paper
“Variation in the connection weights of specific connections between two given ROIs has long been a focal point of fMRI research [17].”
§ Organizing Heterogeneous Samples Using Community Detection of GIMME-Derived Resting State Functional Networks > Methods > Comparing connectivity maps between subgroups
What the sources say
- Not checked yetcites [17] J Kim, 2007, Unified structural equation modeling approach for the analysis of multisubject, multivariate functional MRI data, Hum Brain Mapp source
plain- Asserted: passes — The authors put it forward as true.
- Checkable: passes — It can be checked against evidence.
- Load-bearing: fails — The paper’s conclusions may not depend on it.
- Based: passes — The paper gives a reason why it holds.
Probably not a substantial claim. The paper’s conclusions may not depend on it.
A conclusion the paper draws from its own results — it cites no other source for it, so there is none to check. The quote shows it is in the paper.
In the paper
“Taken together, subgroups A, C, and E are subgroups with low likelihood for ADHD and as such have an organization of brain physiology that we term “protective.””
§ Organizing Heterogeneous Samples Using Community Detection of GIMME-Derived Resting State Functional Networks > Results > Empirical data
plaincorrelational- Asserted: passes — The authors put it forward as true.
- Checkable: passes — It can be checked against evidence.
- Load-bearing: passes — The paper’s conclusions depend on it.
- Based: passes — The paper gives a reason why it holds.
It may state two separate claims as one.
A conclusion the paper draws from its own results — it cites no other source for it, so there is none to check. The quote shows it is in the paper.
In the paper
“These findings demonstrate that heterogeneity exists within both control and ADHD populations”
§ Organizing Heterogeneous Samples Using Community Detection of GIMME-Derived Resting State Functional Networks > Results > Empirical data
boosted- Asserted: passes — The authors put it forward as true.
- Checkable: passes — It can be checked against evidence.
- Load-bearing: passes — The paper’s conclusions depend on it.
- Based: passes — The paper gives a reason why it holds.
It may state two separate claims as one.
In the paper
“Although small literatures have made attempts to parse fMRI data across individuals using various statistical methods (e.g., [11]), none have been sufficiently accepted to fall into wide use.”
§ Organizing Heterogeneous Samples Using Community Detection of GIMME-Derived Resting State Functional Networks > Introduction
What the sources say
- Not checked yetcites [11] F Kherif, 2003, Group analysis in functional neuroimaging: selecting subjects using similarity measures, NeuroImage source
plain- Asserted: passes — The authors put it forward as true.
- Checkable: passes — It can be checked against evidence.
- Load-bearing: passes — The paper’s conclusions depend on it.
- Based: passes — The paper gives a reason why it holds.
It may state two separate claims as one.
A conclusion the paper draws from its own results — it cites no other source for it, so there is none to check. The quote shows it is in the paper.
In the paper
“The empirical data example offered concrete evidence for theories that have hitherto been untested.”
§ Organizing Heterogeneous Samples Using Community Detection of GIMME-Derived Resting State Functional Networks > Discussion
boosted- Asserted: passes — The authors put it forward as true.
- Checkable: fails — It may be too vague to check against evidence.
- Load-bearing: passes — The paper’s conclusions depend on it.
- Based: passes — The paper gives a reason why it holds.
Probably not a substantial claim. It may be too vague to check against evidence.
None of the sources cited for this claim have been checked yet.
In the paper
“Unified SEM contains both lagged and contemporaneous directed relations among regions, making it ideal for biological systems that likely contain these effects as detailed in [18].”
§ Organizing Heterogeneous Samples Using Community Detection of GIMME-Derived Resting State Functional Networks > Methods > GIMME
What the sources say
- Not checked yetcites [17] J Kim, 2007, Unified structural equation modeling approach for the analysis of multisubject, multivariate functional MRI data, Hum Brain Mapp source
- Not checked yetcites [18] KM Gates, 2010, Automatic search for fMRI connectivity mapping: an alternative to Granger causality testing using formal equivalences among SEM path modeling, VAR, and unified SEM, Neuroimage source
hedged- Asserted: passes — The authors put it forward as true.
- Checkable: passes — It can be checked against evidence.
- Load-bearing: passes — The paper’s conclusions depend on it.
- Based: passes — The paper gives a reason why it holds.
Probably not a substantial claim. It may state two separate claims as one.
A conclusion the paper draws from its own results — it cites no other source for it, so there is none to check. The quote shows it is in the paper.
In the paper
“Taken together, our approach is a robust and easily applied method that utilizes functional connectivity networks to arrive at brain-based subgroups with no prior classification information.”
§ Organizing Heterogeneous Samples Using Community Detection of GIMME-Derived Resting State Functional Networks > Introduction
plaindirect- Asserted: passes — The authors put it forward as true.
- Checkable: passes — It can be checked against evidence.
- Load-bearing: passes — The paper’s conclusions depend on it.
- Based: passes — The paper gives a reason why it holds.
It may state two separate claims as one.
In the paper
“The degree of similarity to expect as well as the variability in connection weights has been informed by previous research that used individual-level connectivity maps to examine a priori defined subgroups (e.g., [5])”
§ Organizing Heterogeneous Samples Using Community Detection of GIMME-Derived Resting State Functional Networks > Data > Simulated data
What the sources say
- Not checked yetcites [5] FG Hillary, 2011, Examining working memory task acquisition in a disrupted neural network, Brain source
plain- Asserted: passes — The authors put it forward as true.
- Checkable: passes — It can be checked against evidence.
- Load-bearing: fails — The paper’s conclusions may not depend on it.
- Based: passes — The paper gives a reason why it holds.
Probably not a substantial claim. The paper’s conclusions may not depend on it.
What the paper did — it cites no source for this, so there is none to check. The quote shows it is in the paper.
In the paper
“They independently assigned all appropriate diagnoses, with adequate agreement (kappa>.75 for all disorders with base rate >5% in a larger sample of several hundred children they have reviewed) and kappa >.80 for ADHD.”
§ Organizing Heterogeneous Samples Using Community Detection of GIMME-Derived Resting State Functional Networks > Data > Empirical data set
plain- Asserted: passes — The authors put it forward as true.
- Checkable: passes — It can be checked against evidence.
- Load-bearing: unclear — It is unclear whether the paper’s conclusions depend on it.
- Based: passes — The paper gives a reason why it holds.
It may state two separate claims as one.
None of the sources cited for this claim have been checked yet.
In the paper
“In particular, researchers have made strong assertions that clinical diagnoses may result from multiple etiologies [3], [4].”
§ Organizing Heterogeneous Samples Using Community Detection of GIMME-Derived Resting State Functional Networks > Discussion
What the sources say
- Not checked yetcites [3] FR Volkmar, 2004, Autism and pervasive mental disorders, Journal of Child Psychology and Psychiatry
- Not checked yetcites [4] Gottesman II, 2003, The endophenotype concept in psychiatry: Etymology and strategic intentions, American Journal of Psychiatry source
boostedconditional- Asserted: passes — The authors put it forward as true.
- Checkable: passes — It can be checked against evidence.
- Load-bearing: passes — The paper’s conclusions depend on it.
- Based: passes — The paper gives a reason why it holds.
Probably not a substantial claim.
None of the sources cited for this claim have been checked yet.
In the paper
“These regions termed the fronto-parietal network (see Figure 5a) were selected based on their implied role in adaptive task level control that surfaces in resting state studies [40], [41] and atypical nature in studies of ADHD [42], [43].”
§ Organizing Heterogeneous Samples Using Community Detection of GIMME-Derived Resting State Functional Networks > Data Acquisition and Processing
What the sources say
plain- Asserted: passes — The authors put it forward as true.
- Checkable: passes — It can be checked against evidence.
- Load-bearing: passes — The paper’s conclusions depend on it.
- Based: passes — The paper gives a reason why it holds.
Probably not a substantial claim.
None of the sources cited for this claim have been checked yet.
In the paper
“This possibility has been noted in ADHD as well as Autism Spectrum Disorder [3], [47].”
§ Organizing Heterogeneous Samples Using Community Detection of GIMME-Derived Resting State Functional Networks > Discussion
What the sources say
- Not checked yetcites [3] FR Volkmar, 2004, Autism and pervasive mental disorders, Journal of Child Psychology and Psychiatry
- Not checked yetcites [47] C Betancur, 2011, Etiological heterogeneity in autism spectrum disorders: more than 100 genetic and genomic disorders and still counting, Brain Res source
plain- Asserted: passes — The authors put it forward as true.
- Checkable: passes — It can be checked against evidence.
- Load-bearing: fails — The paper’s conclusions may not depend on it.
- Based: passes — The paper gives a reason why it holds.
Probably not a substantial claim. The paper’s conclusions may not depend on it. It may state two separate claims as one.
A conclusion the paper draws from its own results — it cites no other source for it, so there is none to check. The quote shows it is in the paper.
In the paper
“Taken together, there appears to be different physiological markers within the ADHD diagnostic category as well as different profiles within the control sample.”
§ Organizing Heterogeneous Samples Using Community Detection of GIMME-Derived Resting State Functional Networks > Results > Empirical data
hedged- Asserted: passes — The authors put it forward as true.
- Checkable: passes — It can be checked against evidence.
- Load-bearing: passes — The paper’s conclusions depend on it.
- Based: passes — The paper gives a reason why it holds.
It may state two separate claims as one.
A conclusion the paper draws from its own results — it cites no other source for it, so there is none to check. The quote shows it is in the paper.
In the paper
“Hence it appears the within-group heterogeneity washed out effects of interest that we were able to isolate by enabling for heterogeneity within the diagnostic categories.”
§ Organizing Heterogeneous Samples Using Community Detection of GIMME-Derived Resting State Functional Networks > Results > Empirical data
hedgeddirect- Asserted: passes — The authors put it forward as true.
- Checkable: passes — It can be checked against evidence.
- Load-bearing: passes — The paper’s conclusions depend on it.
- Based: passes — The paper gives a reason why it holds.
It may state two separate claims as one.
A conclusion the paper draws from its own results — it cites no other source for it, so there is none to check. The quote shows it is in the paper.
In the paper
“However, it does present a significant barrier in the development of genetic and biological markers to assist in accurate diagnoses for a given disorder.”
§ Organizing Heterogeneous Samples Using Community Detection of GIMME-Derived Resting State Functional Networks > Introduction
plaindirect- Asserted: passes — The authors put it forward as true.
- Checkable: passes — It can be checked against evidence.
- Load-bearing: passes — The paper’s conclusions depend on it.
- Based: fails — The paper may give no reason why it holds.
Probably not a substantial claim. The paper may give no reason why it holds.
- Rests on an assumption: Studies examining the etiology of any given disorder typically ignore the potential heterogeneity that exists within current symptom-based classifications.
A conclusion the paper draws from its own results — it cites no other source for it, so there is none to check. The quote shows it is in the paper.
In the paper
“Subgroups B and D appear to have brain organizations that place them at higher likelihood for having ADHD.”
§ Organizing Heterogeneous Samples Using Community Detection of GIMME-Derived Resting State Functional Networks > Results > Empirical data
hedgedcorrelational- Asserted: passes — The authors put it forward as true.
- Checkable: passes — It can be checked against evidence.
- Load-bearing: passes — The paper’s conclusions depend on it.
- Based: passes — The paper gives a reason why it holds.
It may state two separate claims as one.
None of the sources cited for this claim have been checked yet.
In the paper
“As seen previously [10], GIMME reliably recovered the presence and true direction of connections at the group and individual levels and is one of the few approaches that can do so [46].”
§ Organizing Heterogeneous Samples Using Community Detection of GIMME-Derived Resting State Functional Networks > Discussion
What the sources say
plaindirect- Asserted: passes — The authors put it forward as true.
- Checkable: passes — It can be checked against evidence.
- Load-bearing: passes — The paper’s conclusions depend on it.
- Based: passes — The paper gives a reason why it holds.
It may state two separate claims as one.
A conclusion the paper draws from its own results — it cites no other source for it, so there is none to check. The quote shows it is in the paper.
In the paper
“The method presented here is a step towards this goal.”
§ Organizing Heterogeneous Samples Using Community Detection of GIMME-Derived Resting State Functional Networks > Discussion
plain- Asserted: passes — The authors put it forward as true.
- Checkable: fails — It may be too vague to check against evidence.
- Load-bearing: passes — The paper’s conclusions depend on it.
- Based: passes — The paper gives a reason why it holds.
Probably not a substantial claim. It may be too vague to check against evidence.
The paper states this without a source or data behind it here, so there is nothing to check it against. The quote shows it is in the paper.
In the paper
“The proliferation of community detection programs has occurred quickly enough such that they have yet to be formally compared and evaluated to identify which ones are best for which situations (e.g., number of individuals in each “true” group, number of subgroups in a sample, unequal group sizes, small sample sizes) and what scientific questions.”
§ Organizing Heterogeneous Samples Using Community Detection of GIMME-Derived Resting State Functional Networks > Discussion
plaindirect- Asserted: passes — The authors put it forward as true.
- Checkable: passes — It can be checked against evidence.
- Load-bearing: fails — The paper’s conclusions may not depend on it.
- Based: fails — The paper may give no reason why it holds.
Probably not a substantial claim. The paper’s conclusions may not depend on it. The paper may give no reason why it holds.
In the paper
“Data in the ADHD literature examining functional differences in the diagnostic subtypes (i.e. Combined type, and Inattentive type) lend support for this particular finding [2].”
§ Organizing Heterogeneous Samples Using Community Detection of GIMME-Derived Resting State Functional Networks > Discussion
What the sources say
- Not checked yetcites [2] DA Fair, 2012, Distinct neuropsychological subgroups in typically developing youth inform heterogeneity in children with ADHD, Proc Natl Acad Sci U S A source
plaincorrelational- Asserted: passes — The authors put it forward as true.
- Checkable: passes — It can be checked against evidence.
- Load-bearing: fails — The paper’s conclusions may not depend on it.
- Based: passes — The paper gives a reason why it holds.
Probably not a substantial claim. The paper’s conclusions may not depend on it.
A conclusion the paper draws from its own results — it cites no other source for it, so there is none to check. The quote shows it is in the paper.
In the paper
“whereas conducting individual-level analysis would result in unique maps from which no meaningful inferences could be made.”
§ Organizing Heterogeneous Samples Using Community Detection of GIMME-Derived Resting State Functional Networks > Discussion
hedgeddirect- Asserted: passes — The authors put it forward as true.
- Checkable: passes — It can be checked against evidence.
- Load-bearing: passes — The paper’s conclusions depend on it.
- Based: fails — The paper may give no reason why it holds.
Probably not a substantial claim. The paper may give no reason why it holds.
The paper states this without a source or data behind it here, so there is nothing to check it against. The quote shows it is in the paper.
In the paper
“Data of a substantial sample size are often capable of being split into a multitude of valid subgroup arrangements.”
§ Organizing Heterogeneous Samples Using Community Detection of GIMME-Derived Resting State Functional Networks > Discussion
plaincorrelational- Asserted: passes — The authors put it forward as true.
- Checkable: fails — It may be too vague to check against evidence.
- Load-bearing: passes — The paper’s conclusions depend on it.
- Based: fails — The paper may give no reason why it holds.
Probably not a substantial claim. It may be too vague to check against evidence. The paper may give no reason why it holds.
None of the sources cited for this claim have been checked yet.
In the paper
“We used GSR because it offers a number of benefits such as improving the correspondence between resting-state correlations and anatomy [54] and motion correction at the time series level [55], [56].”
§ Organizing Heterogeneous Samples Using Community Detection of GIMME-Derived Resting State Functional Networks > Discussion
What the sources say
- Not checked yetcites [54] MD Fox, 2009, The global signal and observed anticorrelated resting state brain networks, Journal of neurophysiology source
- Not checked yetcites [55] TD Satterthwaite, 2013, Heterogeneous impact of motion on fundamental patterns of developmental changes in functional connectivity during youth, Neuroimage source
- Not checked yetcites [56] CG Yan, 2013, A comprehensive assessment of regional variation in the impact of head micromovements on functional connectomics, Neuroimage source
plaindirect- Asserted: passes — The authors put it forward as true.
- Checkable: passes — It can be checked against evidence.
- Load-bearing: passes — The paper’s conclusions depend on it.
- Based: passes — The paper gives a reason why it holds.
It may state two separate claims as one.
None of the sources cited for this claim have been checked yet.
In the paper
“There is the possibility that GSR altered connectivity patterns [57], [58], which in turn may change the degree of similarity of individuals and thus the resulting community designations.”
§ Organizing Heterogeneous Samples Using Community Detection of GIMME-Derived Resting State Functional Networks > Discussion
What the sources say
- Not checked yetcites [57] SJ Gotts, 2013, The perils of global signal regression for group comparisons: a case study of Autism Spectrum Disorders, Frontiers in human neuroscience source
- Not checked yetcites [58] ZS Saad, 2012, Trouble at rest: how correlation patterns and group differences become distorted after global signal regression, Brain connectivity source
hedgedconditional- Asserted: passes — The authors put it forward as true.
- Checkable: passes — It can be checked against evidence.
- Load-bearing: fails — The paper’s conclusions may not depend on it.
- Based: passes — The paper gives a reason why it holds.
Probably not a substantial claim. The paper’s conclusions may not depend on it. It may state two separate claims as one.
A conclusion the paper draws from its own results — it cites no other source for it, so there is none to check. The quote shows it is in the paper.
In the paper
“Hence grouping all ADHD individuals together may not capture all of the informative characteristics of the disorder and in this sample, washed out meaningful differences.”
§ Organizing Heterogeneous Samples Using Community Detection of GIMME-Derived Resting State Functional Networks > Discussion
hedgedconditional- Asserted: passes — The authors put it forward as true.
- Checkable: passes — It can be checked against evidence.
- Load-bearing: passes — The paper’s conclusions depend on it.
- Based: passes — The paper gives a reason why it holds.
It may state two separate claims as one.
The paper states this without a source or data behind it here, so there is nothing to check it against. The quote shows it is in the paper.
In the paper
“For instance, the connectivity mapping results may vary based on preprocessing decisions, such as global signal regression (GSR).”
§ Organizing Heterogeneous Samples Using Community Detection of GIMME-Derived Resting State Functional Networks > Discussion
hedgedconditional- Asserted: passes — The authors put it forward as true.
- Checkable: passes — It can be checked against evidence.
- Load-bearing: fails — The paper’s conclusions may not depend on it.
- Based: passes — The paper gives a reason why it holds.
Probably not a substantial claim. The paper’s conclusions may not depend on it.
None of the sources cited for this claim have been checked yet.
In the paper
“A long line of research in the social sciences has urged researchers to examine processes at the individual level rather than aggregate as is typically done in cross-sectional studies [45], [49]–[51].”
§ Organizing Heterogeneous Samples Using Community Detection of GIMME-Derived Resting State Functional Networks > Discussion
What the sources say
- Not checked yetcites [45] PC Molenaar, 2004, A manifesto on psychology as idiographic science: Bringing the person back into scientific psychology, this time forever, Measurement
- Not checked yetcites [49]–[51]
plain- Asserted: passes — The authors put it forward as true.
- Checkable: passes — It can be checked against evidence.
- Load-bearing: passes — The paper’s conclusions depend on it.
- Based: passes — The paper gives a reason why it holds.
Probably not a substantial claim.
A conclusion the paper draws from its own results — it cites no other source for it, so there is none to check. The quote shows it is in the paper.
In the paper
“Nonetheless, the work supports the potential of a biologically based nosology in the future.”
§ Organizing Heterogeneous Samples Using Community Detection of GIMME-Derived Resting State Functional Networks > Discussion
hedged- Asserted: passes — The authors put it forward as true.
- Checkable: fails — It may be too vague to check against evidence.
- Load-bearing: passes — The paper’s conclusions depend on it.
- Based: passes — The paper gives a reason why it holds.
Probably not a substantial claim. It may be too vague to check against evidence.
The paper states this without a source or data behind it here, so there is nothing to check it against. The quote shows it is in the paper.
In the paper
“We utilize sample-level paths since they are normally distributed across individuals and thus appropriate for obtaining correlation values denoting similarity in values for use with the community detection algorithm.”
§ Organizing Heterogeneous Samples Using Community Detection of GIMME-Derived Resting State Functional Networks > Discussion
plaindirect- Asserted: passes — The authors put it forward as true.
- Checkable: passes — It can be checked against evidence.
- Load-bearing: passes — The paper’s conclusions depend on it.
- Based: fails — The paper may give no reason why it holds.
Probably not a substantial claim. The paper may give no reason why it holds. It may state two separate claims as one.
The paper states this without a source or data behind it here, so there is nothing to check it against. The quote shows it is in the paper.
In the paper
“Importantly, many community detection approaches in the fMRI literature have been tested on relatively large adjacency matrices and, while useful, may not be optimal for smaller matrices where the nodes are participants.”
§ Organizing Heterogeneous Samples Using Community Detection of GIMME-Derived Resting State Functional Networks > Discussion
hedgedconditional- Asserted: passes — The authors put it forward as true.
- Checkable: passes — It can be checked against evidence.
- Load-bearing: fails — The paper’s conclusions may not depend on it.
- Based: fails — The paper may give no reason why it holds.
Probably not a substantial claim. The paper’s conclusions may not depend on it. The paper may give no reason why it holds.
The paper states this without a source or data behind it here, so there is nothing to check it against. The quote shows it is in the paper.
In the paper
“What determines a given demarcation rests predominantly on the features (in our case connections) chosen to show similarities or differences between individuals and the algorithm chosen to demarcate the sample.”
§ Organizing Heterogeneous Samples Using Community Detection of GIMME-Derived Resting State Functional Networks > Discussion
plaindirect- Asserted: passes — The authors put it forward as true.
- Checkable: passes — It can be checked against evidence.
- Load-bearing: passes — The paper’s conclusions depend on it.
- Based: fails — The paper may give no reason why it holds.
Probably not a substantial claim. The paper may give no reason why it holds.
None of the sources cited for this claim have been checked yet.
In the paper
“Importantly, the fact that typically developing controls may be heterogeneous in functional brain architecture, or brain “profiles”, is not a new concept either.”
§ Organizing Heterogeneous Samples Using Community Detection of GIMME-Derived Resting State Functional Networks > Discussion
hedged- Asserted: passes — The authors put it forward as true.
- Checkable: passes — It can be checked against evidence.
- Load-bearing: fails — The paper’s conclusions may not depend on it.
- Based: passes — The paper gives a reason why it holds.
Probably not a substantial claim. The paper’s conclusions may not depend on it.
In the paper
“The Newman algorithm [19], as applied here, is widely used, but is likely not optimal for all situations.”
§ Organizing Heterogeneous Samples Using Community Detection of GIMME-Derived Resting State Functional Networks > Discussion
What the sources say
- Not checked yetcites [19] ME Newman, 2006, Modularity and community structure in networks, Proc Natl Acad Sci U S A source
hedged- Asserted: passes — The authors put it forward as true.
- Checkable: fails — It may be too vague to check against evidence.
- Load-bearing: fails — The paper’s conclusions may not depend on it.
- Based: passes — The paper gives a reason why it holds.
Probably not a substantial claim. It may be too vague to check against evidence. The paper’s conclusions may not depend on it. It may state two separate claims as one.
A conclusion the paper draws from its own results — it cites no other source for it, so there is none to check. The quote shows it is in the paper.
In the paper
“Amidst the heterogeneity within diagnostic categories, subgroups emerged that were predominantly clinical or control, supporting some degree of biological validity to the existing nosology.”
§ Organizing Heterogeneous Samples Using Community Detection of GIMME-Derived Resting State Functional Networks > Discussion
hedgedcorrelational- Asserted: passes — The authors put it forward as true.
- Checkable: passes — It can be checked against evidence.
- Load-bearing: passes — The paper’s conclusions depend on it.
- Based: passes — The paper gives a reason why it holds.
It may state two separate claims as one.
The paper states this without a source or data behind it here, so there is nothing to check it against. The quote shows it is in the paper.
In the paper
“Since contemporaneous paths seem to hold information regarding neuronal relationships, we chose to use these.”
§ Organizing Heterogeneous Samples Using Community Detection of GIMME-Derived Resting State Functional Networks > Discussion
hedgedcorrelational- Asserted: passes — The authors put it forward as true.
- Checkable: passes — It can be checked against evidence.
- Load-bearing: passes — The paper’s conclusions depend on it.
- Based: fails — The paper may give no reason why it holds.
Probably not a substantial claim. The paper may give no reason why it holds.
In the paper
“Along with this growth there has been an influx of algorithms that seek to improve upon the traditionally used ones (e.g., [53]).”
§ Organizing Heterogeneous Samples Using Community Detection of GIMME-Derived Resting State Functional Networks > Discussion
What the sources say
- Not checked yetcites [53] VD Blondel, 2008, Fast unfolding of communities in large networks, Journal of Statistical Mechanics: Theory and Experiment source
plain- Asserted: passes — The authors put it forward as true.
- Checkable: passes — It can be checked against evidence.
- Load-bearing: fails — The paper’s conclusions may not depend on it.
- Based: passes — The paper gives a reason why it holds.
Probably not a substantial claim. The paper’s conclusions may not depend on it.
The authors state this as an assumption.
Clinical investigations of many neuropsychiatric disorders rely on the assumption that diagnostic categories and typical control samples each have within-group homogeneity.
“Clinical investigations of many neuropsychiatric disorders rely on the assumption that diagnostic categories and typical control samples each have within-group homogeneity.”
The paper relies on this without support.
Studies examining the etiology of any given disorder typically ignore the potential heterogeneity that exists within current symptom-based classifications.
“While it is largely agreed that the above possibility exists, studies examining the etiology of any given disorder typically ignore the potential heterogeneity that exists within current symptom-based classifications.”
The paper relies on this without support.
Analyses are conducted as though both the diagnostic group and the comparison control group represent two homogeneous populations.
“In accordance with the current standard, analyses are conducted as though both the diagnostic group and the comparison control group represent two homogeneous populations.”
The paper relies on this without support.
rs-fcMRI is developmentally and contextually more variable than brain structural measures.
“A benefit of rs-fcMRI is that it is developmentally and contextually more variable than brain structural measures, making it a highly attractive place to start towards the goal of identifying subgroups of individuals based on similar brain processes.”
The paper relies on this without support.
rs-fcMRI can be administered across any age range, species, or cognitive ability.
“Furthermore, it can be administered at across any age range, species, or cognitive ability.”
The paper relies on this without support.
Prior rs-fcMRI analyses have revealed ongoing information processing between spatially disparate regions of the brain even during rest, and differences in these processes relate to cognitive performance and psychiatric disorders.
“Prior rs-fcMRI analyses have revealed that there is ongoing information processing between spatially disparate regions of the brain even during rest, and differences in these observed processes relate to cognitive performance as well as psychiatric disorders.”
The paper relies on this without support.
Sample-level connections will have normally distributed estimates across individuals.
“An added benefit is that sample-level connections will have normally distributed estimates across individuals, making it appropriate for the correlation analysis to follow.”
The paper relies on this without support.
Researchers commonly select thresholds that provide the highest modularity index.
“Researchers commonly select thresholds (or solutions) that provide the highest modularity index.”
The paper relies on this without support.
The ADHD and TDC diagnostic categories are valid and meaningful groupings for the analyses.
“we placed and analyzed the individuals into groups based on their diagnostic status.”
The paper relies on this without support.
The sample of children is representative of the broader ADHD and typically developing populations to which the findings are generalized.
“These findings demonstrate that heterogeneity exists within both control and ADHD populations”
Claims other papers make about this one
Each is checked against this paper’s own text: does it say what the citing paper says it does?
In the citing paper
“Recent evidence has also emerged for neurobiological subgroups of ADHD based on network connectivity of the reward system (Costa Dias et al., 2015) and other large-scale brain networks (Gates et al., 2014).”
From Investigating functional brain network integrity using a traditional and novel categorical scheme for neurodevelopmental disorders (2019) · cites this paper as Gates et al., 2014
In the citing paper
“Findings from these studies suggest that identifying mechanistic subpopulations across ADHD and typically developing children may inform heterogeneity and the clinical course of a given child.”
From Characterizing heterogeneity in children with and without ADHD based on reward system connectivity (2015) · cites this paper as Gates et al., 2014
In the citing paper
“Gates et al. (2014) utilized simulated imaging data, along with empirical resting-state functional connectivity of the fronto-parietal network to validate the use of community detection in identifying subgroups.”
From Characterizing heterogeneity in children with and without ADHD based on reward system connectivity (2015) · cites this paper as Gates et al., 2014
In the citing paper
“Three recent reports from our team have highlighted the use of community detection as a way to characterize heterogeneity in ADHD (Fair et al., 2012, Gates et al., 2014, Karalunas et al., 2015).”
From Characterizing heterogeneity in children with and without ADHD based on reward system connectivity (2015) · cites this paper as Gates et al., 2014
In the citing paper
“This study corroborates findings of Karalunas et al. (2015) and Gates et al. (2014).”
From Characterizing heterogeneity in children with and without ADHD based on reward system connectivity (2015) · cites this paper as Gates et al. (2014)
In the citing paper
“These data highlight not only variation in ADHD, but in typically developing children as well (Fair et al., 2012, Gates et al., 2014).”
From Characterizing heterogeneity in children with and without ADHD based on reward system connectivity (2015) · cites this paper as Gates et al., 2014
In the citing paper
“This particular finding is similar in theme to that of previous reports (Fair et al., 2012, Gates et al., 2014).”
From Characterizing heterogeneity in children with and without ADHD based on reward system connectivity (2015) · cites this paper as Gates et al., 2014
In the citing paper
“Similar methods have been used to assess behavioral and temperamental variation in ADHD and typically developing populations (Fair et al., 2012, Gates et al., 2014, Karalunas et al., 2015).”
From Characterizing heterogeneity in children with and without ADHD based on reward system connectivity (2015) · cites this paper as Gates et al., 2014
Self-check
Percentages, sums and reported differences re-computed from the paper’s own numbers.
Each contradiction between two passages listed here was confirmed by an independent check.
Rated major: it would touch a result — a value a result rests on, reported and recomputed p-values on opposite sides of the significance level, two passages that conflict with no sign which is right, or a cited work retracted before this paper was published.
In the paper
§ Organizing Heterogeneous Samples Using Community Detection of GIMME-Derived Resting State Functional Networks > Data > Empirical data set
“80 children (29 females and 51 male)”
§ Organizing Heterogeneous Samples Using Community Detection of GIMME-Derived Resting State Functional Networks > Data > Empirical data set
“| % Male | 78% | 46% | χ2 = 4.77, df = 1, p = .03 |”
Rated minor: it would not touch a result — a value no result rests on, a p-value that stays on the same side of the significance level, or a conflict that is clerical, resolved elsewhere in the paper, or outside its own findings.
In the paper
§ Organizing Heterogeneous Samples Using Community Detection of GIMME-Derived Resting State Functional Networks > Results > Simulated data
“on average 99.73% (std. = 0.09%”
§ Organizing Heterogeneous Samples Using Community Detection of GIMME-Derived Resting State Functional Networks > Results > Simulated data
“range = 95–100% across the 100 data sets”
Citations
Cites
Fast unfolding of communities in large networks
Blondel, V. D., Guillaume, J.-L., Lambiotte, R., & Lefebvre, E. (2008) · Journal of Statistical Mechanics: Theory and Experiment · doi:10.1088/1742-5468/2008/10/p10008 · Cited by 21,424
Modularity and community structure in networks
Newman, M. E. J. (2006) · Proceedings of the National Academy of Sciences · doi:10.1073/pnas.0601602103 · Cited by 12,256
Co-Planar Stereotaxic Atlas of the Human Brain
Talairach, J., & Tournoux, P. (1988) · Medical Entomology and Zoology · Cited by 11,798
KAUFMAN, J., BIRMAHER, B., BRENT, D., RAO, U., FLYNN, C., MORECI, P., WILLIAMSON, D., & RYAN, N. (1997) · Journal of the American Academy of Child & Adolescent Psychiatry · doi:10.1097/00004583-199707000-00021 · Cited by 10,148
Functional connectivity in the motor cortex of resting human brain using echo‐planar mri
Biswal, B., Zerrin Yetkin, F., Haughton, V. M., & Hyde, J. S. (1995) · Magnetic Resonance in Medicine · doi:10.1002/mrm.1910340409 · Cited by 9,812
The human brain is intrinsically organized into dynamic, anticorrelated functional networks
Fox, M. D., Snyder, A. Z., Vincent, J. L., Corbetta, M., Van Essen, D. C., & Raichle, M. E. (2005) · Proceedings of the National Academy of Sciences · doi:10.1073/pnas.0504136102 · Cited by 8,553
Spontaneous fluctuations in brain activity observed with functional magnetic resonance imaging
Fox, M. D., & Raichle, M. E. (2007) · Nature Reviews Neuroscience · doi:10.1038/nrn2201 · Cited by 6,700
The Endophenotype Concept in Psychiatry: Etymology and Strategic Intentions
Gottesman, I. I., & Gould, T. D. (2003) · American Journal of Psychiatry · doi:10.1176/appi.ajp.160.4.636 · Cited by 5,615
A Direct Approach to False Discovery Rates
Storey, J. D. (2002) · Journal of the Royal Statistical Society Series B: Statistical Methodology · doi:10.1111/1467-9868.00346 · Cited by 5,603
Applied Linear Regression Models
(1997) · Technometrics · doi:10.1080/00401706.1997.10485142 · Cited by 4,640
Research works printed but not linked: 1
- FR Volkmar, 2004, Autism and pervasive mental disorders, Journal of Child Psychology and Psychiatry, 45: 135, 170
Cited by
Sorted by citations
The Heterogeneity Problem: Approaches to Identify Psychiatric Subtypes
Feczko, E., Miranda-Dominguez, O., Marr, M., Graham, A. M., Nigg, J. T., & Fair, D. A. (2019) · Trends in Cognitive Sciences · doi:10.1016/j.tics.2019.03.009 · Cited by 443
Self-citationGrayson, D. S., & Fair, D. A. (2017) · NeuroImage · doi:10.1016/j.neuroimage.2017.01.079 · Cited by 411
“Complex, distributed disruptions in resting-state networks are consistently implicated in Schizophrenia (Baker et al., 2014; Khadka et al., 2013; Satterthwaite et al., 2015), ADHD (Castellanos and Aoki, 2016; Fair et al., 2012b), and Autism (Kessler et al., 2016; Moseley et al., 2015; Supekar et al., 2013) – though a…”
BackgroundInfluentialSelf-citationUnraveling the Miswired Connectome: A Developmental Perspective
Martino, A. D., Fair, D. A., Kelly, C. A. M., Satterthwaite, T. D., Castellanos, F. X., Thomason, M. E., Craddock, R. C., Luna, B., LEVENTHAL, B. L., Zuo, X., et al. (2014) · Neuron · doi:10.1016/j.neuron.2014.08.050 · Cited by 357
Self-citationDu, Y., Fu, Z., & Calhoun, V. D. (2018) · Frontiers in Neuroscience · doi:10.3389/fnins.2018.00525 · Cited by 334
Marquand, A. F., Wolfers, T., Mennes, M., Buitelaar, J. K., & Beckmann, C. F. (2016) · Biological Psychiatry Cognitive Neuroscience and Neuroimaging · doi:10.1016/j.bpsc.2016.04.002 · Cited by 267
Toward a dynamic model of psychological assessment: Implications for personalized care.
Fisher, A. J. (2015) · Journal of Consulting and Clinical Psychology · doi:10.1037/ccp0000026 · Cited by 271
Correction of respiratory artifacts in MRI head motion estimates
Fair, D. A., Miranda-Domínguez, Ó., Snyder, A. Z., Perrone, A. J., Earl, E., Van, A. N., Koller, J. M., Feczko, E., Tisdall, M. D., van der Kouwe, A. J. W., et al. (2019) · NeuroImage · doi:10.1016/j.neuroimage.2019.116400 · Cited by 226
Self-citationSubtyping cognitive profiles in Autism Spectrum Disorder using a Functional Random Forest algorithm
Feczko, E., Balba, N. M., Miranda-Dominguez, O., Cordova, M., Karalunas, S. L., Irwin, L., Demeter, D. V., Hill, A. P., Langhorst, B. H., Grieser Painter, J., et al. (2018) · NeuroImage · doi:10.1016/j.neuroimage.2017.12.044 · Cited by 173
Self-citationElectrophysiological biomarkers of diagnosis and outcome in neurodevelopmental disorders
Jeste, S., Frohlich, J., & Loo, S. K. (2015) · Current Opinion in Neurology · doi:10.1097/wco.0000000000000181 · Cited by 168
Beltz, A. M., & Gates, K. M. (2017) · Multivariate Behavioral Research · doi:10.1080/00273171.2017.1373014 · Cited by 175
Self-citationRay, S., Miller, M., Karalunas, S., Robertson, C., Grayson, D. S., Cary, R. P., Hawkey, E., Painter, J. G., Kriz, D., Fombonne, E., et al. (2014) · Human Brain Mapping · doi:10.1002/hbm.22603 · Cited by 149
Self-citationUnsupervised Classification During Time-Series Model Building
Gates, K. M., Lane, S., Varangis, E. M. L., Giovanello, K. S., & Guiskewicz, K. (2016) · Multivariate Behavioral Research · doi:10.1080/00273171.2016.1256187 · Cited by 145
Self-citationToward a revised nosology for attention-deficit/hyperactivity disorder heterogeneity
Nigg, J. T., Karalunas, S. L., Feczko, E., & Fair, D. A. (2020) · Biological Psychiatry: Cognitive Neuroscience and Neuroimaging · doi:10.1016/j.bpsc.2020.02.005 · Cited by 132
Self-citationCharacterizing heterogeneity in children with and without ADHD based on reward system connectivity
Costa Dias, T. G., Iyer, S. P., Carpenter, S. D., Cary, R. P., Wilson, V. B., Mitchell, S. H., Nigg, J. T., & Fair, D. A. (2015) · Developmental Cognitive Neuroscience · doi:10.1016/j.dcn.2014.12.005 · Cited by 130
Self-citationHeritability of the human connectome: A connectotyping study
Miranda-Domínguez, Ó., Feczko, E., Grayson, D. S., Walum, H., Nigg, J. T., & Fair, D. A. (2017) · Network Neuroscience · doi:10.1162/netn_a_00029 · Cited by 124
Self-citationParsing Heterogeneity in the Brain Connectivity of Depressed and Healthy Adults During Positive Mood
Price, R. B., Lane, S., Gates, K., Kraynak, T. E., Horner, M. S., Thase, M. E., & Siegle, G. J. (2017) · Biological Psychiatry · doi:10.1016/j.biopsych.2016.06.023 · Cited by 106
Self-citationA Monte Carlo evaluation of weighted community detection algorithms
Gates, K. M., Henry, T., Steinley, D., & Fair, D. A. (2016) · Frontiers in Neuroinformatics · doi:10.3389/fninf.2016.00045 · Cited by 106
“As seen in previous fMRI studies, the correlation matrices contain negative correlations and connection weights that span from near zero to very strong (Fair et al., 2009; Gates et al., 2014).”
Self-citationSánchez-Romero, R., Ramsey, J., Zhang, K., Glymour, M., Huang, B., & Glymour, C. (2018) · Network Neuroscience · doi:10.1162/netn_a_00061 · Cited by 88
Ciarrochi, J., Hayes, S. C., Oades, L. G., & Hofmann, S. G. (2022) · Frontiers in Psychology · doi:10.3389/fpsyg.2021.809362 · Cited by 104
Diversity and representation: Key issues for psychophysiological science
Gatzke‐Kopp, L. M. (2015) · Psychophysiology · doi:10.1111/psyp.12566 · Cited by 86
Pulini, A. A., Kerr, W. T., Loo, S. K., & Lenartowicz, A. (2019) · Biological Psychiatry: Cognitive Neuroscience and Neuroimaging · doi:10.1016/j.bpsc.2018.06.003 · Cited by 85
Karalunas, S. L., & Nigg, J. T. (2020) · Biological Psychiatry · doi:10.1016/j.biopsych.2019.11.002 · Cited by 84
Self-citationThe Neurodevelopment of Autism from Infancy Through Toddlerhood
Girault, J. B., & Piven, J. (2019) · Neuroimaging Clinics of North America · doi:10.1016/j.nic.2019.09.009 · Cited by 95
Toward Precision Medicine in ADHD
Buitelaar, J. K., Bölte, S., Brandeis, D., Caye, A., Christmann, N., Cortese, S., Coghill, D., Faraone, S. V., Franke, B., Gleitz, M., et al. (2022) · Frontiers in Behavioral Neuroscience · doi:10.3389/fnbeh.2022.900981 · Cited by 83
Connectomics and new approaches for analyzing human brain functional connectivity
Craddock, R. C., Tungaraza, R. F., & Milham, M. P. (2015) · GigaScience · doi:10.1186/s13742-015-0045-x · Cited by 82
Rudolph, M. D., Miranda-Domínguez, Ó., Cohen, A. O., Breiner, K., Steinberg, L. D., Bonnie, R. J., Scott, E. S., Taylor‐Thompson, K., Chein, J. M., Fettich, K. C., et al. (2017) · Developmental Cognitive Neuroscience · doi:10.1016/j.dcn.2017.01.010 · Cited by 83
Self-citationThe definition and measurement of heterogeneity
Nunes, A., Trappenberg, T. P., & Alda, M. (2020) · Translational Psychiatry · doi:10.1038/s41398-020-00986-0 · Cited by 81
Automated Selection of Robust Individual-Level Structural Equation Models for Time Series Data
Lane, S., & Gates, K. M. (2017) · Structural Equation Modeling A Multidisciplinary Journal · doi:10.1080/10705511.2017.1309978 · Cited by 69
Self-citationParsing heterogeneity in attention‐deficit hyperactivity disorder using EEG ‐based subgroups
Loo, S. K., McGough, J. J., McCracken, J. T., & Smalley, S. L. (2018) · Journal of Child Psychology and Psychiatry · doi:10.1111/jcpp.12814 · Cited by 73
Koirala, S., Grimsrud, G. J., Mooney, M. A., Larsen, B., Feczko, E., Elison, J. T., Nelson, S. M., Nigg, J. T., Tervo‐Clemmens, B., & Fair, D. A. (2024) · Nature reviews. Neuroscience · doi:10.1038/s41583-024-00869-z · Cited by 78
Self-citationAriens, S., Ceulemans, E., & Adolf, J. (2020) · Journal of Psychosomatic Research · doi:10.1016/j.jpsychores.2020.110191 · Cited by 76
Zhang, W., Sweeney, J. A., Bishop, J. R., Gong, Q., & Lui, S. (2023) · Nature Mental Health · doi:10.1038/s44220-023-00019-x · Cited by 67
ADHD and attentional control: Impaired segregation of task positive and task negative brain networks
Mills, B. D., Miranda-Domínguez, Ó., Mills, K. L., Earl, E., Cordova, M., Painter, J. G., Karalunas, S. L., Nigg, J. T., & Fair, D. A. (2017) · Network Neuroscience · doi:10.1162/netn_a_00034 · Cited by 61
Self-citationWeigard, A. S., Heathcote, A., Matzke, D., & Huang‐Pollock, C. L. (2019) · Clinical Psychological Science · doi:10.1177/2167702619838466 · Cited by 62
Claude, L.-A., Houenou, J., Duchesnay, É., & Favre, P. (2020) · Bipolar Disorders · doi:10.1111/bdi.12895 · Cited by 65
Orban, P., Dansereau, C. L., Desbois, L., Mongeau‐Pérusse, V., Giguère, C., Nguyen, H. D., Mendrek, A., Stip, É., & Bellec, P. (2017) · Schizophrenia Research · doi:10.1016/j.schres.2017.05.027 · Cited by 58
On the relation between person-oriented and subject-specific approaches
Molenaar, P. C. M. (2015) · Journal for Person-Oriented Research · doi:10.17505/jpor.2015.04 · Cited by 57
Self-citationNeurostructural Heterogeneity in Youth with Internalizing Symptoms
Kaczkurkin, A., Sotiras, A., Baller, E. B., Barzilay, R., Calkins, M., Chand, G., Cui, Z., Erus, G., Fan, Y., Gur, R., et al. (2019) · Biological Psychiatry · doi:10.1016/j.biopsych.2019.09.005 · Cited by 50
Systematic Review of Functional MRI Applications for Psychiatric Disease Subtyping
Miranda, L., Paul, R., Pütz, B., Koutsouleris, N., & Müller‐Myhsok, B. (2021) · Frontiers in Psychiatry · doi:10.3389/fpsyt.2021.665536 · Cited by 55
Association of Childhood Violence Exposure With Adolescent Neural Network Density
Goetschius, L. G., Hein, T. C., McLanahan, S., Jeanne Brooks-gunn, B., McLoyd, V. C., Dotterer, H. L., Lopez‐Duran, N. L., Mitchell, C. M., Hyde, L. W., Monk, C. S., et al. (2020) · JAMA Network Open · doi:10.1001/jamanetworkopen.2020.17850 · Cited by 53
Gao, Y., Linke, A. C., Keehn, R. J. J., Punyamurthula, S., Jahedi, A., Gates, K. M., Fishman, I., & Müller, R. (2019) · Autism Research · doi:10.1002/aur.2171 · Cited by 52
Self-citationLin, H., Cocchi, L., Zalesky, A., Lv, J., Perry, A., Tseng, W. I., Kundu, P., Breakspear, M. J., & Gau, S. S. (2018) · Psychological Medicine · doi:10.1017/s0033291718000028 · Cited by 49
Latent variable GIMME using model implied instrumental variables (MIIVs).
Gates, K. M., Fisher, Z. F., & Bollen, K. A. (2019) · Psychological Methods · doi:10.1037/met0000229 · Cited by 50
Self-citationClustering Vector Autoregressive Models: Capturing Qualitative Differences in Within-Person Dynamics
Bulteel, K., Tuerlinckx, F., Brose, A., & Ceulemans, E. (2016) · Frontiers in Psychology · doi:10.3389/fpsyg.2016.01540 · Cited by 49
Insights from Personalized Models of Brain and Behavior for Identifying Biomarkers in PsychiatryPreprint
Kraus, B. T., Zinbarg, R. E., Braga, R. M., Nusslock, R., Mittal, V. A., & Gratton, C. (2023) · PsyArXiv (OSF Preprints) · doi:10.1016/j.neubiorev.2023.105259 · Cited by 48
Kaczkurkin, A. N., Moore, T. M., Sotiras, A., Xia, C. H., Shinohara, R. T., & Satterthwaite, T. D. (2019) · Biological Psychiatry · doi:10.1016/j.biopsych.2019.12.015 · Cited by 42
Cai, D.-C., Wang, Z., Bo, T., Yan, S., Liu, Z., Liu, Z., Zeljic, K., Chen, X., Zhan, Y., Du, Y., et al. (2020) · Journal of Neuroscience · doi:10.1523/jneurosci.2727-19.2020 · Cited by 39
Anandakumar, J., Mills, K. L., Earl, E., Irwin, L., Miranda-Domínguez, Ó., Demeter, D. V., Walton-Weston, A., Karalunas, S. L., Nigg, J. T., & Fair, D. A. (2018) · Developmental Cognitive Neuroscience · doi:10.1016/j.dcn.2018.07.003 · Cited by 37
Self-citationWhole-brain estimates of directed connectivity for human connectomics
Frässle, S., Manjaly, Z. M., Tri, C., Kasper, L., Pruessmann, K. P., & Stephan, K. E. (2020) · NeuroImage · doi:10.1016/j.neuroimage.2020.117491 · Cited by 35
Network Structure among Brain Systems in Adult ADHD is Uniquely Modified by Stimulant Administration
Cary, R. P., Ray, S., Grayson, D. S., Painter, J. G., Carpenter, S. D., Maron, L. M., Sporns, O., Stevens, A. A., Nigg, J. T., & Fair, D. A. (2016) · Cerebral Cortex · doi:10.1093/cercor/bhw209 · Cited by 34
Self-citationAdvances, challenges, and promises in pediatric neuroimaging of neurodevelopmental disorders
Bednarz, H. M., & Kana, R. K. (2018) · Neuroscience & Biobehavioral Reviews · doi:10.1016/j.neubiorev.2018.03.025 · Cited by 36
Dajani, D. R., Burrows, C. A., Odriozola, P., Baez, A., Nebel, M. B., Mostofsky, S. H., & Uddin, L. Q. (2019) · NeuroImage: Clinical · doi:10.1016/j.nicl.2019.101678 · Cited by 33
“, 2015) and other large-scale brain networks (Gates et al., 2014).”
Phenomapping: Methods and Measures for Deconstructing Diagnosis in Psychiatry
Marquand, A. F., Wolfers, T., & Dinga, R. (2019) · Springer eBooks · doi:10.1007/978-3-030-03553-2_7 · Cited by 32
Capturing where the learning process takes place: A person-specific and person-centered primer
Saqr, M., Vogelsmeier, L. V. D. E., & López‐Pernas, S. (2024) · Learning and Individual Differences · doi:10.1016/j.lindif.2024.102492 · Cited by 32
Kyeong, S.-H., Kim, J., & Kim, E. J. (2017) · PLoS ONE · doi:10.1371/journal.pone.0182603 · Cited by 30
Specific patterns of brain alterations underlie distinct clinical profiles in Huntington's disease
Garcia‐Gorro, C., Llera, A., Martínez‐Horta, S., Pérez‐Pérez, J., Kulisevsky, J., Rodríguez‐Dechicha, N., Vaquer, I., Subirà, S., Calopa, M., Muñoz, E., et al. (2019) · NeuroImage Clinical · doi:10.1016/j.nicl.2019.101900 · Cited by 32
Li, T., van Rooij, D., Mota, N. R., Buitelaar, J. K., the ENIGMA ADHD Working Group, Hoogman, M., Vásquez, A. A., & Franke, B. (2021) · Journal of Child Psychology and Psychiatry · doi:10.1111/jcpp.13384 · Cited by 33
Correction of respiratory artifacts in MRI head motion estimatesPreprint
Fair, D. A., Miranda-Domínguez, Ó., Snyder, A. Z., Perrone, A. J., Earl, E., Van, A. N., Koller, J. M., Feczko, E., Klein, R. L., Mirro, A. E., et al. (2018) · bioRxiv (Cold Spring Harbor Laboratory) · doi:10.1101/337360 · Cited by 28
Self-citationImplementing Dynamic Assessments in Psychotherapy
Hopwood, C. J., Thomas, K. M., Luo, X., Bernard, N. K., Lin, Y., & Levendosky, A. A. (2016) · Assessment · doi:10.1177/1073191116649658 · Cited by 29
Causal search procedures for fMRI: review and suggestions
Henry, T. R., & Gates, K. M. (2016) · Behaviormetrika · doi:10.1007/s41237-016-0010-8 · Cited by 28
Self-citationUnsupervised classification reveals consistency and degeneracy in neural network patterns of emotion
Doyle, C. M., Lane, S., Brooks, J. A., Wilkins, R. W., Gates, K. M., & Lindquist, K. A. (2022) · Social Cognitive and Affective Neuroscience · doi:10.1093/scan/nsac028 · Cited by 30
Self-citationHasselman, F. (2022) · Frontiers in Physiology · doi:10.3389/fphys.2022.859127 · Cited by 27
Wang, L., & Miller, L. C. (2022) · JMIR Formative Research · doi:10.2196/37270 · Cited by 29
Clinically useful brain imaging for neuropsychiatry: How can we get there?
Milham, M. P., Craddock, R. C., & Klein, A. (2017) · Depression and Anxiety · doi:10.1002/da.22627 · Cited by 26
Contributions of default mode network stability and deactivation to adolescent task engagement
McCormick, E. M., & Telzer, E. H. (2018) · Scientific Reports · doi:10.1038/s41598-018-36269-4 · Cited by 30
Assessing the robustness of cluster solutions obtained from sparse count matrices.
Gates, K. M., Fisher, Z. F., Arizmendi, C., Henry, T. R., Duffy, K. A., & Mucha, P. J. (2019) · Psychological Methods · doi:10.1037/met0000204 · Cited by 26
Self-citationImaging-Based Subtyping for Psychiatric Syndromes
Ivleva, E. I., Türközer, H. B., & Sweeney, J. A. (2019) · Neuroimaging Clinics of North America · doi:10.1016/j.nic.2019.09.005 · Cited by 21
Matthews, M., & Fair, D. A. (2014) · Journal of Child Psychology and Psychiatry · doi:10.1111/jcpp.12335 · Cited by 21
Self-citationDajani, D. R., Burrows, C. A., Nebel, M. B., Mostofsky, S. H., Gates, K. M., & Uddin, L. Q. (2019) · Brain Connectivity · doi:10.1089/brain.2019.0669 · Cited by 23
Self-citationLipka, R., Ahlers, E., Reed, T. L., Karstens, M. I., Nguyen, V., Bajbouj, M., & Kadosh, R. C. (2020) · Experimental Neurology · doi:10.1016/j.expneurol.2020.113586 · Cited by 18
Cerliani, L., Thomas, R. M., Aquino, D., Contarino, V. E., & Bizzi, A. (2016) · Cortex · doi:10.1016/j.cortex.2016.11.017 · Cited by 18
Price, R. B., Beltz, A. M., Woody, M. L., Cummings, L. R., Gilchrist, D., & Siegle, G. J. (2020) · Clinical Psychological Science · doi:10.1177/2167702620906149 · Cited by 18
Weigard, A. S., Lane, S., Gates, K. M., & Beltz, A. M. (2021) · Psychological Methods · doi:10.1037/met0000460 · Cited by 20
Self-citationSubgrouping with Chain Graphical VAR Models
Park, J., Chow, S., Epskamp, S., & Molenaar, P. C. M. (2024) · Multivariate Behavioral Research · doi:10.1080/00273171.2023.2289058 · Cited by 13
Self-citationAttention‐Deficit/Hyperactivity Disorder
Nigg, J. T. (2017) · Wiley eBooks · doi:10.1002/9781394258932.ch13 · Cited by 14
Self-citationSex, Neural Networks, and Behavioral Symptoms Among Adolescents With Multisite Pain
Hidalgo-Lopez, E., Smith, T., Angstadt, M., Becker, H. C., Schrepf, A., Clauw, D. J., Harte, S., Heitzeg, M., Mindell, J., Kaplan, C., et al. (2025) · JAMA Network Open · doi:10.1001/jamanetworkopen.2025.5364 · Cited by 11
What Has Been Learned from Using EEG Methods in Research of ADHD?
McLoughlin, G., Gyurkovics, M., & Aydın, Ü. (2022) · Current topics in behavioral neurosciences · doi:10.1007/7854_2022_344 · Cited by 11
Mattoni, M., Smith, D. V., & Olino, T. M. (2023) · Network Neuroscience · doi:10.1162/netn_a_00306 · Cited by 11
McCormick, E. M., Gates, K. M., & Telzer, E. H. (2018) · NeuroImage · doi:10.1016/j.neuroimage.2018.12.042 · Cited by 14
Self-citationBu, X., Zhao, Y., Zheng, X., Fu, Z., Zhang, K., Sun, X., Cui, Z., Xia, M., Ma, L., Liu, N., et al. (2024) · bioRxiv (Cold Spring Harbor Laboratory) · doi:10.1101/2024.03.16.582202 · Cited by 10
Woody, M. L., Panny, B., Degutis, M., Griffo, A., & Price, R. B. (2021) · Behaviour Research and Therapy · doi:10.1016/j.brat.2021.103960 · Cited by 10
Stout, D. M., Harlé, K. M., Norman, S. B., Simmons, A. N., & Spadoni, A. D. (2021) · Psychological Medicine · doi:10.1017/s0033291721001513 · Cited by 9
Clinical subtyping using community detection: Limited utility?
van Rentergem, J. A. A., Bathelt, J., & Geurts, H. M. (2022) · International Journal of Methods in Psychiatric Research · doi:10.1002/mpr.1951 · Cited by 10
Gunther, K. E., Petrie, D. J., Pearce, A. L., Fuchs, B. A., Pérez‐Edgar, K. E., Keller, K., & Geier, C. F. (2022) · PsyArXiv (OSF Preprints) · doi:10.1016/j.neuropsychologia.2022.108313 · Cited by 9
Neural connectivity underlying adolescent social learning in sibling dyads
Rogers, C. R., Fry, C. M., Lee, T., Galvan, M., Gates, K. M., & Telzer, E. H. (2022) · Social Cognitive and Affective Neuroscience · doi:10.1093/scan/nsac025 · Cited by 10
Self-citationNeural activity and network analysis for understanding reasoning using the matrix reasoning task
Caudle, M. M., Spadoni, A. D., Schiehser, D. M., Simmons, A. N., & Bomyea, J. A. (2023) · Cognitive Processing · doi:10.1007/s10339-023-01152-2 · Cited by 9
Molenaar, P. C. M., & Beltz, A. M. (2020) · Cambridge University Press eBooks · doi:10.1017/9781316995808.031 · Cited by 8
Self-citationEvaluating Discrete Time Methods for Subgrouping Continuous Processes
Park, J., Fisher, Z. F., Chow, S., & Molenaar, P. C. M. (2023) · Multivariate Behavioral Research · doi:10.1080/00273171.2023.2235685 · Cited by 5
Self-citationBerner, L. A., Reilly, E. E., Yu, X., Krueger, A., Trunko, M. E., Anderson, L. K., Chen, J., Simmons, A. N., & Kaye, W. H. (2021) · Eating and Weight Disorders - Studies on Anorexia Bulimia and Obesity · doi:10.1007/s40519-021-01308-z · Cited by 7
Neuroimaging as a tool to study the sources of phenotypic heterogeneity in Huntington's disease
Garcia‐Gorro, C., Càmara, E., & de Diego‐Balaguer, R. (2017) · Current Opinion in Neurology · doi:10.1097/wco.0000000000000461 · Cited by 3
Weigard, A. S., Lane, S., Gates, K. M., & Beltz, A. M. (2020) · doi:10.31234/osf.io/frpvm · Cited by 3
Self-citationLatent Variable GIMME Using Model Implied Instrumental Variables (MIIVs)Preprint
Gates, K. M., Bollen, K. A., & Fisher, Z. F. (2019) · doi:10.31234/osf.io/kuedz · Cited by 3
Self-citationFunctional Connectivity Fingerprints of Emerging Reading Skill in the First Months of Schooling
Marks, R., Bouhali, F., Sun, X., Caballero, J. F., Kepinska, O., Uchikoshi, Y., Beltz, A., Kovelman, I., & Hoeft, F. (2026) · Developmental Science · doi:10.1111/desc.70142 · Cited by 2
Blind Subgrouping of Task-based FMRI
Fisher, Z. F., Parsons, J., Gates, K. M., & Hopfinger, J. B. (2023) · Psychometrika · doi:10.1007/s11336-023-09907-8 · Cited by 2
Self-citationFunctional MRI applications for psychiatric disease subtyping: a reviewPreprint
Miranda, L., Paul, R., Pütz, B., & Müller‐Myhsok, B. (2020) · arXiv (Cornell University) · doi:10.48550/arxiv.2007.00126 · Cited by 2
Höbler, F., Liu, Y., Beltz, A. M., Becker, H. C., Angstadt, M., Guenther, F. H., & Chang, S. (2025) · Neurobiology of Language · doi:10.1162/nol.a.26 · Cited by 1
Intensive Longitudinal Designs
Wright, A. G. C., & Hallquist, M. N. (2020) · Cambridge University Press eBooks · doi:10.1017/9781316995808.028 · Cited by 1
On Subgrouping Continuous Processes in Discrete TimePreprint
Park, J., Fisher, Z. F., Chow, S., & Molenaar, P. C. M. (2022) · doi:10.31234/osf.io/7zv8q · Cited by 1
Self-citationIdiographic Emotion Structures in Subjective Emotional Experiences
Danvers, A. F. (2017)
Fatimah, H. (2020) · Digital Commons - University of South Florida (University of South Florida)
Metadata
- Authors
- Gates, K. M., Molenaar, P. C. M., Iyer, S. P., Nigg, J. T., & Fair, D. A.
- Affiliations
- University of North Carolina at Chapel Hill (US)
- Pennsylvania State University (US)
- Oregon Health & Science University (US)
- Corresponding author
- Gates, Kathleen M.
- Venue
- PLoS ONE
- Publisher
- Public Library of Science (PLoS)
- Published
- 2014-03-18
- Volume
- 9
- Issue
- 3
- Pages
- e91322
- ISSN
- 1932-6203 (ISSN-L)
- PMC
- PMC3958357
- OpenAlex
- W2047219509
- Cited by
- 107
- References
- 58
- Citations by year
- 2026: 4 · 2025: 2 · 2024: 5 · 2023: 6 · 2022: 12 · 2021: 6 · 2020: 14 · 2019: 17 · 2018: 9 · 2017: 14 · 2016: 9 · 2015: 6 · 2014: 3
- FWCI
- 5.95
- Type
- journal article
- Language
- en
- Open access
- gold
- doi.org
- Locations
- PLoS ONE (publishedVersion, cc-by)
- Europe PMC (PubMed Central) (publishedVersion, other-oa)
- PubMed Central (publishedVersion, cc-by)
- PubMed (publishedVersion)
- Carolina Digital Repository (University of North Carolina at Chapel Hill) (submittedVersion)
- RePEc: Research Papers in Economics (submittedVersion)
- DOAJ (DOAJ: Directory of Open Access Journals) (submittedVersion)
- UNC Libraries
- Funders
- National Science Foundation (1157220)
- National Institutes of Health (1157220, K99-R00, K99/R00 MH091238, MH091238)
- Oregon Clinical and Translational Research Institute
- National Institute of Mental Health (K99/R00 MH091238, K99MH091238, R01MH115357, R01 MH86654, R00MH091238, R01MH096773, R01MH086654)
- National Institute of Biomedical Imaging and Bioengineering (R21EB015573)
- Topics
- Life Sciences › Neuroscience › Cognitive Neuroscience › Functional Brain Connectivity Studies
- Social Sciences › Psychology › Experimental and Cognitive Psychology › Mental Health Research Topics
- Health Sciences › Medicine › Psychiatry and Mental health › Attention Deficit Hyperactivity Disorder
- Keywords
- group iterative multiple model estimation, directed functional connectivity, resting-state networks, community detection, modularity, patient heterogeneity, subgroup identification, attention deficit hyperactivity disorder, children, frontoparietal connectivity, biomarkers, neuropsychiatric disorders
- MeSH terms
- Attention Deficit Disorder with Hyperactivity, Brain Mapping, Child, Computer Simulation, Female, Frontal Lobe, Humans, Magnetic Resonance Imaging, Male, Neural Pathways, Parietal Lobe, Residence Characteristics, Models, Statistical, Biomarkers, Case-Control Studies, Genetic Heterogeneity, Gene-Environment Interaction
About these checks
Registry, retraction, Cites and statistics results are computed, not judged, with one exception: a printed reference that no index lists is read once by a model before it counts as a citation error. Claims are extracted by a model and kept only when their quote appears verbatim in the text; each cited source is then checked, with a model’s help, for whether it says what the claim relies on. Those verdicts can be wrong — read the claim’s quote and the cited source before relying on one.
A language model drew the claims from the paper on 2026-10-06, under version 3 of the claim definition (model deepseek-v4.1-flash, prompt extract-v3).
A second model labelled each claim on 2026-10-06 (model jev-1.13-20260917, definition revision gold-guideline-v0.2).
Statistics and arithmetic are recomputed, not judged.
Confidence bands are shown only for fields calibrated on our annotated test set. None is calibrated yet, so no band is shown.
What counts as a claim ›How we measure confidence ›How we check this ›
Are you an author, or do you see a problem with this page? Request a review
