

The DOI matches its Crossref record; 14 of the 14 references it cites were found in a registry or an index.
Myeloid-Specific Rictor Deletion Induces M1 Macrophage Polarization and Potentiates In Vivo Pro-Inflammatory Response to Lipopolysaccharide
Overview
The claims and statistics of this paper haven’t been checked yet.
Run the check — free, no account needed. It reads the open-access text and checks the sources it cites.
Integrity signals
Registry
Cites
Statistics
Figures
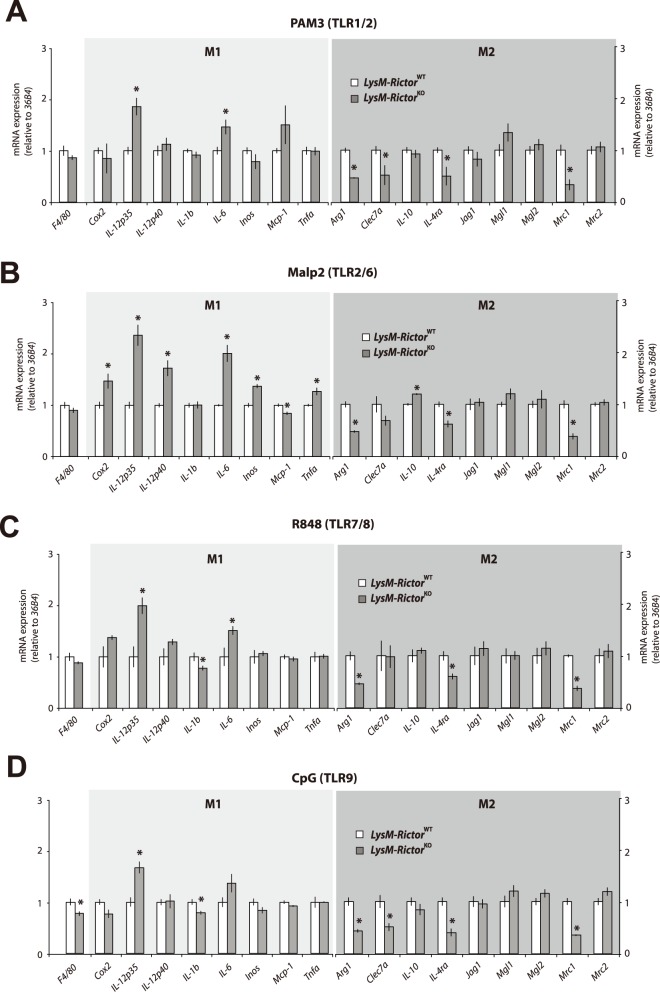
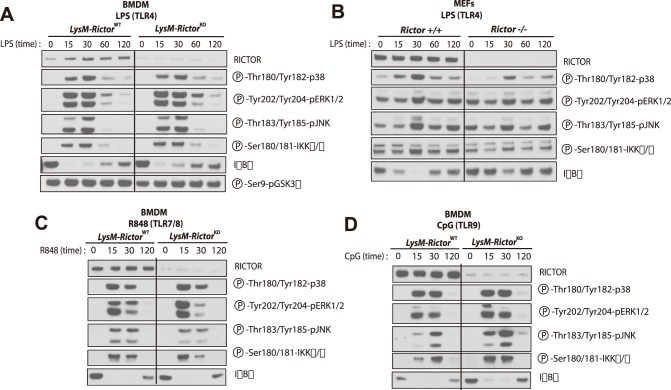
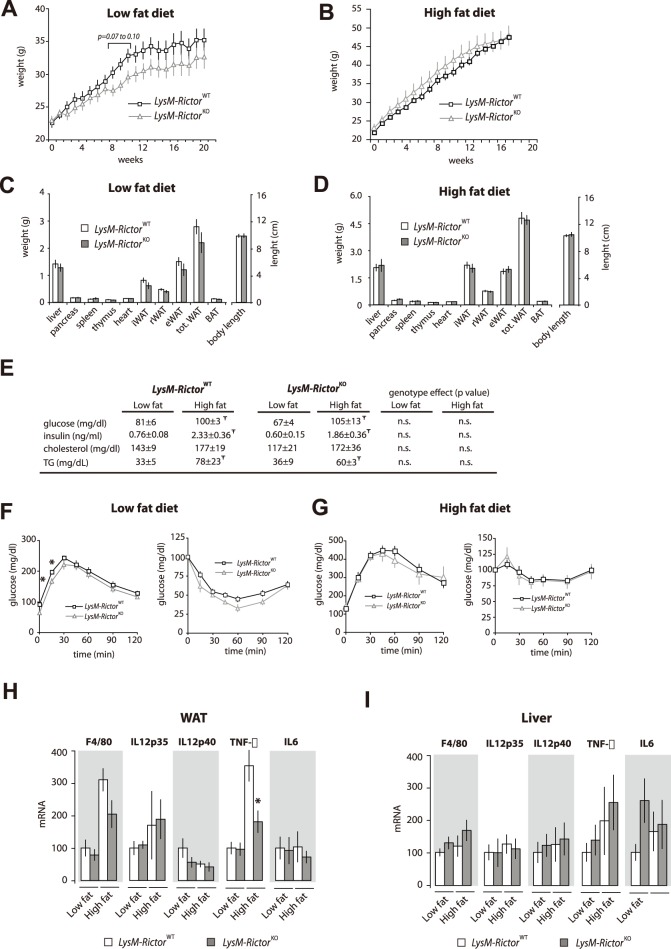
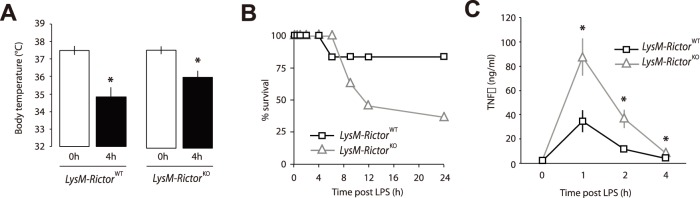
Verification
Claims the paper makes
The claims and statistics of this paper haven’t been checked yet.
Run the check — free, no account needed. It reads the open-access text and checks the sources it cites.
Claims other papers make about this one
Each is checked against this paper’s own text: does it say what the citing paper says it does?
The source backs part of the claim, not all of it — or backs it for a different population, condition or comparison.
In the citing paper
“Finally, mTORC2 has been shown in a number of studies to play a key role in immunity and wound repair 121–127”
From Targeting the biology of aging with mTOR inhibitors (2023) · cites this paper as [122]
Experimental — accuracy not yet measured
Self-check
Percentages, sums and reported differences re-computed from the paper’s own numbers.
The self-check needs the paper’s full text.
Citations
Cites
Phosphorylation and regulation of Akt/PKB by the rictor-mTOR complex
Sarbassov, D. D., Guertin, D. A., Ali, S. M., & Sabatini, D. M. (2005) · Science · doi:10.1126/science.1106148 · Cited by 6,216
Self-citationThe phosphoinositide 3-kinase pathway
Cantley, L. C. (2002) · Science · doi:10.1126/science.296.5573.1655 · Cited by 5,621
Protective and pathogenic functions of macrophage subsets
Murray, P. J., & Wynn, T. A. (2011) · Nature Reviews Immunology · doi:10.1038/nri3073 · Cited by 5,269
Obesity induces a phenotypic switch in adipose tissue macrophage polarization
Lumeng, C. N., Bodzin, J. L., & Saltiel, A. R. (2007) · Journal of Clinical Investigation · doi:10.1172/jci29881 · Cited by 4,664
Adipokines in inflammation and metabolic disease
Ouchi, N., Parker, J. L., Lugus, J. J., & Walsh, K. (2011) · Nature Reviews Immunology · doi:10.1038/nri2921 · Cited by 4,625
mTOR: from growth signal integration to cancer, diabetes and ageing
Zoncu, R., Efeyan, A., & Sabatini, D. M. (2011) · Nature Reviews Molecular Cell Biology · doi:10.1038/nrm3025 · Cited by 3,941
Self-citationTLR4 links innate immunity and fatty acid-induced insulin resistance
Shi, H., Kokoeva, M. V., Inouye, K., Tzameli, I., Yin, H., & Flier, J. S. (2006) · Journal of Clinical Investigation · doi:10.1172/jci28898 · Cited by 3,690
Obesity-induced inflammatory changes in adipose tissue
Wellen, K. E., & Hotamisligil, G. S. (2003) · Journal of Clinical Investigation · doi:10.1172/jci200320514 · Cited by 1,823
The nuts and bolts of AGC protein kinases
Pearce, L. R., Komander, D., & Alessi, D. R. (2010) · Nature Reviews Molecular Cell Biology · doi:10.1038/nrm2822 · Cited by 1,294
Calnan, D. R., & Brunet, A. (2008) · Oncogene · doi:10.1038/onc.2008.21 · Cited by 1,170
Research works printed but not linked: 44
- S Gordon, 2003, Alternative activation of macrophages, Nat Rev Immunol, 3, 23, 10.1038/nri978 · DOI · Paper page
- T Kawai, 2010, The role of pattern-recognition receptors in innate immunity: update on Toll-like receptors, Nat Immunol, 11, 373, 10.1038/ni.1863 · DOI · Paper page
- LA O’Neill, 2009, Therapeutic targeting of Toll-like receptors for infectious and inflammatory diseases and cancer, Pharmacol Rev, 61, 177, 10.1124/pr.109.001073 · DOI
- JM Olefsky, 2010, Macrophages, inflammation, and insulin resistance, Annu Rev Physiol, 72, 219, 10.1146/annurev-physiol-021909-135846 · DOI · Paper page
- JA Engelman, 2006, The Role of the ErbB Family Members in Non-Small Cell “Lung Cancers Sensitive to Epidermal Growth Factor Receptor Kinase Inhibitors”, Clin Cancer Res, 12, 4372s, 10.1158/1078-0432.CCR-06-0795 · DOI
- BD Manning, 2007, AKT/PKB signaling: navigating downstream, Cell, 129, 1261, 10.1016/j.cell.2007.06.009 · DOI · Paper page
- J Brown, 2011, TLR-signaling networks: an integration of adaptor molecules, kinases, and cross-talk, J Dent Res, 90, 417, 10.1177/0022034510381264 · DOI
- K Hazeki, 2007, Role of phosphoinositide 3-kinase in innate immunity, Biol Pharm Bull, 30, 1617, 10.1248/bpb.30.1617 · DOI
- TD Troutman, 2012, Toll-like receptors, signaling adapters and regulation of the pro-inflammatory response by PI3K, Cell Cycle, 11, 3559, 10.4161/cc.21572 · DOI
- TD Troutman, 2012, Role for B-cell adapter for PI3K (BCAP) as a signaling adapter linking Toll-like receptors (TLRs) to serine/threonine kinases PI3K/Akt, Proc Natl Acad Sci U S A, 109, 273, 10.1073/pnas.1118579109 · DOI
- L Arbibe, 2000, Toll-like receptor 2-mediated NF-kappa B activation requires a Rac1-dependent pathway, Nat Immunol, 1, 533, 10.1038/82797 · DOI
- SN Sarkar, 2004, Novel roles of TLR3 tyrosine phosphorylation and PI3 kinase in double-stranded RNA signaling, Nat Struct Mol Biol, 11, 1060, 10.1038/nsmb847 · DOI
- SH Rhee, 2006, Role of MyD88 in phosphatidylinositol 3-kinase activation by flagellin/toll-like receptor 5 engagement in colonic epithelial cells, J Biol Chem, 281, 18560, 10.1074/jbc.M513861200 · DOI · Paper page
- M Ni, 2012, B-cell adaptor for PI3K (BCAP) negatively regulates Toll-like receptor signaling through activation of PI3K, Proc Natl Acad Sci U S A, 109, 267, 10.1073/pnas.1111957108 · DOI
- J Brown, 2011, Mammalian target of rapamycin complex 2 (mTORC2) negatively regulates Toll-like receptor 4-mediated inflammatory response via FoxO1, J Biol Chem, 286, 44295, 10.1074/jbc.M111.258053 · DOI
- VA McGuire, 2013, Cross Talk between the Akt and p38alpha Pathways in Macrophages Downstream of Toll-Like Receptor Signaling, Mol Cell Biol, 33, 4152, 10.1128/MCB.01691-12 · DOI
- M Ojaniemi, 2003, Phosphatidylinositol 3-kinase is involved in Toll-like receptor 4-mediated cytokine expression in mouse macrophages, Eur J Immunol, 33, 597, 10.1002/eji.200323376 · DOI
- B Chaurasia, 2010, Phosphoinositide-dependent kinase 1 provides negative feedback inhibition to Toll-like receptor-mediated NF-kappaB activation in macrophages, Mol Cell Biol, 30, 4354, 10.1128/MCB.00069-10 · DOI
- A Arranz, 2012, Akt1 and Akt2 protein kinases differentially contribute to macrophage polarization, Proc Natl Acad Sci U S A, 109, 9517, 10.1073/pnas.1119038109 · DOI
- M Laplante, 2012, mTOR signaling in growth control and disease, Cell, 149, 274, 10.1016/j.cell.2012.03.017 · DOI · Paper page
- DA Guertin, 2006, Ablation in mice of the mTORC components raptor, rictor, or mLST8 reveals that mTORC2 is required for signaling to Akt-FOXO and PKCalpha, but not S6K1, Dev Cell, 11, 859, 10.1016/j.devcel.2006.10.007 · DOI
- C Shiota, 2006, Multiallelic disruption of the rictor gene in mice reveals that mTOR complex 2 is essential for fetal growth and viability, Dev Cell, 11, 583, 10.1016/j.devcel.2006.08.013 · DOI
- BE Clausen, 1999, Conditional gene targeting in macrophages and granulocytes using LysMcre mice, Transgenic Res, 8, 265, 10.1023/A:1008942828960 · DOI · Paper page
- DR Alessi, 1997, Characterization of a 3-phosphoinositide-dependent protein kinase which phosphorylates and activates protein kinase Balpha, Curr Biol, 7, 261, 10.1016/S0960-9822(06)00122-9 · DOI
- JM Garcia-Martinez, 2008, mTOR complex 2 (mTORC2) controls hydrophobic motif phosphorylation and activation of serum- and glucocorticoid-induced protein kinase 1 (SGK1), Biochem J, 416, 375, 10.1042/BJ20081668 · DOI · Paper page
- E Jacinto, 2006, SIN1/MIP1 maintains rictor-mTOR complex integrity and regulates Akt phosphorylation and substrate specificity, Cell, 127, 125, 10.1016/j.cell.2006.08.033 · DOI
- R Cancello, 2006, Increased infiltration of macrophages in omental adipose tissue is associated with marked hepatic lesions in morbid human obesity, Diabetes, 55, 1554, 10.2337/db06-0133 · DOI · Paper page
- H Xu, 2003, Chronic inflammation in fat plays a crucial role in the development of obesity-related insulin resistance, J Clin Invest, 112, 1821, 10.1172/JCI200319451 · DOI · Paper page
- GS Habicht, 1981, Body temperature in normal and endotoxin-treated mice of different ages, Mech Ageing Dev, 16, 97, 10.1016/0047-6374(81)90037-3 · DOI
- F Bauss, 1987, Tumor necrosis factor mediates endotoxic effects in mice, Infect Immun, 55, 1622, 10.1128/IAI.55.7.1622-1625.1987 · DOI
- M Martin, 2005, Toll-like receptor-mediated cytokine production is differentially regulated by glycogen synthase kinase 3, Nat Immunol, 6, 777, 10.1038/ni1221 · DOI
- W Fan, 2010, FoxO1 regulates Tlr4 inflammatory pathway signalling in macrophages, EMBO J, 29, 4223, 10.1038/emboj.2010.268 · DOI
- MF Siqueira, 2010, Impaired wound healing in mouse models of diabetes is mediated by TNF-alpha dysregulation and associated with enhanced activation of forkhead box O1 (FOXO1), Diabetologia, 53, 378, 10.1007/s00125-009-1529-y · DOI
- D Su, 2009, FoxO1 links insulin resistance to proinflammatory cytokine IL-1beta production in macrophages, Diabetes, 58, 2624, 10.2337/db09-0232 · DOI
- Y Kawano, 2012, Loss of Pdk1-Foxo1 signaling in myeloid cells predisposes to adipose tissue inflammation and insulin resistance, Diabetes, 61, 1935, 10.2337/db11-0770 · DOI
- R Cancello, 2006, Is obesity an inflammatory illness? Role of low-grade inflammation and macrophage infiltration in human white adipose tissue, Bjog, 113, 1141, 10.1111/j.1471-0528.2006.01004.x · DOI · Paper page
- K Cusi, 2010, The role of adipose tissue and lipotoxicity in the pathogenesis of type 2 diabetes, Curr Diab Rep, 10, 306, 10.1007/s11892-010-0122-6 · DOI
- SP Weisberg, 2003, Obesity is associated with macrophage accumulation in adipose tissue, J Clin Invest, 112, 1796, 10.1172/JCI200319246 · DOI · Paper page
- GS Hotamisligil, 2006, Inflammation and metabolic disorders, Nature, 444, 860, 10.1038/nature05485 · DOI · Paper page
- V Hietakangas, 2007, Re-evaluating AKT regulation: role of TOR complex 2 in tissue growth, Genes Dev, 21, 632, 10.1101/gad.416307 · DOI
- JP Luyendyk, 2008, Genetic analysis of the role of the PI3K-Akt pathway in lipopolysaccharide-induced cytokine and tissue factor gene expression in monocytes/macrophages, J Immunol, 180, 4218, 10.4049/jimmunol.180.6.4218 · DOI
- G Schabbauer, 2004, PI3K-Akt pathway suppresses coagulation and inflammation in endotoxemic mice, Arterioscler Thromb Vasc Biol, 24, 1963, 10.1161/01.ATV.0000143096.15099.ce · DOI
- B Zou, 2012, Timing of insulin therapy affects the inflammatory response in endotoxemic rats, Inflammation, 35, 723, 10.1007/s10753-011-9367-8 · DOI
- MG Jeschke, 2004, Insulin attenuates the systemic inflammatory response in endotoxemic rats, Endocrinology, 145, 4084, 10.1210/en.2004-0592 · DOI
Cited by
Sorted by citations
Macrophage activation and polarization: nomenclature and experimental guidelines
Murray, P. J., Allen, J. E., Biswas, S. K., Fisher, E. A., Gilroy, D. W., Goerdt, S., Gordon, S., Hamilton, J. A., Ivashkiv, L. B., Lawrence, T., et al. (2014) · Immunity · doi:10.1016/j.immuni.2014.06.008 · Cited by 6,337
Akt Signaling Pathway in Macrophage Activation and M1/M2 Polarization
Vergadi, E., Ieronymaki, E., Lyroni, K., Vaporidi, K., & Tsatsanis, C. (2017) · The Journal of Immunology · doi:10.4049/jimmunol.1601515 · Cited by 1,148
The mechanistic target of rapamycin: the grand conducTOR of metabolism and aging
Kennedy, B. K., & Lamming, D. W. (2016) · Cell Metabolism · doi:10.1016/j.cmet.2016.05.009 · Cited by 544
Insulin resistance causes inflammation in adipose tissue
Shimobayashi, M., Albert, V., Woelnerhanssen, B., Frei, I. C., Weissenberger, D., Meyer-Gerspach, A. C., Clement, N., Moes, S., Colombi, M., Meier, J. A., et al. (2018) · Journal of Clinical Investigation · doi:10.1172/jci96139 · Cited by 480
Targeting the biology of aging with mTOR inhibitors
Mannick, J. B., & Lamming, D. W. (2023) · Nature Aging · doi:10.1038/s43587-023-00416-y · Cited by 372
Arriola Apelo, S. I., Neuman, J. C., Baar, E. L., Syed, F. A., Cummings, N. E., Brar, H. K., Pumper, C. P., Kimple, M. E., & Lamming, D. W. (2016) · Aging Cell · doi:10.1111/acel.12405 · Cited by 182
“…al., 2012, 2013a). mTORC2 has also recently been shown to have an important role in promoting immune function, which suggests that the immunosuppressive effects of rapamycin may be due in part to the inhibition of mTORC2 signaling (Powell et al., 2012; Byles et al., 2013; Festuccia et al., 2014).”
BackgroundGab2 and Gab3 Redundantly Suppress Colitis by Modulating Macrophage and CD8+ T-Cell Activation
Wang, Z., Vaughan, T. Y., Zhu, W., Chen, Y., Fu, G., Medrzycki, M., Nishio, H., Bunting, S. T., Hankey-Giblin, P. A., Nusrat, A., et al. (2019) · Frontiers in Immunology · doi:10.3389/fimmu.2019.00486 · Cited by 18
mTORC2 deficiency alters the metabolic profile of conventional dendritic cells
Watson, A. R., Dai, H., Zheng, Y., Nakano, R., Giannou, A. D., Menk, A. V., Stolz, D. B., Delgoffe, G. M., & Thomson, A. W. (2019) · Frontiers in Immunology · doi:10.3389/fimmu.2019.01451 · Cited by 15
Metadata
- Authors
- Festuccia, W. T., Pouliot, P., Bakan, I., Sabatini, D. M., & Laplante, M.
- Venue
- PLoS ONE
- Publisher
- Public Library of Science (PLoS)
- Published
- 2014-04-16
- Volume
- 9
- Issue
- 4
- Pages
- e95432
- ISSN
- 1932-6203
- PMC
- PMC3989321
- Cited by
- 103
- References
- 14
- Language
- en
About these checks
Registry, retraction, Cites and statistics results are computed, not judged, with one exception: a printed reference that no index lists is read once by a model before it counts as a citation error. Claims are extracted by a model and kept only when their quote appears verbatim in the text; each cited source is then checked, with a model’s help, for whether it says what the claim relies on. Those verdicts can be wrong — read the claim’s quote and the cited source before relying on one.
Statistics and arithmetic are recomputed, not judged.
Confidence bands are shown only for fields calibrated on our annotated test set. None is calibrated yet, so no band is shown.
What counts as a claim ›How we measure confidence ›How we check this ›
Are you an author, or do you see a problem with this page? Request a review
