

The DOI matches its Crossref record; 55 of the 55 references it cites were found in a registry or an index; none of the 35 sources its claims cite is checked for support yet.
Nitrate Reduction to Nitrite, Nitric Oxide and Ammonia by Gut Bacteria under Physiological Conditions
Open accessAbstract
The biological nitrogen cycle involves step-wise reduction of nitrogen oxides to ammonium salts and oxidation of ammonia back to nitrites and nitrates by plants and bacteria. Neither process has been thought to have relevance to mammalian physiology; however in recent years the salivary bacterial reduction of nitrate to nitrite has been recognized as an important metabolic conversion in humans. Several enteric bacteria have also shown the ability of catalytic reduction of nitrate to ammonia via nitrite during dissimilatory respiration; however, the importance of this pathway in bacterial species colonizing the human intestine has been little studied. We measured nitrite, nitric oxide (NO) and ammonia formation in cultures of Escherichia coli, Lactobacillus and Bifidobacterium species grown at different sodium nitrate concentrations and oxygen levels. We found that the presence of 5 mM nitrate provided a growth benefit and induced both nitrite and ammonia generation in E.coli and L.plantarum bacteria grown at oxygen concentrations compatible with the content in the gastrointestinal tract. Nitrite and ammonia accumulated in the growth medium when at least 2.5 mM nitrate was present. Time-course curves suggest that nitrate is first converted to nitrite and subsequently to ammonia. Strains of L.rhamnosus, L.acidophilus and B.longum infantis grown with nitrate produced minor changes in nitrite or ammonia levels in the cultures. However, when supplied with exogenous nitrite, NO gas was readily produced independently of added nitrate. Bacterial production of lactic acid causes medium acidification that in turn generates NO by non-enzymatic nitrite reduction. In contrast, nitrite was converted to NO by E.coli cultures even at neutral pH. We suggest that the bacterial nitrate reduction to ammonia, as well as the related NO formation in the gut, could be an important aspect of the overall mammalian nitrate/nitrite/NO metabolism and is yet another way in which the microbiome links diet and health.
Overview
AI snapshot
Written from the paper’s full text.
TL;DR
In vitro cultures of common gut bacteria show that nitrate can be reduced first to nitrite and then to ammonia under oxygen and nitrate conditions relevant to the gastrointestinal tract. E. coli and L. plantarum were the main nitrate reducers, while lactic acid bacteria also generated NO from nitrite largely through acid-driven non-enzymatic reduction.
Key findings
- E. coli and L. plantarum grown with 5 mM nitrate at low oxygen showed a growth benefit and produced nitrite and ammonia; nitrite and ammonia accumulated when nitrate was at least 2.5 mM, reaching about 260 μM NO2− and 180 μM NH4+ in E. coli media at 5–20 mM nitrate.
- Time-course experiments at 2% O2 with 5 mM nitrate suggested nitrate is first converted to nitrite and subsequently to ammonia; nitrite peaked at 30–36 h at about 0.4 mM for E. coli and 0.1 mM for L. plantarum.
- L. rhamnosus, L. acidophilus and B. longum infantis showed minor changes in nitrite or ammonia with nitrate, but all LAB cultures produced NO from exogenous nitrite; LAB lactic acid acidified the medium and drove non-enzymatic nitrite reduction to NO, whereas E. coli converted nitrite to NO even at neutral pH.
- E. coli NO production from nitrite was low at 2% O2 (<40 ppb/109 CFU) and much larger after anaerobic growth, roughly correlating with increasing nitrate; arginine and L-NAME did not change NO production, arguing against bacterial NOS activity.
Methods
- In vitro cultures of E. coli (MG1655 in Results; Table 1 lists MG1566), L. acidophilus ATCC 4356, L. plantarum ATCC BAA-793 (WCFS1), L. rhamnosus ATCC 7469, and B. longum infantis ATCC 15697 were grown at 37°C in modified LMRS broth without ammonium citrate, with controlled O2 levels from 0% to 21% and nitrate from 0 to 20 mM; LAB were supplemented with heme and vitamin K2.
- Nitrite was measured by acidic tri-iodide-based gas-phase chemiluminescence, ammonia by colorimetric kits, NO gas by ozone-based chemiluminescence, and lactic acid enzymatically.
- Experiments were performed in triplicate, values reported as mean ± SD, nitrite and ammonia normalized to OD600 after 24 h growth, and one-way ANOVA used where applicable.
Limitations
- The paper states that the importance of this pathway in vivo demands further studies, that how much ammonia comes from nitrate-nitrite reduction versus deamination or urease activity requires detailed animal and/or human metabolic studies, and that the biological significance of dietary nitrate conversion in the intestinal lumen remains to be established.
- The paper notes that very little information exists on in vivo O2 concentrations in intestinal fluids, so the oxygen conditions used are approximations of gastrointestinal levels.
- Evident from the text: findings are from in vitro single-strain cultures, not complex gut communities or host tissue; ammonia measurements in cell pellets had large errors and possible ammonia evaporation, leading the authors to measure nitrate metabolites mainly in cell-free supernatant.
Model-written summary. Check it against the paper before relying on it.
Integrity signals
Registry
Cites
Statistics
Figures
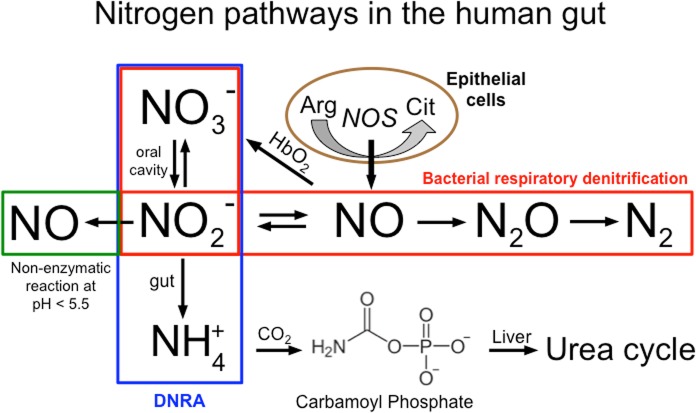
Verification
Claims the paper makes
41 Own result · 21 Not checked yet · 10 Own interpretation · 3 No basis given
A result the paper reports from its own data — it cites no other source for it, so there is none to check. The quote shows it is in the paper.
In the paper
“We found that the presence of 5 mM nitrate provided a growth benefit and induced both nitrite and ammonia generation in E.coli and L.plantarum bacteria grown at oxygen concentrations compatible with the content in the gastrointestinal tract.”
§ Nitrate Reduction to Nitrite, Nitric Oxide and Ammonia by Gut Bacteria under Physiological Conditions > Abstract
plaindirect- Asserted: passes — The authors put it forward as true.
- Checkable: passes — It can be checked against evidence.
- Load-bearing: passes — The paper’s conclusions depend on it.
- Based: passes — The paper gives a reason why it holds.
- Rests on an assumption: The O2 level of 2% used in some experiments is similar to the partial pressure found on the luminal surface of the intestinal mucosa.
A result the paper reports from its own data — it cites no other source for it, so there is none to check. The quote shows it is in the paper.
In the paper
“In contrast, nitrite was converted to NO by E.coli cultures even at neutral pH.”
§ Nitrate Reduction to Nitrite, Nitric Oxide and Ammonia by Gut Bacteria under Physiological Conditions > Abstract
plaindirect- Asserted: passes — The authors put it forward as true.
- Checkable: passes — It can be checked against evidence.
- Load-bearing: passes — The paper’s conclusions depend on it.
- Based: passes — The paper gives a reason why it holds.
A result the paper reports from its own data — it cites no other source for it, so there is none to check. The quote shows it is in the paper.
In the paper
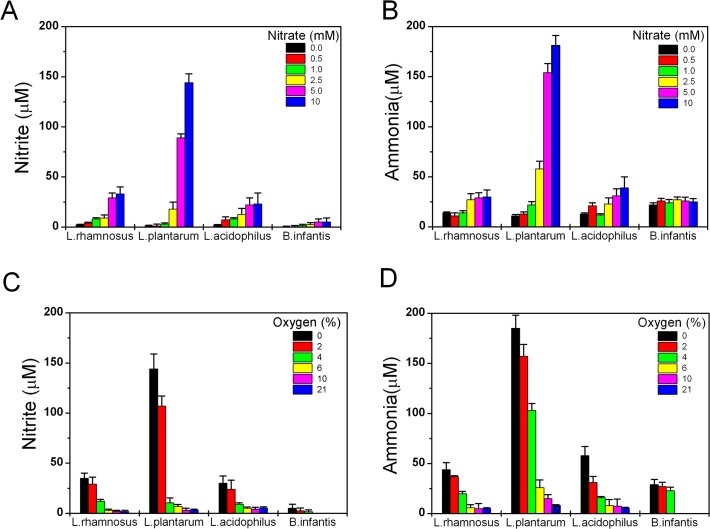
“Nitrate concentrations equal to or above 2.5 mM had a significant effect on nitrite and ammonia production only in the L.plantarum cultures.”
§ Nitrate Reduction to Nitrite, Nitric Oxide and Ammonia by Gut Bacteria under Physiological Conditions > Results > Nitrate reduction by lactic acid bacteria cultures
plaindirect- Asserted: passes — The authors put it forward as true.
- Checkable: passes — It can be checked against evidence.
- Load-bearing: passes — The paper’s conclusions depend on it.
- Based: passes — The paper gives a reason why it holds.
- Rests on an assumption: The O2 level of 2% used in some experiments is similar to the partial pressure found on the luminal surface of the intestinal mucosa.
The paper states this without a source or data behind it here, so there is nothing to check it against. The quote shows it is in the paper.
In the paper
“However, when supplied with exogenous nitrite, NO gas was readily produced independently of added nitrate.”
§ Nitrate Reduction to Nitrite, Nitric Oxide and Ammonia by Gut Bacteria under Physiological Conditions > Abstract
plaindirect- Asserted: passes — The authors put it forward as true.
- Checkable: passes — It can be checked against evidence.
- Load-bearing: passes — The paper’s conclusions depend on it.
- Based: passes — The paper gives a reason why it holds.
A result the paper reports from its own data — it cites no other source for it, so there is none to check. The quote shows it is in the paper.
In the paper
“We found that the presence of 5 mM nitrate provided a growth benefit and induced both nitrite and ammonia generation in E.coli and L.plantarum bacteria grown at oxygen concentrations compatible with the content in the gastrointestinal tract.”
§ Nitrate Reduction to Nitrite, Nitric Oxide and Ammonia by Gut Bacteria under Physiological Conditions > Abstract
plaindirect- Asserted: passes — The authors put it forward as true.
- Checkable: passes — It can be checked against evidence.
- Load-bearing: passes — The paper’s conclusions depend on it.
- Based: passes — The paper gives a reason why it holds.
- Rests on an assumption: The O2 level of 2% used in some experiments is similar to the partial pressure found on the luminal surface of the intestinal mucosa.
A result the paper reports from its own data — it cites no other source for it, so there is none to check. The quote shows it is in the paper.
In the paper
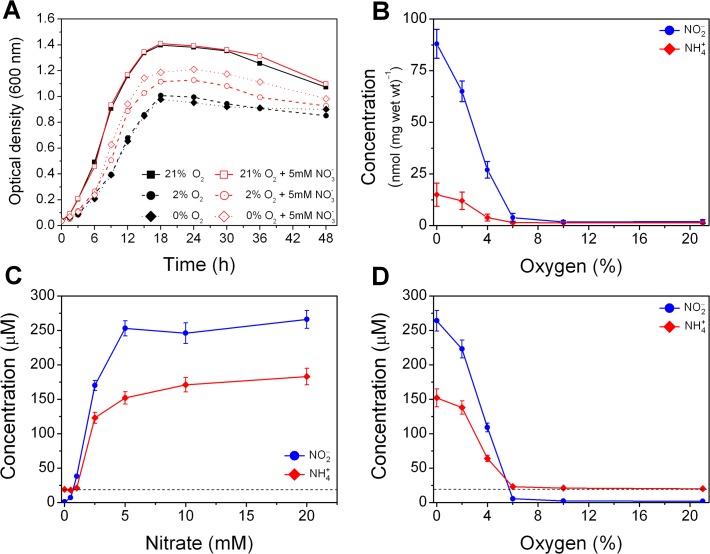
“The presence of 5 mM nitrate provided a clear growth benefit to E.coli cultures maintained at 2% O2 or in anaerobic conditions (red lines with open symbols) and partially restored the growth to levels found in the aerobic conditions.”
§ Nitrate Reduction to Nitrite, Nitric Oxide and Ammonia by Gut Bacteria under Physiological Conditions > Results > Effect of nitrate and oxygen on the growth patterns of E.coli in LMRS
boosteddirect- Asserted: passes — The authors put it forward as true.
- Checkable: passes — It can be checked against evidence.
- Load-bearing: passes — The paper’s conclusions depend on it.
- Based: passes — The paper gives a reason why it holds.
A result the paper reports from its own data — it cites no other source for it, so there is none to check. The quote shows it is in the paper.
In the paper
“Nitrite and ammonia concentrations remained steady when nitrate concentrations were lower or equal to 1.0 mM.”
§ Nitrate Reduction to Nitrite, Nitric Oxide and Ammonia by Gut Bacteria under Physiological Conditions > Results > Effect of oxygen on E.coli production of nitrite and ammonia from nitrate
plain- Asserted: passes — The authors put it forward as true.
- Checkable: passes — It can be checked against evidence.
- Load-bearing: passes — The paper’s conclusions depend on it.
- Based: passes — The paper gives a reason why it holds.
A result the paper reports from its own data — it cites no other source for it, so there is none to check. The quote shows it is in the paper.
In the paper
“Strains of L.rhamnosus, L.acidophilus and B.longum infantis grown with nitrate produced minor changes in nitrite or ammonia levels in the cultures.”
§ Nitrate Reduction to Nitrite, Nitric Oxide and Ammonia by Gut Bacteria under Physiological Conditions > Abstract
plain- Asserted: passes — The authors put it forward as true.
- Checkable: passes — It can be checked against evidence.
- Load-bearing: unclear — It is unclear whether the paper’s conclusions depend on it.
- Based: passes — The paper gives a reason why it holds.
A result the paper reports from its own data — it cites no other source for it, so there is none to check. The quote shows it is in the paper.
In the paper
“Lysis by brief sonication in fresh media of the LAB cells to extract the cytosolic enzymes did not restored the generation of NO after injection of nitrite.”
§ Nitrate Reduction to Nitrite, Nitric Oxide and Ammonia by Gut Bacteria under Physiological Conditions > Results > NO production by bacterial cell suspensions
plain- Asserted: passes — The authors put it forward as true.
- Checkable: passes — It can be checked against evidence.
- Load-bearing: passes — The paper’s conclusions depend on it.
- Based: passes — The paper gives a reason why it holds.
A result the paper reports from its own data — it cites no other source for it, so there is none to check. The quote shows it is in the paper.
In the paper
“1) E.coli, a facultative anaerobe, convert nitrate to nitrite and subsequently to ammonia which progressively accumulates in culture media”
§ Nitrate Reduction to Nitrite, Nitric Oxide and Ammonia by Gut Bacteria under Physiological Conditions > Discussion
plaindirect- Asserted: passes — The authors put it forward as true.
- Checkable: passes — It can be checked against evidence.
- Load-bearing: passes — The paper’s conclusions depend on it.
- Based: passes — The paper gives a reason why it holds.
- It may state two separate claims as one. 32
- The quote only partly states this claim. 2
- Probably not a substantial claim. 6
A result the paper reports from its own data — it cites no other source for it, so there is none to check. The quote shows it is in the paper.
In the paper
“However when the O2 tension was 4% or lower nitrite and ammonia were both generated and excreted in the media and reached the highest concentrations in cultures grown under anaerobic conditions.”
§ Nitrate Reduction to Nitrite, Nitric Oxide and Ammonia by Gut Bacteria under Physiological Conditions > Results > Nitrate reduction by lactic acid bacteria cultures
plaincorrelational- Asserted: passes — The authors put it forward as true.
- Checkable: passes — It can be checked against evidence.
- Load-bearing: passes — The paper’s conclusions depend on it.
- Based: passes — The paper gives a reason why it holds.
It may state two separate claims as one.
A result the paper reports from its own data — it cites no other source for it, so there is none to check. The quote shows it is in the paper.
In the paper
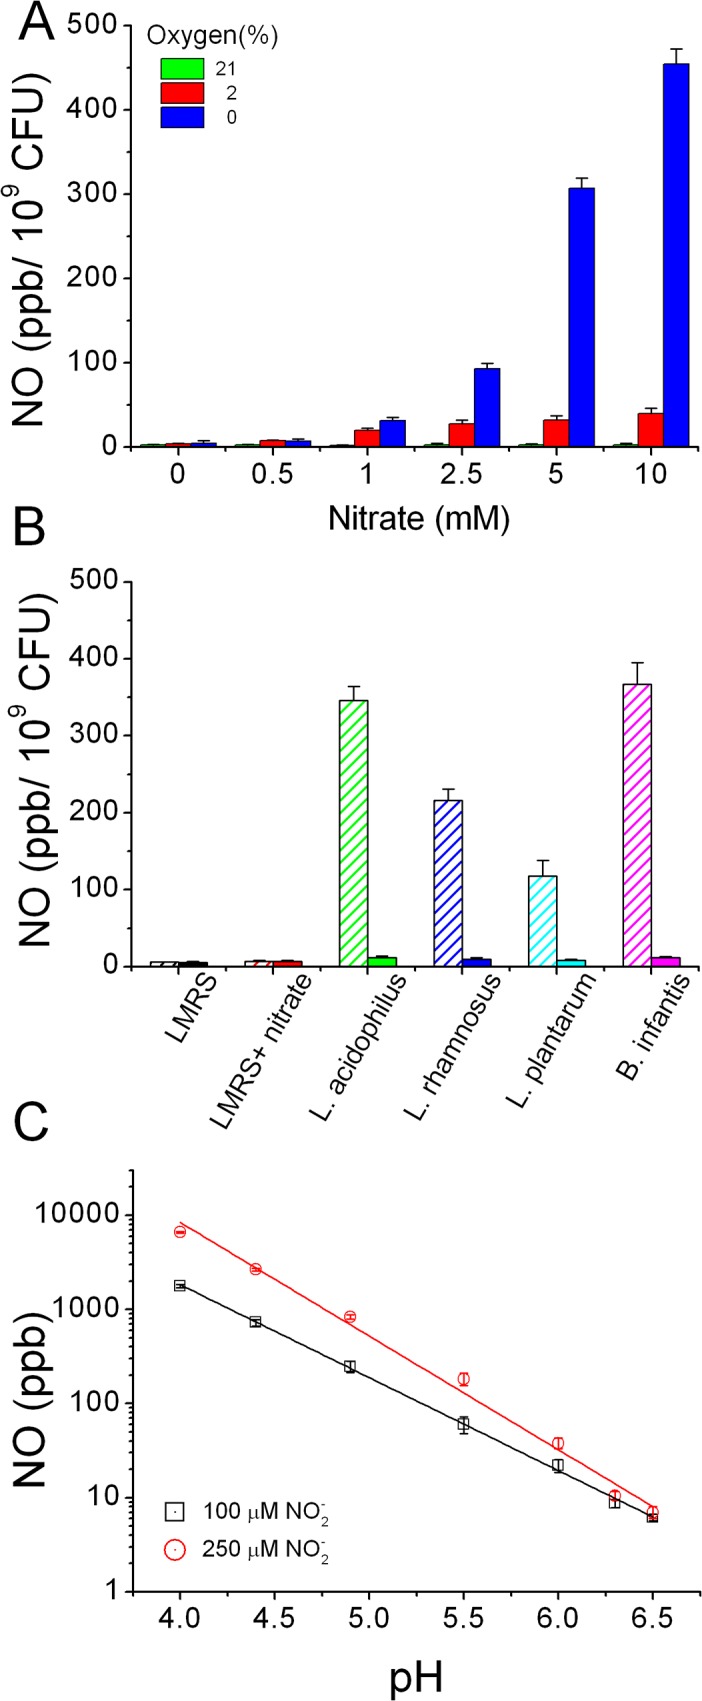
“Under 2% O2 small amounts of NO (< 40 ppb/109 CFU) were detected almost independently from the concentration of nitrate supplied.”
§ Nitrate Reduction to Nitrite, Nitric Oxide and Ammonia by Gut Bacteria under Physiological Conditions > Results > NO production by bacterial cell suspensions
plain- Asserted: passes — The authors put it forward as true.
- Checkable: passes — It can be checked against evidence.
- Load-bearing: passes — The paper’s conclusions depend on it.
- Based: passes — The paper gives a reason why it holds.
The quote only partly states this claim.
A result the paper reports from its own data — it cites no other source for it, so there is none to check. The quote shows it is in the paper.
In the paper
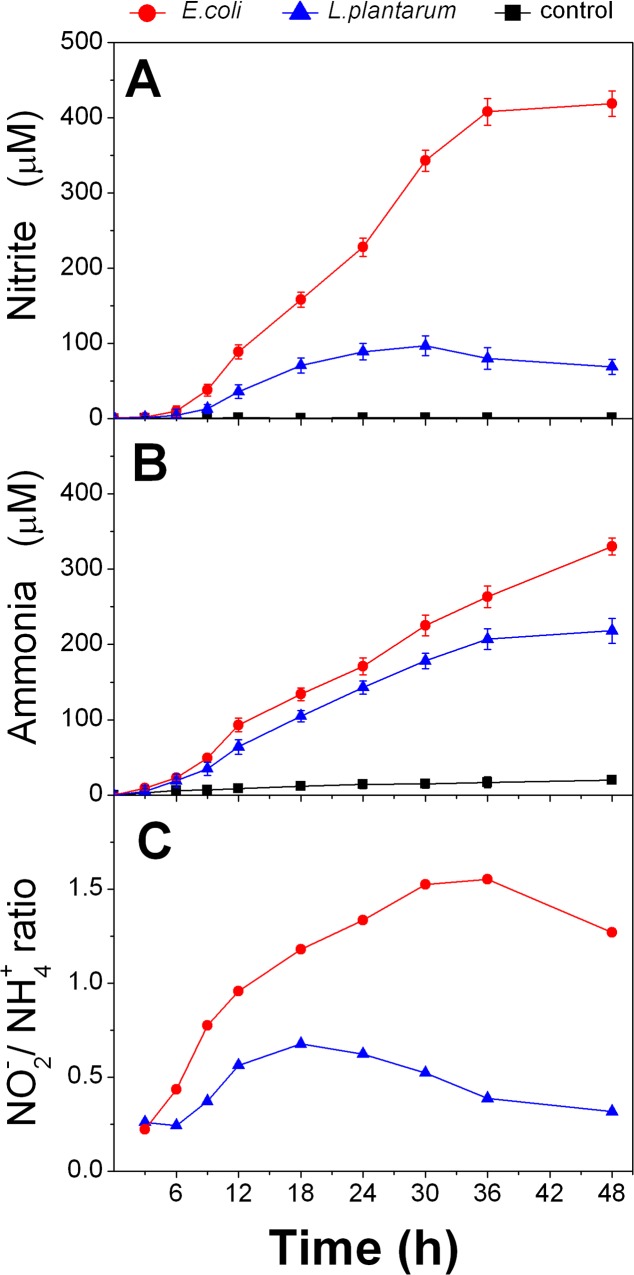
“We found that nitrite concentrations begun to increase within 3 to 6 hours after nitrate addition and accumulated steadily to reach a maximum in 30–36 h at about 0.4 mM for E.coli and 0.1 mM for L.plantarum (Fig. 3A).”
§ Nitrate Reduction to Nitrite, Nitric Oxide and Ammonia by Gut Bacteria under Physiological Conditions > Results > Time-course of concurrent nitrite and ammonia formation
plaindirect- Asserted: passes — The authors put it forward as true.
- Checkable: passes — It can be checked against evidence.
- Load-bearing: passes — The paper’s conclusions depend on it.
- Based: passes — The paper gives a reason why it holds.
It may state two separate claims as one.
A result the paper reports from its own data — it cites no other source for it, so there is none to check. The quote shows it is in the paper.
In the paper
“Similarly the ammonia concentrations plotted in Fig. 3B show well the almost linear and continuous increase measured between 9 and 30 h in both species but with different rates.”
§ Nitrate Reduction to Nitrite, Nitric Oxide and Ammonia by Gut Bacteria under Physiological Conditions > Results > Time-course of concurrent nitrite and ammonia formation
boostedcorrelational- Asserted: passes — The authors put it forward as true.
- Checkable: passes — It can be checked against evidence.
- Load-bearing: passes — The paper’s conclusions depend on it.
- Based: passes — The paper gives a reason why it holds.
It may state two separate claims as one.
A result the paper reports from its own data — it cites no other source for it, so there is none to check. The quote shows it is in the paper.
In the paper
“A smaller, but still considerable, effect on nitrite generation was observed in L.rhamnosus and L.acidophilus cultures and no significant changes were measured in B.longum infantis.”
§ Nitrate Reduction to Nitrite, Nitric Oxide and Ammonia by Gut Bacteria under Physiological Conditions > Results > Nitrate reduction by lactic acid bacteria cultures
plain- Asserted: passes — The authors put it forward as true.
- Checkable: passes — It can be checked against evidence.
- Load-bearing: unclear — It is unclear whether the paper’s conclusions depend on it.
- Based: passes — The paper gives a reason why it holds.
It may state two separate claims as one.
- Rests on an assumption: The O2 level of 2% used in some experiments is similar to the partial pressure found on the luminal surface of the intestinal mucosa.
A result the paper reports from its own data — it cites no other source for it, so there is none to check. The quote shows it is in the paper.
In the paper
“Inversely, much larger quantities were measured in analogous experiments after anaerobic growth and the response roughly correlated with the increasing nitrate concentrations.”
§ Nitrate Reduction to Nitrite, Nitric Oxide and Ammonia by Gut Bacteria under Physiological Conditions > Results > NO production by bacterial cell suspensions
plaincorrelational- Asserted: passes — The authors put it forward as true.
- Checkable: passes — It can be checked against evidence.
- Load-bearing: passes — The paper’s conclusions depend on it.
- Based: passes — The paper gives a reason why it holds.
It may state two separate claims as one.
A result the paper reports from its own data — it cites no other source for it, so there is none to check. The quote shows it is in the paper.
In the paper
“Of particular note, nitrite concentration in L.plantarum increased until around 30 h and afterwards begun to decrease while ammonia kept increasing further.”
§ Nitrate Reduction to Nitrite, Nitric Oxide and Ammonia by Gut Bacteria under Physiological Conditions > Results > Time-course of concurrent nitrite and ammonia formation
plaincorrelational- Asserted: passes — The authors put it forward as true.
- Checkable: passes — It can be checked against evidence.
- Load-bearing: passes — The paper’s conclusions depend on it.
- Based: passes — The paper gives a reason why it holds.
It may state two separate claims as one.
A result the paper reports from its own data — it cites no other source for it, so there is none to check. The quote shows it is in the paper.
In the paper
“LAB cultures are well known to produce substantial acidification of the media due to the fermentation of glucose primarily to lactic acid and we confirmed its formation in large amounts (mM) by direct detection.”
§ Nitrate Reduction to Nitrite, Nitric Oxide and Ammonia by Gut Bacteria under Physiological Conditions > Results > NO production by bacterial cell suspensions
boosteddirect- Asserted: passes — The authors put it forward as true.
- Checkable: passes — It can be checked against evidence.
- Load-bearing: passes — The paper’s conclusions depend on it.
- Based: passes — The paper gives a reason why it holds.
It may state two separate claims as one.
A result the paper reports from its own data — it cites no other source for it, so there is none to check. The quote shows it is in the paper.
In the paper
“The initial pH (6.5) decreased variably to values between 3.9 and 5.0 depending on the LAB species and the difference was the least for L. plantarum.”
§ Nitrate Reduction to Nitrite, Nitric Oxide and Ammonia by Gut Bacteria under Physiological Conditions > Results > NO production by bacterial cell suspensions
plaincorrelational- Asserted: passes — The authors put it forward as true.
- Checkable: passes — It can be checked against evidence.
- Load-bearing: passes — The paper’s conclusions depend on it.
- Based: passes — The paper gives a reason why it holds.
It may state two separate claims as one.
A result the paper reports from its own data — it cites no other source for it, so there is none to check. The quote shows it is in the paper.
In the paper
“However, when nitrate reached 2.5 mM both metabolites accumulated in the media and their concentrations were greatly increased and reached a maximum in the range 5–20 mM nitrate (to around 260 μM for NO2 − and 180 μM for NH4 +).”
§ Nitrate Reduction to Nitrite, Nitric Oxide and Ammonia by Gut Bacteria under Physiological Conditions > Results > Effect of oxygen on E.coli production of nitrite and ammonia from nitrate
plaincorrelational- Asserted: passes — The authors put it forward as true.
- Checkable: passes — It can be checked against evidence.
- Load-bearing: passes — The paper’s conclusions depend on it.
- Based: passes — The paper gives a reason why it holds.
It may state two separate claims as one.
A result the paper reports from its own data — it cites no other source for it, so there is none to check. The quote shows it is in the paper.
In the paper
“This procedure resulted in the almost complete halt of NO generation in all LAB (solid bars in Fig. 4B) but only partially in E.coli cultures.”
§ Nitrate Reduction to Nitrite, Nitric Oxide and Ammonia by Gut Bacteria under Physiological Conditions > Results > NO production by bacterial cell suspensions
plaindirect- Asserted: passes — The authors put it forward as true.
- Checkable: passes — It can be checked against evidence.
- Load-bearing: passes — The paper’s conclusions depend on it.
- Based: passes — The paper gives a reason why it holds.
It may state two separate claims as one.
A result the paper reports from its own data — it cites no other source for it, so there is none to check. The quote shows it is in the paper.
In the paper
“Of note, cultures of B. longum infantis did not grow at, or above, 6% O2 and showed negligible content of nitrite and low ammonia independent of the oxygen level.”
§ Nitrate Reduction to Nitrite, Nitric Oxide and Ammonia by Gut Bacteria under Physiological Conditions > Results > Nitrate reduction by lactic acid bacteria cultures
plain- Asserted: passes — The authors put it forward as true.
- Checkable: passes — It can be checked against evidence.
- Load-bearing: unclear — It is unclear whether the paper’s conclusions depend on it.
- Based: passes — The paper gives a reason why it holds.
It may state two separate claims as one.
A result the paper reports from its own data — it cites no other source for it, so there is none to check. The quote shows it is in the paper.
In the paper
“All the cultures produced a considerable but variable amount of NO after 100 μM nitrite injection, while the same addition to fresh LMRS, with or without nitrate, had no effect (bars with oblique lines).”
§ Nitrate Reduction to Nitrite, Nitric Oxide and Ammonia by Gut Bacteria under Physiological Conditions > Results > NO production by bacterial cell suspensions
plaindirect- Asserted: passes — The authors put it forward as true.
- Checkable: passes — It can be checked against evidence.
- Load-bearing: passes — The paper’s conclusions depend on it.
- Based: passes — The paper gives a reason why it holds.
It may state two separate claims as one.
A result the paper reports from its own data — it cites no other source for it, so there is none to check. The quote shows it is in the paper.
In the paper
“LAB cultures that grew at O2 levels equivalent or greater than 6% showed no significant changes in nitrite or ammonia.”
§ Nitrate Reduction to Nitrite, Nitric Oxide and Ammonia by Gut Bacteria under Physiological Conditions > Results > Nitrate reduction by lactic acid bacteria cultures
plain- Asserted: passes — The authors put it forward as true.
- Checkable: passes — It can be checked against evidence.
- Load-bearing: passes — The paper’s conclusions depend on it.
- Based: passes — The paper gives a reason why it holds.
The quote only partly states this claim.
A result the paper reports from its own data — it cites no other source for it, so there is none to check. The quote shows it is in the paper.
In the paper
“Replacing the growth media with fresh LMRS (pH = 6.5) almost completely blocked the LAB cultures ability to convert nitrite to NO but not in E.coli.”
§ Nitrate Reduction to Nitrite, Nitric Oxide and Ammonia by Gut Bacteria under Physiological Conditions > Discussion > Physiological significance of NO formation by bacterial nitrate reduction
plaindirect- Asserted: passes — The authors put it forward as true.
- Checkable: passes — It can be checked against evidence.
- Load-bearing: passes — The paper’s conclusions depend on it.
- Based: passes — The paper gives a reason why it holds.
It may state two separate claims as one.
A result the paper reports from its own data — it cites no other source for it, so there is none to check. The quote shows it is in the paper.
In the paper
“This NO generation, however is greatly reduced at 2% oxygen and become nitrate independent.”
§ Nitrate Reduction to Nitrite, Nitric Oxide and Ammonia by Gut Bacteria under Physiological Conditions > Discussion > Physiological significance of NO formation by bacterial nitrate reduction
plaindirect- Asserted: passes — The authors put it forward as true.
- Checkable: passes — It can be checked against evidence.
- Load-bearing: passes — The paper’s conclusions depend on it.
- Based: passes — The paper gives a reason why it holds.
It may state two separate claims as one.
A result the paper reports from its own data — it cites no other source for it, so there is none to check. The quote shows it is in the paper.
In the paper
“Our results also excluded the presence of active NOS enzymes in E.coli and L.plantarum”
§ Nitrate Reduction to Nitrite, Nitric Oxide and Ammonia by Gut Bacteria under Physiological Conditions > Discussion > Nitrogen oxides reduction pathways in the human gut
plain- Asserted: passes — The authors put it forward as true.
- Checkable: passes — It can be checked against evidence.
- Load-bearing: passes — The paper’s conclusions depend on it.
- Based: passes — The paper gives a reason why it holds.
It may state two separate claims as one.
In the paper
“Alongside with transport E.coli expresses two nitrite reductase enzymes (Nrf and Nir) that detoxify NO2 - by rapidly converting it to ammonia through a six-electron reduction [18].”
§ Nitrate Reduction to Nitrite, Nitric Oxide and Ammonia by Gut Bacteria under Physiological Conditions > Results > Effect of oxygen on E.coli production of nitrite and ammonia from nitrate
What the sources say
- Not checked yetcites [18] J Simon, 2002, Enzymology and bioenergetics of respiratory nitrite ammonification, FEMS Microbiol Rev source
plaindirect- Asserted: passes — The authors put it forward as true.
- Checkable: passes — It can be checked against evidence.
- Load-bearing: fails — The paper’s conclusions may not depend on it.
- Based: passes — The paper gives a reason why it holds.
Probably not a substantial claim. The paper’s conclusions may not depend on it.
In the paper
“a concentration compatible with levels found in the upper intestinal tract of healthy volunteers and with values measured in the mouse intestinal mucus [24].”
§ Nitrate Reduction to Nitrite, Nitric Oxide and Ammonia by Gut Bacteria under Physiological Conditions > Results > Effect of nitrate and oxygen on the growth patterns of E.coli in LMRS
What the sources say
- Not checked yetcites [24] SA Jones, 2007, Respiration of Escherichia coli in the mouse intestine, Infection and Immunity source
plain- Asserted: passes — The authors put it forward as true.
- Checkable: passes — It can be checked against evidence.
- Load-bearing: passes — The paper’s conclusions depend on it.
- Based: passes — The paper gives a reason why it holds.
It may state two separate claims as one.
None of the sources cited for this claim have been checked yet.
In the paper
“The E.coli genome encodes at least three distinct nitrate reductase enzymes [4] that are known to be expressed during anaerobic respiration [17].”
§ Nitrate Reduction to Nitrite, Nitric Oxide and Ammonia by Gut Bacteria under Physiological Conditions > Results > Effect of oxygen on E.coli production of nitrite and ammonia from nitrate
What the sources say
plain- Asserted: passes — The authors put it forward as true.
- Checkable: passes — It can be checked against evidence.
- Load-bearing: fails — The paper’s conclusions may not depend on it.
- Based: passes — The paper gives a reason why it holds.
Probably not a substantial claim. The paper’s conclusions may not depend on it. It may state two separate claims as one.
A conclusion the paper draws from its own results — it cites no other source for it, so there is none to check. The quote shows it is in the paper.
In the paper
“We suggest that the bacterial nitrate reduction to ammonia, as well as the related NO formation in the gut, could be an important aspect of the overall mammalian nitrate/nitrite/NO metabolism and is yet another way in which the microbiome links diet and health.”
§ Nitrate Reduction to Nitrite, Nitric Oxide and Ammonia by Gut Bacteria under Physiological Conditions > Abstract
hedgedcorrelational- Asserted: passes — The authors put it forward as true.
- Checkable: passes — It can be checked against evidence.
- Load-bearing: passes — The paper’s conclusions depend on it.
- Based: passes — The paper gives a reason why it holds.
It may state two separate claims as one.
- Rests on an assumption: Ammonia generated by gut microbiota from nitrate would likely be carried to the liver via the portal vein and enter the urea cycle to be converted into urea and amino acids.
In the paper
“However, over the past 30 years it has been shown that many Lactobacilli species can incorporate heme from the environment and utilize menaquinones, also known as vitamins K, to eventually perform respiration [26].”
§ Nitrate Reduction to Nitrite, Nitric Oxide and Ammonia by Gut Bacteria under Physiological Conditions > Results > Nitrate reduction by lactic acid bacteria cultures
What the sources say
- Not checked yetcites [26] G Wolf, 1990, Heme-dependent and heme-independent nitrite reduction by lactic acid bacteria results in different N-containing products, Int J Food Microbiol source
plaindirect- Asserted: passes — The authors put it forward as true.
- Checkable: passes — It can be checked against evidence.
- Load-bearing: passes — The paper’s conclusions depend on it.
- Based: passes — The paper gives a reason why it holds.
It may state two separate claims as one.
A conclusion the paper draws from its own results — it cites no other source for it, so there is none to check. The quote shows it is in the paper.
In the paper
“Bacterial production of lactic acid causes medium acidification that in turn generates NO by non-enzymatic nitrite reduction.”
§ Nitrate Reduction to Nitrite, Nitric Oxide and Ammonia by Gut Bacteria under Physiological Conditions > Abstract
plaindirect- Asserted: passes — The authors put it forward as true.
- Checkable: passes — It can be checked against evidence.
- Load-bearing: passes — The paper’s conclusions depend on it.
- Based: passes — The paper gives a reason why it holds.
It may state two separate claims as one.
A conclusion the paper draws from its own results — it cites no other source for it, so there is none to check. The quote shows it is in the paper.
In the paper
“These results indicate that at least 2 processes producing NO are present in E.coli: one predominates at 2% O2 tension and the other in anaerobic atmosphere.”
§ Nitrate Reduction to Nitrite, Nitric Oxide and Ammonia by Gut Bacteria under Physiological Conditions > Results > NO production by bacterial cell suspensions
hedgedcorrelational- Asserted: passes — The authors put it forward as true.
- Checkable: passes — It can be checked against evidence.
- Load-bearing: passes — The paper’s conclusions depend on it.
- Based: passes — The paper gives a reason why it holds.
It may state two separate claims as one.
In the paper
“Brooijmans et al. [27] have also recently reported that exogenous addition of menaquinone 4 (vitamin K2) along with heme stimulate nitrate reduction in L.plantarum.”
§ Nitrate Reduction to Nitrite, Nitric Oxide and Ammonia by Gut Bacteria under Physiological Conditions > Results > Nitrate reduction by lactic acid bacteria cultures
What the sources say
- Not checked yetcites Brooijmans et al. [27] RJW Brooijmans, 2009, Lactobacillus plantarum WCFS1 electron transport chains, Applied and Environmental Microbiology source
plaindirect- Asserted: passes — The authors put it forward as true.
- Checkable: passes — It can be checked against evidence.
- Load-bearing: fails — The paper’s conclusions may not depend on it.
- Based: passes — The paper gives a reason why it holds.
Probably not a substantial claim. The paper’s conclusions may not depend on it.
None of the sources cited for this claim have been checked yet.
In the paper
“Many enteric bacteria are also capable of catalytic reduction of nitrate to N2 gas (denitrification) under anaerobic conditions, or to ammonia via two-steps dissimilatory or assimilatory pathways [17,18].”
§ Nitrate Reduction to Nitrite, Nitric Oxide and Ammonia by Gut Bacteria under Physiological Conditions > Introduction
What the sources say
plaindirect- Asserted: passes — The authors put it forward as true.
- Checkable: passes — It can be checked against evidence.
- Load-bearing: passes — The paper’s conclusions depend on it.
- Based: passes — The paper gives a reason why it holds.
It may state two separate claims as one.
None of the sources cited for this claim have been checked yet.
In the paper
“However, several following studies on bacterial NO formation have proposed different mechanisms independent of respiratory denitrification such as arginine dependent bacterial NOS enzymatic activity, DNRA and non-enzymatic processes [15,32–34].”
§ Nitrate Reduction to Nitrite, Nitric Oxide and Ammonia by Gut Bacteria under Physiological Conditions > Results > NO production by bacterial cell suspensions
What the sources say
- Not checked yetcites [15] T Sobko, 2005, Gastrointestinal bacteria generate nitric oxide from nitrate and nitrite, Nitric Oxide source
- Not checked yetcites [32] J Xu, 2001, Evaluation of nitric oxide production by lactobacilli, Appl Microbiol Biotechnol source
- Not checked yetcites [33] H Corker, 2003, Nitric oxide formation by Escherichia coli. Dependence on nitrite reductase, the NO-sensing regulator Fnr, and flavohemoglobin Hmp, Journal of Biological Chemistry source
- Not checked yetcites [34] J Vermeiren, 2009, Nitric oxide production by the human intestinal microbiota by dissimilatory nitrate reduction to ammonium, Journal of Biomedicine and Biotechnology
plain- Asserted: passes — The authors put it forward as true.
- Checkable: passes — It can be checked against evidence.
- Load-bearing: fails — The paper’s conclusions may not depend on it.
- Based: passes — The paper gives a reason why it holds.
Probably not a substantial claim. The paper’s conclusions may not depend on it.
None of the sources cited for this claim have been checked yet.
In the paper
“In 1988, Ji and Hollocher first observed the generation of NO from nitrite by E.coli in anaerobic conditions [30] and later concluded that nitrite-dependent NO production was due to the activity of the respiratory membrane-associated nitrate reductase enzymes [31].”
§ Nitrate Reduction to Nitrite, Nitric Oxide and Ammonia by Gut Bacteria under Physiological Conditions > Results > NO production by bacterial cell suspensions
What the sources say
- Not checked yetcites [30] XB Ji, 1988, Reduction of nitrite to nitric oxide by enteric bacteria, Biochem Biophys Res Commun source
- Not checked yetcites [31] XB Ji, 1989, Nitrate Reductase of Escherichia-Coli as a No-Producing Nitrite Reductase, Biochemical Archives
plaindirect- Asserted: passes — The authors put it forward as true.
- Checkable: passes — It can be checked against evidence.
- Load-bearing: fails — The paper’s conclusions may not depend on it.
- Based: passes — The paper gives a reason why it holds.
Probably not a substantial claim. The paper’s conclusions may not depend on it. It may state two separate claims as one.
A conclusion the paper draws from its own results — it cites no other source for it, so there is none to check. The quote shows it is in the paper.
In the paper
“We concluded that LAB production of lactic acid causes sufficient medium acidification to induce the chemical nitrite conversion to NO”
- Also stated in: § Discussion · plain
“4) All LAB cultures examined generate large amounts of lactic acid causing sufficient acidification of culture media to drive nitrite disproportionation to NO.”
§ Nitrate Reduction to Nitrite, Nitric Oxide and Ammonia by Gut Bacteria under Physiological Conditions > Results > NO production by bacterial cell suspensions
boosteddirect- Asserted: passes — The authors put it forward as true.
- Checkable: passes — It can be checked against evidence.
- Load-bearing: passes — The paper’s conclusions depend on it.
- Based: passes — The paper gives a reason why it holds.
It may state two separate claims as one.
- Also stated in: § Discussion · plain
None of the sources cited for this claim have been checked yet.
In the paper
“Recent and past data have demonstrated that nitrate-rich diets increase plasma and tissue levels of nitrite [9,10], but this cannot be accounted solely by nitrate reduction from oral bacteria and other mechanisms have been implicated and are under investigation [11].”
§ Nitrate Reduction to Nitrite, Nitric Oxide and Ammonia by Gut Bacteria under Physiological Conditions > Introduction
What the sources say
- Not checked yetcites [9] M Govoni, 2008, The increase in plasma nitrite after a dietary nitrate load is markedly attenuated by an antibacterial mouthwash, Nitric Oxide source
- Not checked yetcites [10] NJH Raat, 2009, Dietary nitrate and nitrite modulate blood and organ nitrite and the cellular ischemic stress response, Free Radical Biology and Medicine source
- Not checked yetcites [11] E Weitzberg, 2013, Novel aspects of dietary nitrate and human health, Annu Rev Nutr source
boosteddirect- Asserted: passes — The authors put it forward as true.
- Checkable: passes — It can be checked against evidence.
- Load-bearing: passes — The paper’s conclusions depend on it.
- Based: passes — The paper gives a reason why it holds.
It may state two separate claims as one.
A conclusion the paper draws from its own results — it cites no other source for it, so there is none to check. The quote shows it is in the paper.
In the paper
“instead this process in E.coli is enzymatic and occurs around pH 6.5.”
§ Nitrate Reduction to Nitrite, Nitric Oxide and Ammonia by Gut Bacteria under Physiological Conditions > Results > NO production by bacterial cell suspensions
plaindirect- Asserted: passes — The authors put it forward as true.
- Checkable: passes — It can be checked against evidence.
- Load-bearing: passes — The paper’s conclusions depend on it.
- Based: passes — The paper gives a reason why it holds.
It may state two separate claims as one.
None of the sources cited for this claim have been checked yet.
In the paper
“More recently, the normal bacterial flora has been shown to generate NO and gut luminal NO levels have been measured in vivo in rats [15,16].”
§ Nitrate Reduction to Nitrite, Nitric Oxide and Ammonia by Gut Bacteria under Physiological Conditions > Introduction
What the sources say
plaindirect- Asserted: passes — The authors put it forward as true.
- Checkable: passes — It can be checked against evidence.
- Load-bearing: passes — The paper’s conclusions depend on it.
- Based: passes — The paper gives a reason why it holds.
It may state two separate claims as one.
In the paper
“In healthy individuals dietary nitrate is usually well absorbed in the upper intestinal tract, however a considerable fraction of the daily nitrate intake (about 1/3) was found to reach the lower intestine while only 1% of it is recovered in the feces [12].”
§ Nitrate Reduction to Nitrite, Nitric Oxide and Ammonia by Gut Bacteria under Physiological Conditions > Introduction
What the sources say
- Not checked yetcites [12] B Bartholomew, 1984, The pharmacology of dietary nitrate and the origin of urinary nitrate, Food Chem Toxicol source
plain- Asserted: passes — The authors put it forward as true.
- Checkable: passes — It can be checked against evidence.
- Load-bearing: passes — The paper’s conclusions depend on it.
- Based: passes — The paper gives a reason why it holds.
It may state two separate claims as one.
None of the sources cited for this claim have been checked yet.
In the paper
“Respiratory denitrification can also generate small but relevant amounts of NO as an intermediate product and has been implicated in the bacterial NO production in the gut [32,33].”
§ Nitrate Reduction to Nitrite, Nitric Oxide and Ammonia by Gut Bacteria under Physiological Conditions > Discussion > Nitrogen oxides reduction pathways in the human gut
What the sources say
- Not checked yetcites [32] J Xu, 2001, Evaluation of nitric oxide production by lactobacilli, Appl Microbiol Biotechnol source
- Not checked yetcites [33] H Corker, 2003, Nitric oxide formation by Escherichia coli. Dependence on nitrite reductase, the NO-sensing regulator Fnr, and flavohemoglobin Hmp, Journal of Biological Chemistry source
plainconditional- Asserted: passes — The authors put it forward as true.
- Checkable: passes — It can be checked against evidence.
- Load-bearing: unclear — It is unclear whether the paper’s conclusions depend on it.
- Based: passes — The paper gives a reason why it holds.
It may state two separate claims as one.
In the paper
“Sobko et al. [15] showed that in contrast to conventional rats, NO levels in the intestine of germ-free rats are extremely low and when inoculated with normal bacteria flora the observed NO production increased 10 fold.”
§ Nitrate Reduction to Nitrite, Nitric Oxide and Ammonia by Gut Bacteria under Physiological Conditions > Discussion > Physiological significance of NO formation by bacterial nitrate reduction
What the sources say
- Not checked yetcites [15] T Sobko, 2005, Gastrointestinal bacteria generate nitric oxide from nitrate and nitrite, Nitric Oxide source
plaindirect- Asserted: passes — The authors put it forward as true.
- Checkable: passes — It can be checked against evidence.
- Load-bearing: passes — The paper’s conclusions depend on it.
- Based: passes — The paper gives a reason why it holds.
It may state two separate claims as one.
In the paper
“it is well known that E.coli K12 strains express three molybdenum-containing nitrate reductases [17]”
§ Nitrate Reduction to Nitrite, Nitric Oxide and Ammonia by Gut Bacteria under Physiological Conditions > Discussion
What the sources say
- Not checked yetcites [17] C Sparacino-Watkins, 2013, Nitrate and periplasmic nitrate reductases, Chem Soc Rev source
boosted- Asserted: passes — The authors put it forward as true.
- Checkable: passes — It can be checked against evidence.
- Load-bearing: fails — The paper’s conclusions may not depend on it.
- Based: passes — The paper gives a reason why it holds.
Probably not a substantial claim. The paper’s conclusions may not depend on it.
In the paper
“Cole and colleagues reported that the major product of nitrite reduction in E.coli is ammonia with about only 1% being reduced to NO at neutral pH [51].”
§ Nitrate Reduction to Nitrite, Nitric Oxide and Ammonia by Gut Bacteria under Physiological Conditions > Discussion > Physiological implications of bacterial ammonia formation for health
What the sources say
- Not checked yetcites [51] J Cole, 1982, Independent pathways for the anaerobic reduction of nitrite to ammonia by Escherichia coli, Biochem Soc Trans source
plaindirect- Asserted: passes — The authors put it forward as true.
- Checkable: passes — It can be checked against evidence.
- Load-bearing: passes — The paper’s conclusions depend on it.
- Based: passes — The paper gives a reason why it holds.
It may state two separate claims as one.
In the paper
“unique to this species, genes that encode a putative nitrate-reductase system (narGHJI) were recently identified in the L. plantarum WCFS1 genome, which suggests that it is capable of using nitrate as an electron acceptor [27].”
§ Nitrate Reduction to Nitrite, Nitric Oxide and Ammonia by Gut Bacteria under Physiological Conditions > Discussion
What the sources say
- Not checked yetcites [27] RJW Brooijmans, 2009, Lactobacillus plantarum WCFS1 electron transport chains, Applied and Environmental Microbiology source
hedgedconditional- Asserted: passes — The authors put it forward as true.
- Checkable: passes — It can be checked against evidence.
- Load-bearing: passes — The paper’s conclusions depend on it.
- Based: passes — The paper gives a reason why it holds.
It may state two separate claims as one.
The paper relies on this without support.
The O2 level of 2% used in some experiments is similar to the partial pressure found on the luminal surface of the intestinal mucosa.
“with the O2 level fixed at 2%, a partial pressure similar to the one found on the luminal surface of the intestinal mucosa”
The paper relies on this without support.
Ammonia generated by gut microbiota from nitrate would likely be carried to the liver via the portal vein and enter the urea cycle to be converted into urea and amino acids.
“The ammonia thus generated would likely be carried to the liver via the portal vein, where it can enter the urea cycle and be converted into urea and amino acids.”
The paper relies on this without support.
The in vitro conditions used are compatible with nitrate-rich diets and oxygen levels found on the mucosal surfaces of the GI tract.
“using in vitro conditions compatible with nitrate-rich diets and oxygen levels found on the mucosal surfaces of the GI tract”
The paper relies on this without support.
The intestinal pH ranges between 5.7 and 7.5.
“Measurements of the intestine pH ranges between 5.7 and 7.5”
The paper relies on this without support.
Approximately 60% of an ingested nitrate dose in humans is not accounted for in excreted nitrogen-containing compounds.
“the biological fate of exogenous nitrate could not be accounted for in the excreted nitrogen-containing compounds which amount to approximately 60% of an ingested nitrate dose in humans”
The paper relies on this without support.
The bacterial species and strains studied in vitro are representative of those performing nitrate reduction in the human gut.
“selected common bacterial species colonizing the human intestine”
Claims other papers make about this one
Each is checked against this paper’s own text: does it say what the citing paper says it does?
In the citing paper
“Nitrite can exert pH-dependent antimicrobial effects[204,232,233] via formation of reactive secondary nitrogen oxides that can disrupt aerobic respiration[234], inhibit bacterial acid production, and disrupt biofilm formation[235–237].”
From Enterosalivary nitrate metabolism and the microbiome: Intersection of microbial metabolism, nitric oxide and diet in cardiac and pulmonary vascular health (2017) · cites this paper as [233]
In the citing paper
“In a recent set of experiments using gut facultative anaerobes, Escherichia coli and several Lactobacillus sp., there was an increase in the expression of nitrate reductase enzymes, an increase in nitrite formation, and a clear growth benefit in the setting of adequate nitrate as oxygen concentration decreases below 4% [233].”
From Enterosalivary nitrate metabolism and the microbiome: Intersection of microbial metabolism, nitric oxide and diet in cardiac and pulmonary vascular health (2017) · cites this paper as [233]
In the citing paper
“Second, diffusion of oxygen from the enteral vasculature through the submucosal tissue and into the intestinal lumen creates an incredibly steep oxygen gradient, ranging from 80–100mmHg (~10–13%) in the submucosa and base of the villi, down to only 8–10mmHg (~1–2%) in the overlying mucus layer and an essentially anaerobic luminal center (Figure 4)[233,267].”
From Enterosalivary nitrate metabolism and the microbiome: Intersection of microbial metabolism, nitric oxide and diet in cardiac and pulmonary vascular health (2017) · cites this paper as [233]
In the citing paper
“the majority of nitrate and nitrite are absorbed in the proximal small intestine[233,270].”
From Enterosalivary nitrate metabolism and the microbiome: Intersection of microbial metabolism, nitric oxide and diet in cardiac and pulmonary vascular health (2017) · cites this paper as [233]
In the citing paper
“it is unlikely they significantly contribute to the enterosalivary circulation given that the majority of nitrate and nitrite are absorbed in the proximal small intestine[233,270].”
From Enterosalivary nitrate metabolism and the microbiome: Intersection of microbial metabolism, nitric oxide and diet in cardiac and pulmonary vascular health (2017) · cites this paper as [233]
In the citing paper
“Yet, despite these localized, periodontal effects on microbial populations, high salivary nitrite concentrations may also exert antimicrobial effects elsewhere in the oral cavity and gut, possibly disrupting community composition or function of biologically beneficial populations of nitrate-reducing bacteria[204,232–237].”
From Enterosalivary nitrate metabolism and the microbiome: Intersection of microbial metabolism, nitric oxide and diet in cardiac and pulmonary vascular health (2017) · cites this paper as [233]
In the citing paper
“Elevated rates of generation of these oxidative inflammatory mediators can have direct effects on enterocytes and mucosal integrity, impair NO-dependent vascular function, reduce nitrate and nitrite absorption, and exert selective pressure on bacteria by augmenting innate anti-bacterial effects[204,233,321–324].”
From Enterosalivary nitrate metabolism and the microbiome: Intersection of microbial metabolism, nitric oxide and diet in cardiac and pulmonary vascular health (2017) · cites this paper as [233]
In the citing paper
“Many bacteria are capable of reducing nitrate to nitrite to NO via the denitrification pathway.”
From Enterosalivary nitrate metabolism and the microbiome: Intersection of microbial metabolism, nitric oxide and diet in cardiac and pulmonary vascular health (2017) · cites this paper as [233]
In the citing paper
“commensal gut bacteria are able to directly produce NO and also modify NO production, potentially influencing regional blood flow, mucosal integrity, microbial diversity, and effective nitrate and nitrite uptake.”
From Enterosalivary nitrate metabolism and the microbiome: Intersection of microbial metabolism, nitric oxide and diet in cardiac and pulmonary vascular health (2017) · cites this paper as [233]
In the citing paper
“both Lactobacilli and Bifidobacteria have been shown to generate NO from nitrite in culture”
From Enterosalivary nitrate metabolism and the microbiome: Intersection of microbial metabolism, nitric oxide and diet in cardiac and pulmonary vascular health (2017) · cites this paper as [233]
In the citing paper
“while Lactobacilli, Escherichia coli and Salmonella typhimurium all increase cecal NO production when supplied with nitrate[217,233,271,278].”
From Enterosalivary nitrate metabolism and the microbiome: Intersection of microbial metabolism, nitric oxide and diet in cardiac and pulmonary vascular health (2017) · cites this paper as [233]
Self-check
Percentages, sums and reported differences re-computed from the paper’s own numbers.
Each contradiction between two passages listed here was confirmed by an independent check.
Rated minor: it would not touch a result — a value no result rests on, a p-value that stays on the same side of the significance level, or a conflict that is clerical, resolved elsewhere in the paper, or outside its own findings.
In the paper
§ Nitrate Reduction to Nitrite, Nitric Oxide and Ammonia by Gut Bacteria under Physiological Conditions > Introduction
“| Escherichia coli | MG1566 | 7.6 | ND c |”
§ Nitrate Reduction to Nitrite, Nitric Oxide and Ammonia by Gut Bacteria under Physiological Conditions > Results > Effect of nitrate and oxygen on the growth patterns of E.coli in LMRS
“We first compared E.coli MG1655 strain growth patterns”
Citations
Cites
The gut flora as a forgotten organ
O'Hara, A. M., & Shanahan, F. (2006) · The EMBO Reports · doi:10.1038/sj.embor.7400731 · Cited by 2,791
The nitrate-nitrite-nitric oxide pathway in physiology and therapeutics
Lundberg, J. O., Weitzberg, E., & Gladwin, M. T. (2008) · Nature Reviews Drug Discovery · doi:10.1038/nrd2466 · Cited by 2,739 · cited 1×
“Nitrate (NO3 ) and nitrite (NO2 ) anions have long been identified as stable products of NO oxidation, but in recent years the nitrate— nitrite—nitric oxide reductive pathway has emerged as an alternative route to the classical enzymatic NO formation by oxidation of L-arginine with molecular oxygen [2,3].”
BackgroundNitric oxide : biology and pathobiology
Ignarro, L. J. (2000) · Cited by 1,306
Host-Derived Nitrate Boosts Growth of E. coli in the Inflamed Gut
Winter, S. E., Winter, M. G., Xavier, M. N., Thiennimitr, P., Poon, V., Keestra, A. M., Laughlin, R. C., Gomez, G., Wu, J., Lawhon, S. D., et al. (2013) · Science · doi:10.1126/science.1232467 · Cited by 1,019
Unden, G., & Bongaerts, J. (1997) · Biochimica et Biophysica Acta (BBA) - Bioenergetics · doi:10.1016/s0005-2728(97)00034-0 · Cited by 744
Nitrate, bacteria and human health
Lundberg, J. O., Weitzberg, E., Cole, J. A., & Benjamin, N. (2004) · Nature Reviews Microbiology · doi:10.1038/nrmicro929 · Cited by 739
Govoni, M., Jansson, E. Å., Weitzberg, E., & Lundberg, J. O. (2008) · Nitric Oxide · doi:10.1016/j.niox.2008.08.003 · Cited by 602
Nitrate Synthesis in the Germfree and Conventional Rat
Green, L. C., Tannenbaum, S. R., & Goldman, P. (1981) · Science · doi:10.1126/science.6451927 · Cited by 559
Nitrite as Regulator of Hypoxic Signaling in Mammalian Physiology
van Faassen, E. E., Bahrami, S., Feelisch, M., Hogg, N., Kelm, M., Kim‐Shapiro, D. B., Kozlov, A. V., Li, H., Lundberg, J. O., Mason, R., et al. (2009) · Medicinal Research Reviews · doi:10.1002/med.20151 · Cited by 435
Nitrate and periplasmic nitrate reductases
Sparacino-Watkins, C., Stolz, J. F., & Basu, P. (2014) · Chem. Soc. Rev. · doi:10.1039/c3cs60249d · Cited by 426 · cited 3×
“Many enteric bacteria are also capable of catalytic reduction of nitrate to N2 gas (denitrification) under anaerobic conditions, or to ammonia via two-steps dissimilatory or assimilatory pathways [17,18].”
Background
Research works printed but not linked: 1
- XB Ji, 1989, Nitrate Reductase of Escherichia-Coli as a No-Producing Nitrite Reductase, Biochemical Archives, 5, 61
Cited by
Sorted by citations
Mou, Y., Du, Y., Zhou, L., Yue, J., Hu, X., Liu, Y., Chen, S., Lin, X., Zhang, G., Xiao, H., et al. (2022) · Frontiers in Immunology · doi:10.3389/fimmu.2022.796288 · Cited by 432
Singhal, R., & Shah, Y. M. (2020) · Journal of Biological Chemistry · doi:10.1074/jbc.rev120.011188 · Cited by 401
Costless metabolic secretions as drivers of interspecies interactions in microbial ecosystems
Pacheco, A. R., Moel, M., & Segrè, D. (2019) · Nature Communications · doi:10.1038/s41467-018-07946-9 · Cited by 315
Shandilya, S., Kumar, S., Jha, N. K., Kesari, K. K., & Ruokolainen, J. (2021) · Journal of Advanced Research · doi:10.1016/j.jare.2021.09.005 · Cited by 310
Grasset, E., Puel, A., Charpentier, J., Collet, X., Christensen, J. E., Tercé, F., & Burcelin, R. (2017) · Cell Metabolism · doi:10.1016/j.cmet.2017.04.013 · Cited by 284
The Role of the Gut Microbiome in Cattle Production and Health: Driver or Passenger?
O’Hara, E., Neves, A. L. A., Song, Y., & Guan, L. L. (2020) · Annual Review of Animal Biosciences · doi:10.1146/annurev-animal-021419-083952 · Cited by 254
Edwards, T. M., Puglis, H. J., Kent, D. B., Durán, J. L., Bradshaw, L. M., & Farag, A. M. (2023) · The Science of The Total Environment · doi:10.1016/j.scitotenv.2023.167911 · Cited by 273
Loy, A., Pfann, C., Steinberger, M., Hanson, B. T., Herp, S., Brugiroux, S., Neto, J. C. G., Boekschoten, M. V., Schwab, C., Urich, T., et al. (2017) · mSystems · doi:10.1128/msystems.00171-16 · Cited by 234
NADPH oxidases and ROS signaling in the gastrointestinal tract
Aviello, G., & Knaus, U. G. (2018) · Mucosal Immunology · doi:10.1038/s41385-018-0021-8 · Cited by 235
The Influence of Gut Microbiota on Oxidative Stress and the Immune System
Kunst, C., Schmid, S. A., Michalski, M., Tümen, D., Buttenschoen, J., Müller, M., & Gülow, K. (2023) · Biomedicines · doi:10.3390/biomedicines11051388 · Cited by 240
Nitric oxide in cellular adaptation and disease
Gantner, B. N., LaFond, K. M., & Bonini, M. G. (2020) · Redox Biology · doi:10.1016/j.redox.2020.101550 · Cited by 217
Zhuang, L.-L., Yang, T., Zhang, J., & Li, X. (2019) · Bioresource Technology · doi:10.1016/j.biortech.2019.122086 · Cited by 200
Koch, C. D., Gladwin, M. T., Freeman, B. A., Lundberg, J. O., Weitzberg, E., & Morris, A. (2017) · Free Radical Biology and Medicine · doi:10.1016/j.freeradbiomed.2016.12.015 · Cited by 186
Microbial Contribution to the Human Metabolome: Implications for Health and Disease
Treuren, W. V., & Dodd, D. (2019) · Annual Review of Pathology Mechanisms of Disease · doi:10.1146/annurev-pathol-020117-043559 · Cited by 180
The Role of Oral Microbiota in Intra-Oral Halitosis
Hampelska, K., Jaworska, M. M., Babalska, Z. Ł., & Karpiński, T. M. M. (2020) · Journal of Clinical Medicine · doi:10.3390/jcm9082484 · Cited by 175
Ashaolu, T. J., Khalifa, I., Mesak, M. A., Lorenzo, J. M., & Farag, M. A. (2021) · Critical Reviews in Food Science and Nutrition · doi:10.1080/10408398.2021.1929059 · Cited by 169
Oral nanomedicine for modulating immunity, intestinal barrier functions, and gut microbiome
Lee, Y., Kamada, N., & Moon, J. J. (2021) · Advanced Drug Delivery Reviews · doi:10.1016/j.addr.2021.114021 · Cited by 169
Bacteria-mediated hypoxia functions as a signal for mosquito development
Coon, K. L., Valzania, L., McKinney, D. A., Vogel, K. J., Brown, M. R., & Strand, M. R. (2017) · Proceedings of the National Academy of Sciences · doi:10.1073/pnas.1702983114 · Cited by 165
Gut Bacteria and Hydrogen Sulfide: The New Old Players in Circulatory System Homeostasis
Tomášová, L., Konopelski, P., & Ufnal, M. (2016) · Molecules · doi:10.3390/molecules21111558 · Cited by 161
Research Progress on Cu-Based Catalysts for Electrochemical Nitrate Reduction Reaction to Ammonia
Teng, M., Ye, J., Wan, C., He, G., & Chen, H. (2022) · Industrial & Engineering Chemistry Research · doi:10.1021/acs.iecr.2c02495 · Cited by 145
Health benefit of vegetable/fruit juice-based diet: Role of microbiome
Henning, S. M., Yang, J., Shao, P., Lee, R.-P., Huang, J., Ly, A., Hsu, M., Lu, Q., Thames, G., Heber, D., et al. (2017) · Scientific Reports · doi:10.1038/s41598-017-02200-6 · Cited by 136
Nitrate: An Environmental Endocrine Disruptor? A Review of Evidence and Research Needs
Poulsen, R., Cedergreen, N., Hayes, T. B., & Hansen, M. A. (2018) · Environmental Science & Technology · doi:10.1021/acs.est.7b06419 · Cited by 118
The era of nitric oxide in plant biology: Twenty years tying up loose ends
Castello, F. D., Nejamkin, A., Cassia, R., Correa‐Aragunde, N., Fernández, B., Foresi, N. P., Lombardo, C., Ramírez, L., & Lamattina, L. (2019) · Nitric Oxide · doi:10.1016/j.niox.2019.01.013 · Cited by 114
Material strategies in the electrochemical nitrate reduction reaction to ammonia production
Jung, W., & Hwang, Y. J. (2021) · Materials Chemistry Frontiers · doi:10.1039/d1qm00456e · Cited by 114
Reactive oxygen and nitrogen species and innate immune response
Al‐Shehri, S. S. (2020) · Biochimie · doi:10.1016/j.biochi.2020.11.022 · Cited by 120
A tale of two sites: how inflammation can reshape the microbiomes of the gut and lungs
Scales, B. S., Dickson, R. P., & Huffnagle, G. B. (2016) · Journal of Leukocyte Biology · doi:10.1189/jlb.3mr0316-106r · Cited by 109
Mutagenesis by Microbe: the Role of the Microbiota in Shaping the Cancer Genome
Barrett, M., Hand, C. K., Shanahan, F., Murphy, T., & O’Toole, P. W. (2020) · Trends in Cancer · doi:10.1016/j.trecan.2020.01.019 · Cited by 108
Das, T. K., & Ganesh, B. P. (2023) · Gut Microbes · doi:10.1080/19490976.2023.2206504 · Cited by 102
Said Abasse, K., Essien, E. E., Abbas, M., Yu, X., Xie, W., Sun, J., Akter, L., & Cote, A. (2022) · Nutrients · doi:10.3390/nu14030666 · Cited by 98
Microbiota and Malodor—Etiology and Management
Mogilnicka, I., Bogucki, P., & Ufnal, M. (2020) · International Journal of Molecular Sciences · doi:10.3390/ijms21082886 · Cited by 96
Human gastric microbiota transplantation recapitulates premalignant lesions in germ-free mice
Kwon, S.-K., Park, J. C., Kim, K. H., Yoon, J., Cho, Y., Lee, B., Lee, J.-J., Jeong, H., Oh, Y., Kim, S., et al. (2021) · Gut · doi:10.1136/gutjnl-2021-324489 · Cited by 95
Wang, Z., & Shao, Y. (2017) · Food Microbiology · doi:10.1016/j.fm.2017.12.003 · Cited by 91
The Evolutionary Conservation of Escherichia coli Drug Efflux Pumps Supports Physiological Functions
Teelucksingh, T., Thompson, L. K., & Cox, G. (2020) · Journal of Bacteriology · doi:10.1128/jb.00367-20 · Cited by 91
Interactions between the microbiota and enteric nervous system during gut-brain disorders
Fried, S. G., Wemelle, E., Cani, P. D., & Knauf, C. (2021) · Neuropharmacology · doi:10.1016/j.neuropharm.2021.108721 · Cited by 95
Mahbub, N. U., Islam, M. M., Hong, S., & Chung, H. (2024) · Frontiers in Cellular and Infection Microbiology · doi:10.3389/fcimb.2024.1348279 · Cited by 90
Mechanisms underlying blood pressure reduction by dietary inorganic nitrate
Carlström, M., Lundberg, J. O., & Weitzberg, E. (2018) · Acta Physiologica · doi:10.1111/apha.13080 · Cited by 87
Al-Shehri, S. S., Duley, J. A., & Bansal, N. (2020) · Redox Biology · doi:10.1016/j.redox.2020.101524 · Cited by 82
Ribera, A., Bai, Y., Wolters, A. A., van Treuren, R., & Kik, C. (2020) · Euphytica · doi:10.1007/s10681-020-02585-y · Cited by 80
Granja-Salcedo, Y. T., Fernandes, R. M., de Araújo, R. C., Kishi, L. T., Berchielli, T. T., de Resende, F. D., Berndt, A., & Siqueira, G. R. (2019) · Frontiers in Microbiology · doi:10.3389/fmicb.2019.00614 · Cited by 86
Woodward, E. E., Edwards, T. M., Givens, C. E., Kolpin, D. W., & Hladik, M. L. (2021) · Environmental Science & Technology · doi:10.1021/acs.est.0c05732 · Cited by 79
Cuenca, E., Jodra, P., Pérez-López, A., González-Rodríguez, L. G., Fernandes da Silva, S., Veiga-Herreros, P., & Domínguez, R. (2018) · Nutrients · doi:10.3390/nu10091222 · Cited by 76
The role of nitric oxide in melanoma
Yarlagadda, K., Hassani, J., Foote, I. P., & Markowitz, J. (2017) · Biochimica et Biophysica Acta (BBA) - Reviews on Cancer · doi:10.1016/j.bbcan.2017.09.005 · Cited by 78
González‐Martínez, A., Muñoz-Palazón, B., Rodríguez–Sánchez, A., & González-López, J. (2018) · FEMS Microbiology Letters · doi:10.1093/femsle/fny031 · Cited by 71
Pathways Linking Oral Bacteria, Nitric Oxide Metabolism, and Health
Morou-Bermúdez, E., Torres-Colón, J. E., Bermúdez, N. S., Patel, R. P., & Joshipura, K. J. (2022) · Journal of Dental Research · doi:10.1177/00220345211064571 · Cited by 70
Heras, J. D. L., Aldamiz-Echevarria, L. J., Martínez‐Chantar, M. L., & Delgado, T. C. (2016) · Expert Opinion on Drug Metabolism & Toxicology · doi:10.1080/17425255.2017.1262843 · Cited by 70
Dr. NO and Mr. Toxic – the versatile role of nitric oxide
Porrini, C., Ramarao, N., & Tran, S. (2019) · Biological Chemistry · doi:10.1515/hsz-2019-0368 · Cited by 73
Tiso, M., & Schechter, A. N. (2015) · PLoS ONE · doi:10.1371/journal.pone.0127490 · Cited by 68
Self-citationVanhatalo, A., L’Heureux, J. E., KELLY, J. A., Blackwell, J. R., Wylie, L. J., Fulford, J., Winyard, P. G., Williams, D. W., van der Giezen, M., & JONES, A. M. (2021) · Redox Biology · doi:10.1016/j.redox.2021.101933 · Cited by 68
Flueck, J. L., Bogdanova, A., Mettler, S., & Perret, C. (2016) · Applied Physiology, Nutrition, and Metabolism · doi:10.1139/apnm-2015-0458 · Cited by 67
Farin, W., Oñate, F. P., Plassais, J., Bonny, C., Beglinger, C., Woelnerhanssen, B., Nocca, D., Magoulès, F., Chatelier, E. L., Pons, N., et al. (2020) · Surgery for Obesity and Related Diseases · doi:10.1016/j.soard.2020.03.014 · Cited by 65
The Participation of Microbiota in the Transformation of Nitrogen Compounds in the Soil—A Review
Paśmionka, I. B., Bulski, K., & Boligłowa, E. (2021) · Agronomy · doi:10.3390/agronomy11050977 · Cited by 63
Wu, S., Luo, T., Wang, S., Zhou, J., Ni, Y., Fu, Z., & Jin, Y. (2018) · The Science of The Total Environment · doi:10.1016/j.scitotenv.2018.06.084 · Cited by 63
Wang, X., Tamiev, D., Alagurajan, J., DiSpirito, A., Phillips, G., & Hargrove, M. (2018) · Archives of Microbiology · doi:10.1007/s00203-018-1590-3 · Cited by 56
From nitrate to NO: potential effects of nitrate-reducing bacteria on systemic health and disease
Liu, H., Huang, Y., Huang, M., Wang, M., Ming, Y., Chen, W., Chen, Y., Tang, Z., & Jia, B. (2023) · European Journal of Medical Research · doi:10.1186/s40001-023-01413-y · Cited by 58
Coffman, V. R., Jensen, A. S., Trabjerg, B. B., Pedersen, C. B., Hansen, B., Sigsgaard, T., Olsen, J., Schaumburg, I., Schullehner, J., Pedersen, M., et al. (2021) · Environmental Health Perspectives · doi:10.1289/ehp7331 · Cited by 59
Gut Microbiota and Alzheimer’s Disease: How to Study and Apply Their Relationship
Nguyen, N. M., Cho, J., & Lee, C.-H. (2023) · International Journal of Molecular Sciences · doi:10.3390/ijms24044047 · Cited by 60
Zhang, X., Yin, Y. S., Wang, J., Battaglia, T., Krautkramer, K. A., Li, W. V., Li, J., Brown, M., Zhang, M., Badri, M. H., et al. (2021) · Cell Host & Microbe · doi:10.1016/j.chom.2021.06.014 · Cited by 58
Role of Oral and Gut Microbiota in Dietary Nitrate Metabolism and Its Impact on Sports Performance
González-Soltero, R., Bailén, M., de Lucas, B., Ramírez-Goercke, M. I., Pareja-Galeano, H., & Larrosa, M. (2020) · Nutrients · doi:10.3390/nu12123611 · Cited by 54
The long-term effects of using nitrite and urea on the enrichment of comammox bacteria
Zhao, Y., Hu, J., Yang, W., Wang, J., Jia, Z., Zheng, P., & Hu, B. (2020) · The Science of The Total Environment · doi:10.1016/j.scitotenv.2020.142580 · Cited by 53
Gu, D., Zhang, Y., Wang, Q., & Zhou, X. (2020) · Nature Communications · doi:10.1038/s41467-020-19506-1 · Cited by 53
Feirer, N., & Fuqua, C. (2017) · Pteridines · doi:10.1515/pterid-2016-0012 · Cited by 53
Imron, M. F., Firdaus, A. A. F., Flowerainsyah, Z. O., Rosyidah, D., Fitriani, N., Kurniawan, S. B., Abdullah, S. R. S., Hasan, H. A., & Wibowo, Y. G. (2022) · Journal of Water Process Engineering · doi:10.1016/j.jwpe.2022.103429 · Cited by 52
Sun, J., Lifen, L., & Fenglin, Y. (2020) · The Science of The Total Environment · doi:10.1016/j.scitotenv.2020.140738 · Cited by 50
Microglia and gut microbiota: A double-edged sword in Alzheimer's disease
Bano, N., Khan, S., Ahamad, S., Kanshana, J. S., Dar, N. J., Khan, S. J., Nazir, A., & Bhat, S. A. (2024) · Ageing Research Reviews · doi:10.1016/j.arr.2024.102515 · Cited by 50
Angiogenesis, a key point in the association of gut microbiota and its metabolites with disease
Wang, Y., Bai, M., Peng, Q., Li, L., Tian, F., Guo, Y., & Jing, C. (2024) · European journal of medical research · doi:10.1186/s40001-024-02224-5 · Cited by 51
Structure of a Wbl protein and implications for NO sensing by M. tuberculosis
Kudhair, B. K., Hounslow, A. M., Rolfe, M. D., Crack, J. C., Hunt, D. M., Buxton, R. S., Smith, L. J., Brun, N. E. L., Williamson, M. P., & Green, J. D. (2017) · Nature Communications · doi:10.1038/s41467-017-02418-y · Cited by 51
Rocha, B. S., & Laranjinha, J. A. N. (2020) · Free Radical Biology and Medicine · doi:10.1016/j.freeradbiomed.2020.02.001 · Cited by 49
Microbiota and the nitrogen cycle: Implications in the development and progression of CVD and CKD
Briskey, D., Tucker, P. S., Johnson, D. W., & Coombes, J. S. (2016) · Nitric Oxide · doi:10.1016/j.niox.2016.05.002 · Cited by 47
Implications of the Human Gut–Brain and Gut–Cancer Axes for Future Nanomedicine
Javed, I., Cui, X., Wang, X., Mortimer, M., Andrikopoulos, N. K., Li, Y., Davis, T. P., Zhao, Y., Ke, P. C., & Chen, C. (2020) · ACS Nano · doi:10.1021/acsnano.0c07258 · Cited by 47
Botta, C., Acquadro, A., Greppi, A., Barchi, L., Bertolino, M., Cocolin, L., & Rantsiou, K. (2017) · Scientific Reports · doi:10.1038/s41598-017-16186-8 · Cited by 45
Goh, C. E., Bohn, B., Marotz, C. A., Molinsky, R. L., Roy, S. S., Paster, B. J., Chen, C., Rosenbaum, M. S., yuzefpolskaya, M., Colombo, P. C., et al. (2022) · Journal of the American Heart Association · doi:10.1161/jaha.121.023038 · Cited by 45
Oral microbiome as a co-mediator of halitosis and periodontitis: a narrative review
Lee, Y., & Hong, J. (2023) · Frontiers in Oral Health · doi:10.3389/froh.2023.1229145 · Cited by 43
Grabacka, M., Plonka, P. M., & Pierzchalska, M. (2022) · International Journal of Molecular Sciences · doi:10.3390/ijms232214156 · Cited by 44
Carcinogenic effects of N-nitroso compounds in the environment
Jain, D., Chaudhary, P., Varshney, N., & Janmeda, P. (2020) · Environment Conservation Journal · doi:10.36953/ecj.2020.21304 · Cited by 40
Pereira, R. V. V., Carroll, L. M., Lima, S. F., Foditsch, C., Siler, J. D., Bicalho, R. C., & Warnick, L. D. (2018) · Scientific Reports · doi:10.1038/s41598-017-19021-2 · Cited by 40
Physiological relevance of nitric oxide in ovarian functions: An overview
Nath, P., & Maitra, S. (2018) · General and Comparative Endocrinology · doi:10.1016/j.ygcen.2018.09.008 · Cited by 40
Wang, L., Wang, R., Wei, G.-Y., Shu-me, W., & Du, G. (2020) · Biomedicine & Pharmacotherapy · doi:10.1016/j.biopha.2020.110262 · Cited by 40
Mechanisms of the protective effects of nitrate and nitrite in cardiovascular and metabolic diseases
Liu, Y., Croft, K. D., Hodgson, J. M., Mori, T., & Ward, N. C. (2020) · Nitric Oxide · doi:10.1016/j.niox.2020.01.006 · Cited by 41
Flori, L., Benedetti, G., Martelli, A., & Calderone, V. (2024) · Pharmacological Research · doi:10.1016/j.phrs.2024.107334 · Cited by 40
The emerging role of gasotransmitters in the pathogenesis of tuberculosis
Chinta, K. C., Saini, V., Glasgow, J. N., Mazorodze, J. H., Rahman, M. A., Reddy, D., Lancaster, J. R., & Steyn, A. J. C. (2016) · Nitric Oxide · doi:10.1016/j.niox.2016.06.009 · Cited by 41
The role of nitrogen metabolism on polyethylene biodegradation
Peixoto, J., Vizzotto, C. S., Ramos, A., Alves, G. S. C., Steindorff, A. S., & Krüger, R. H. (2022) · Journal of Hazardous Materials · doi:10.1016/j.jhazmat.2022.128682 · Cited by 38
Clinical and Pathophysiological Consequences of Alterations in the Microbiome in Cirrhosis
Macnaughtan, J., & Jalan, R. (2015) · The American Journal of Gastroenterology · doi:10.1038/ajg.2015.313 · Cited by 38
Li, J., Liu, Y., Kim, E., March, J. C., Bentley, W. E., & Payne, G. F. (2016) · Free Radical Biology and Medicine · doi:10.1016/j.freeradbiomed.2016.12.029 · Cited by 38
Endocrine organs of cardiovascular diseases: Gut microbiota
Jia, Q., Xie, Y., Lu, C., Zhang, A., Lu, Y., Lv, S., & Zhang, J. (2019) · Journal of Cellular and Molecular Medicine · doi:10.1111/jcmm.14164 · Cited by 38
Serum nitrite and nitrate: A potential biomarker for post-covid-19 complications?
Wang, J., Mei, F., Bai, L., Zhou, S., Liu, D., Yao, L., Ahluwalia, A., Ghiladi, R. A., Su, L., Shu, T., et al. (2021) · Free Radical Biology and Medicine · doi:10.1016/j.freeradbiomed.2021.08.237 · Cited by 38
The role of dietary nitrate and the oral microbiome on blood pressure and vascular tone
Alzahrani, H., Jackson, K. G., Hobbs, D. A., & Lovegrove, J. A. (2020) · Nutrition Research Reviews · doi:10.1017/s0954422420000281 · Cited by 40
Nunzio, M. D., Loffi, C., Montalbano, S., Chiarello, E., Dellafiora, L., Picone, G., Antonelli, G., Tedeschi, T., Buschini, A., Capozzi, F., et al. (2022) · International Journal of Molecular Sciences · doi:10.3390/ijms232012555 · Cited by 39
Gut microbiota mediated the toxicity of high concentration of dietary nitrite in C57BL/6 mice
Xu, J., Wang, M., Liu, Q., Lin, X., Pu, K., & He, Z. (2022) · Ecotoxicology and Environmental Safety · doi:10.1016/j.ecoenv.2022.113224 · Cited by 35
A review on nitrates’ health benefits and disease prevention
Apte, M., Nadavade, N., & Sheikh, S. S. (2023) · Nitric Oxide · doi:10.1016/j.niox.2023.11.003 · Cited by 38
Sohn, H., Chang, Y. H., Yune, J. H., Jeong, C. H., Shin, D., Kwon, H.-C., Kim, D. H., Hong, S. W., Hwang, H., Jeong, J. Y., et al. (2020) · Foods · doi:10.3390/foods9121777 · Cited by 35
Underexplored microbial metabolisms for enhanced nutrient recycling in agricultural soils
Bhowmik, A., Cloutier, M. L. C., Ball, E. E., & Bruns, M. (2017) · AIMS Microbiology · doi:10.3934/microbiol.2017.4.826 · Cited by 28
Gut redox and microbiome: charting the roadmap to T-cell regulation
Prasad, S., Singh, S., Menge, S., Mohapatra, I., Kim, S., Helland, L. C., Singh, G., & Singh, A. R. (2024) · Frontiers in Immunology · doi:10.3389/fimmu.2024.1387903 · Cited by 35
HPLC-DAD Determination of Nitrite and Nitrate in Human Saliva Utilizing a Phosphatidylcholine Column
Tatarczak‐Michalewska, M., Flieger, J., Kawka, J., Płaziński, W., Flieger, W., Blicharska, E., & Majerek, D. (2019) · Molecules · doi:10.3390/molecules24091754 · Cited by 34
Rajcic, D., Baumann, A., Hernández-Arriaga, A. M., Brandt, A., Nier, A., Jin, C. J., Sánchez, V., Jung, F., Camarinha‐Silva, A., & Bergheim, I. (2021) · Redox Biology · doi:10.1016/j.redox.2021.101879 · Cited by 34
Wąsik, E., & Chmielowski, K. (2017) · Ecological Engineering · doi:10.1016/j.ecoleng.2017.05.015 · Cited by 32
Grießmeier, V., & Gescher, J. (2018) · Frontiers in Microbiology · doi:10.3389/fmicb.2018.01313 · Cited by 32
Gut microbiota as a separate body system
Yudina, Y. V., Korsunsky, A. A., Aminova, A. I., Abdullaeva, G. D., & Продеус, А. П. (2019) · Russian Journal of Evidence-Based Gastroenterology · doi:10.17116/dokgastro2019804-05136 · Cited by 32
Unsafe drinking water quality in remote Western Australian Aboriginal communities
Rajapakse, J., Rainer‐Smith, S., Millar, G. J., Grace, P., Hutton, A., Hoy, W. E., Jeffries‐Stokes, C., & Hudson, B. J. (2018) · Geographical Research · doi:10.1111/1745-5871.12308 · Cited by 31
Shendge, A. K., Sarkar, R., & Mandal, N. (2020) · Journal of Food Biochemistry · doi:10.1111/jfbc.13521 · Cited by 32
Thiol and H 2 S-Mediated NO Generation from Nitrate at Copper(II)
Ghosh, P., Stauffer, M., Ahmed, M. E., Bertke, J. A., Staples, R. J., & Warren, T. H. (2023) · Journal of the American Chemical Society · doi:10.1021/jacs.3c00394 · Cited by 30
Metadata
- Authors
- Tiso, M., & Schechter, A. N.
- Affiliations
- National Institutes of Health (US)
- Corresponding author
- Schechter, Alan N.
- ORCID
- Schechter, Alan N.
- Venue
- PLOS ONE
- Publisher
- Public Library of Science (PLoS)
- Published
- 2015-03-24
- Volume
- 10
- Issue
- 3
- Pages
- e0119712
- ISSN
- 1932-6203 (ISSN-L)
- PMC
- PMC4372352
- OpenAlex
- W2016792399
- Semantic Scholar
- 85a9ecdb44af363910ac2a1b792ff39fd2cee804
- Cited by
- 311
- References
- 55
- Citations by year
- 2026: 8 · 2025: 30 · 2024: 41 · 2023: 39 · 2022: 27 · 2021: 32 · 2020: 43 · 2019: 22 · 2018: 32 · 2017: 21 · 2016: 11 · 2015: 4
- FWCI
- 9.85
- Type
- journal article
- Language
- en
- Update notices
- correction (2015-05-06)
- Open access
- gold
- doi.org
- Licence
- public-domain
- creativecommons.org/publicdomain/zero/1.0/ (vor)
- Locations
- PLoS ONE (publishedVersion, public-domain)
- Europe PMC (PubMed Central) (publishedVersion, public-domain)
- PubMed Central (publishedVersion, public-domain)
- PubMed Central (publishedVersion, cc-by)
- PubMed (publishedVersion)
- DOAJ (DOAJ: Directory of Open Access Journals) (submittedVersion, cc-by-sa)
- Funders
- National Institutes of Health
- Topics
- Life Sciences › Biochemistry, Genetics and Molecular Biology › Molecular Biology › Gut microbiota and health
- Physical Sciences › Environmental Science › Pollution › Wastewater Treatment and Nitrogen Removal
- Life Sciences › Agricultural and Biological Sciences › Food Science › Probiotics and Fermented Foods
- Keywords
- nitrate reduction, nitrite, nitric oxide, ammonia synthesis, gut microbiota, Escherichia coli, Lactobacillus, Bifidobacterium, lactic acid
- MeSH terms
- Gastrointestinal Microbiome, Ammonia, Analysis of Variance, Bifidobacterium, Escherichia coli, Humans, Lactobacillus, Nitrates, Nitric Oxide, Nitrites, Oxygen, Lactic Acid, Nitrogen Cycle
About these checks
Registry, retraction, Cites and statistics results are computed, not judged, with one exception: a printed reference that no index lists is read once by a model before it counts as a citation error. Claims are extracted by a model and kept only when their quote appears verbatim in the text; each cited source is then checked, with a model’s help, for whether it says what the claim relies on. Those verdicts can be wrong — read the claim’s quote and the cited source before relying on one.
A language model drew the claims from the paper on 2026-10-09, under version 3 of the claim definition (model deepseek-v4.1-flash, prompt extract-v3).
A second model labelled each claim on 2026-10-09 (model jev-1.13-20260917, definition revision gold-guideline-v0.2).
Statistics and arithmetic are recomputed, not judged.
Confidence bands are shown only for fields calibrated on our annotated test set. None is calibrated yet, so no band is shown.
What counts as a claim ›How we measure confidence ›How we check this ›
Are you an author, or do you see a problem with this page? Request a review
