

The DOI matches its Crossref record; 48 of the 48 references it cites were found in a registry or an index.
Hypoxia and hypoxia-inducible factor (HIF) downregulate antigen-presenting MHC class I molecules limiting tumor cell recognition by T cells
Open accessAbstract
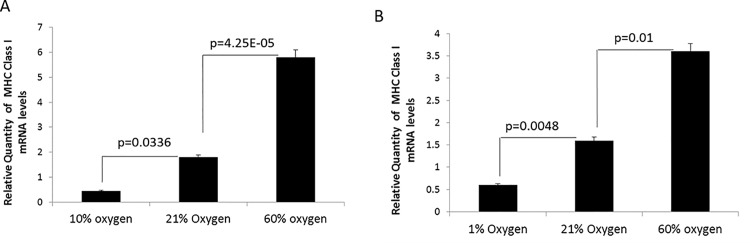
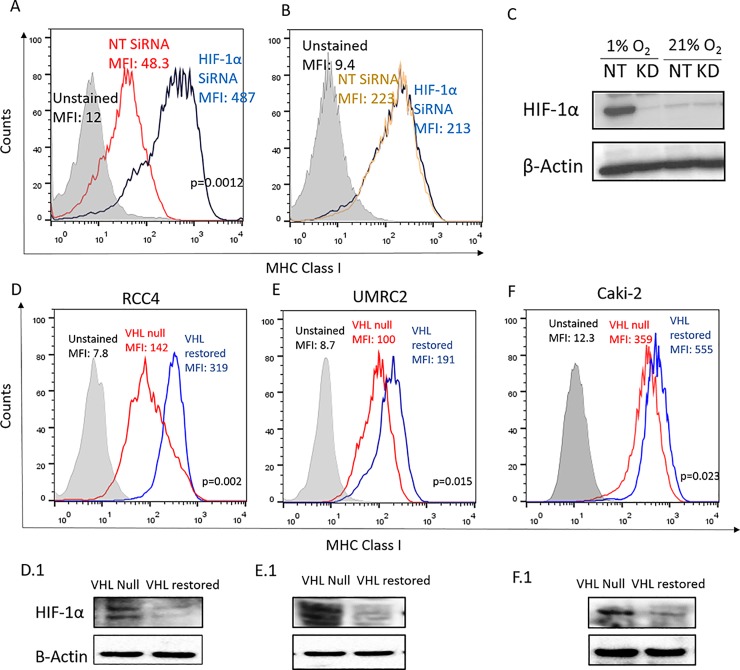
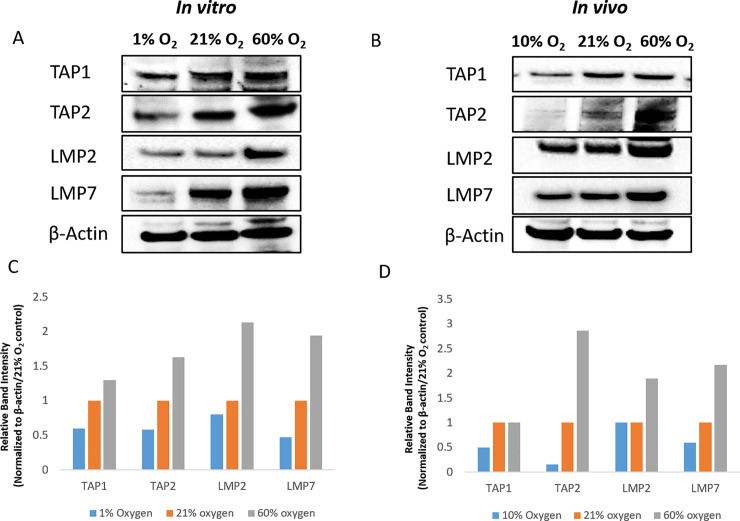
Human cancers are known to downregulate Major Histocompatibility Complex (MHC) class I expression thereby escaping recognition and rejection by anti-tumor T cells. Here we report that oxygen tension in the tumor microenvironment (TME) serves as an extrinsic cue that regulates antigen presentation by MHC class I molecules. In support of this view, hypoxia is shown to negatively regulate MHC expression in a HIF-dependent manner as evidenced by (i) lower MHC expression in the hypoxic TME in vivo and in hypoxic 3-dimensional (3D) but not 2-dimensional (2D) tumor cell cultures in vitro; (ii) decreased MHC in human renal cell carcinomas with constitutive expression of HIF due to genetic loss of von Hippel-Lindau (VHL) function as compared with isogenically paired cells with restored VHL function, and iii) increased MHC in tumor cells with siRNA-mediated knockdown of HIF. In addition, hypoxia downregulated antigen presenting proteins like TAP 1/2 and LMP7 that are known to have a dominant role in surface display of peptide-MHC complexes. Corroborating oxygen-dependent regulation of MHC antigen presentation, hyperoxia (60% oxygen) transcriptionally upregulated MHC expression and increased levels of TAP2, LMP2 and 7. In conclusion, this study reveals a novel mechanism by which intra-tumoral hypoxia and HIF can potentiate immune escape. It also suggests the use of hyperoxia to improve tumor cell-based cancer vaccines and for mining novel immune epitopes. Furthermore, this study highlights the advantage of 3D cell cultures in reproducing hypoxia-dependent changes observed in the TME.
Overview
The claims and statistics of this paper haven’t been checked yet.
Run the check — free, no account needed. It reads the open-access text and checks the sources it cites.
Integrity signals
Registry
Cites
Statistics
Figures
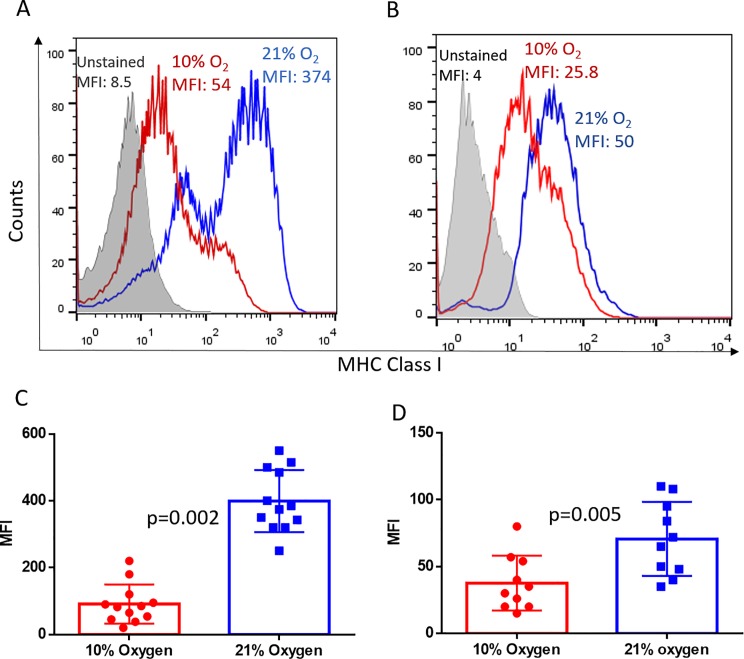
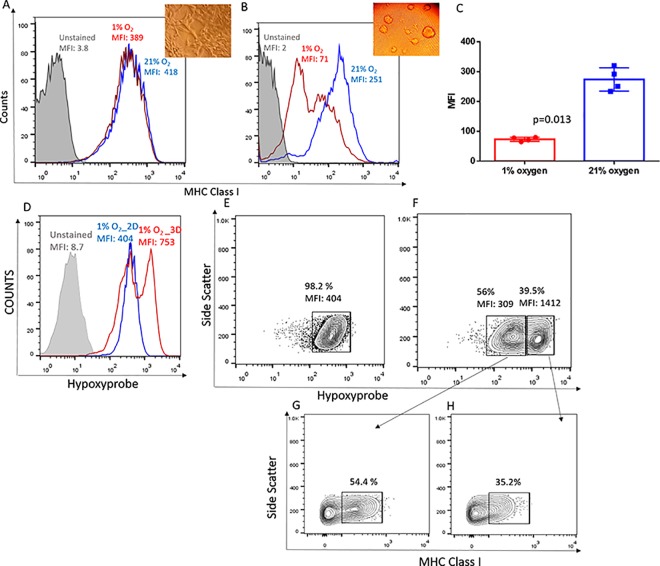
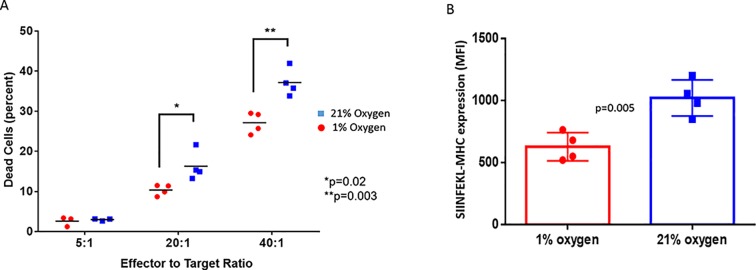
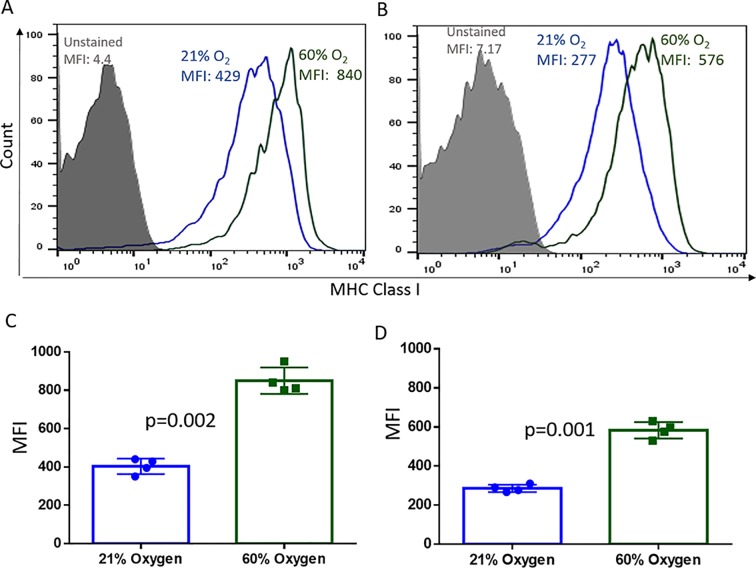
Verification
Claims the paper makes
The claims and statistics of this paper haven’t been checked yet.
Run the check — free, no account needed. It reads the open-access text and checks the sources it cites.
Claims other papers make about this one
Each is checked against this paper’s own text: does it say what the citing paper says it does?
The source backs part of the claim, not all of it — or backs it for a different population, condition or comparison.
In the citing paper
“Finally, the parallel increase in NK cells enables killing of cancer cells that have downregulated the expression of class I MHC proteins to evade killing by T cells (91, 92).”
From HIF inhibitor 32-134D eradicates murine hepatocellular carcinoma in combination with anti-PD1 therapy (2022) · cites this paper as [91]
Experimental — accuracy not yet measured
Self-check
Percentages, sums and reported differences re-computed from the paper’s own numbers.
The self-check needs the paper’s full text.
Citations
Cites
Microenvironmental regulation of tumor progression and metastasis
Quail, D. F., & Joyce, J. A. (2013) · Nature Medicine · doi:10.1038/nm.3394 · Cited by 7,994
ROS function in redox signaling and oxidative stress
Schieber, M., & Chandel, N. S. (2014) · Current Biology · doi:10.1016/j.cub.2014.03.034 · Cited by 6,931
Innate and adaptive immune cells in the tumor microenvironment
Gajewski, T. F., Schreiber, H., & Fu, Y.-X. (2013) · Nature Immunology · doi:10.1038/ni.2703 · Cited by 4,148
ROS as signalling molecules: Mechanisms that generate specificity in ROS homeostasis
D'Autréaux, B., & Toledano, M. B. (2007) · Nature Reviews Molecular Cell Biology · doi:10.1038/nrm2256 · Cited by 3,642
Reits, E. A., Hodge, J. W., Herberts, C. A., Groothuis, T. A., Chakraborty, M., K.Wansley, E., Camphausen, K., Luiten, R. M., de Ru, A. H., Neijssen, J., et al. (2006) · The Journal of Experimental Medicine · doi:10.1084/jem.20052494 · Cited by 1,737
HIF-1 mediates metabolic responses to intratumoral hypoxia and oncogenic mutations
Semenza, G. L. (2013) · Journal of Clinical Investigation · doi:10.1172/jci67230 · Cited by 1,335
Cancer exome analysis reveals a T-cell-dependent mechanism of cancer immunoediting
Matsushita, H., Vesely, M. D., Koboldt, D. C., Rickert, C. G., Uppaluri, R., Magrini, V. J., Arthur, C. D., White, J. M., Chen, Y.-S., Shea, L. K., et al. (2012) · Nature · doi:10.1038/nature10755 · Cited by 1,285
Smyth, M. J., Dunn, G. P., & Schreiber, R. D. (2006) · Advances in immunology · doi:10.1016/s0065-2776(06)90001-7 · Cited by 919
The von Hippel–Lindau tumour suppressor protein: O2 sensing and cancer
Kaelin, W. G. (2008) · Nature reviews. Cancer · doi:10.1038/nrc2502 · Cited by 754
Purinergic Signaling during Inflammation
Eltzschig, H. K., Sitkovsky, M. V., & Robson, S. C. (2012) · New England Journal of Medicine · doi:10.1056/nejmra1205750 · Cited by 739
Self-citation
Cited by
Sorted by citations
Improving cancer immunotherapy using nanomedicines: progress, opportunities and challenges
Martin, J. D., Cabral, H., Stylianopoulos, T., & Jain, R. K. (2020) · Nature Reviews Clinical Oncology · doi:10.1038/s41571-019-0308-z · Cited by 691
Therapeutic targeting of the hypoxic tumour microenvironment
Singleton, D. C., Macann, A., & Wilson, W. R. (2021) · Nature Reviews Clinical Oncology · doi:10.1038/s41571-021-00539-4 · Cited by 507
Emerging evidence for adapting radiotherapy to immunotherapy
Galluzzi, L., Aryankalayil, M. J., Coleman, C. N., & Formenti, S. C. (2023) · Nature Reviews Clinical Oncology · doi:10.1038/s41571-023-00782-x · Cited by 389
Proteomics of Melanoma Response to Immunotherapy Reveals Mitochondrial Dependence
Harel, M., Ortenberg, R., Varanasi, S. K., Mangalhara, K. C., Mardamshina, M., Markovits, E., Baruch, E. N., Tripple, V., Arama-Chayoth, M., Greenberg, E., et al. (2019) · Cell · doi:10.1016/j.cell.2019.08.012 · Cited by 328
Hypoxia-Driven Immune Escape in the Tumor Microenvironment
Vito, A., El-Sayes, N., & Mossman, K. L. (2020) · Cells · doi:10.3390/cells9040992 · Cited by 287
The role of hypoxia‐inducible factor 1 in tumor immune evasion
Li, Y., Wu, W., Wang, X., Fang, L., Adam, V., Nepovimová, E., Wu, Q., & Kuča, K. (2020) · Medicinal Research Reviews · doi:10.1002/med.21771 · Cited by 276
Deregulation of HLA-I in cancer and its central importance for immunotherapy
Hazini, A., Fisher, K., & Seymour, L. W. (2021) · Journal for ImmunoTherapy of Cancer · doi:10.1136/jitc-2021-002899 · Cited by 217
Role of mitochondrial alterations in human cancer progression and cancer immunity
Wang, S., Tseng, L., & Lee, H. (2023) · Journal of Biomedical Science · doi:10.1186/s12929-023-00956-w · Cited by 225
Zheng, S., Wang, W., Shen, L., Yao, Y., Xia, W., & Ni, C. (2024) · Experimental Hematology and Oncology · doi:10.1186/s40164-024-00543-1 · Cited by 200
Exercise as adjunct therapy in cancer
Ashcraft, K. A., Warner, A. B., Jones, L. W., & Dewhirst, M. W. (2019) · Seminars in Radiation Oncology · doi:10.1016/j.semradonc.2018.10.001 · Cited by 148
Hossain, M. A., Liu, G., Dai, B., Si, Y., Yang, Q., Wazir, J., Birnbaumer, L., & Yang, Y. (2020) · Medicinal Research Reviews · doi:10.1002/med.21727 · Cited by 138
A Review of the Role of Hypoxia in Radioresistance in Cancer Therapy
Bouleftour, W., Rowinski, E., Louati, S., Sotton, S., Wozny, A., Moreno-Acosta, P., Méry, B., Rodriguez‐Lafrasse, C., & Magné, N. (2021) · Medical Science Monitor · doi:10.12659/msm.934116 · Cited by 137
Finisguerra, V., Dvořáková, T., Formenti, M., Meerbeeck, P. V., Mignion, L., Gallez, B., & den Eynde, B. J. V. (2023) · Journal for ImmunoTherapy of Cancer · doi:10.1136/jitc-2022-005719 · Cited by 123
Hypoxia signaling in cancer: Implications for therapeutic interventions
Zhuang, Y., Liu, K., He, Q., Gu, X., Jiang, C., & Wu, J. (2023) · MedComm · doi:10.1002/mco2.203 · Cited by 119
Hypoxia and the phenomenon of immune exclusion
Pietrobon, V., & Marincola, F. M. (2021) · Journal of Translational Medicine · doi:10.1186/s12967-020-02667-4 · Cited by 119
Current developments in nanotechnology for improved cancer treatment, focusing on tumor hypoxia
Phung, C. D., Tran, T. H., Pham, L. M., Nguyen, H. T., Jeong, J., Yong, C. S., & Kim, J. O. (2020) · Journal of Controlled Release · doi:10.1016/j.jconrel.2020.05.029 · Cited by 115
Salman, S., Meyers, D. J., Wicks, E. E., Lee, S. N., Datan, E., Thomas, A. M., Anders, N. M., Hwang, Y., Lyu, Y., Yang, Y., et al. (2022) · Journal of Clinical Investigation · doi:10.1172/jci156774 · Cited by 111
“Finally, the parallel increase in NK cells enables killing of cancer cells that have downregulated the expression of class I MHC proteins to evade killing by T cells (91, 92).”
BackgroundKim, H., Shim, B. Y., Lee, S., Lee, J. Y., Lee, H. J., & Kim, I.-H. (2021) · International Journal of Molecular Sciences · doi:10.3390/ijms22189795 · Cited by 109
Tumor immune evasion through loss of MHC class-I antigen presentation
Sarı, G., & Rock, K. L. (2023) · Current Opinion in Immunology · doi:10.1016/j.coi.2023.102329 · Cited by 106
Mimicking tumor hypoxia and tumor-immune interactions employing three-dimensional in vitro models
Bhattacharya, S., Calar, K., & de la Puente, P. (2020) · Journal of Experimental & Clinical Cancer Research · doi:10.1186/s13046-020-01583-1 · Cited by 106
Alleviating hypoxia to improve cancer immunotherapy
Fan, P., Zhang, N., Candi, E., Agostini, M., Piacentini, M., Bernassola, F., Bove, P., Alessandro, M., Giuseppe, N., Valentina, R., et al. (2023) · Oncogene · doi:10.1038/s41388-023-02869-2 · Cited by 101
Zhang, X., Ashcraft, K. A., Warner, A. B., Nair, S. K., & Dewhirst, M. W. (2019) · Cancer Research · doi:10.1158/0008-5472.can-18-2468 · Cited by 89
Integrating tumor hypoxic stress in novel and more adaptable strategies for cancer immunotherapy
Khouzam, R. A., Venkatesh, G. H., Zaarour, R. F., Chamseddine, A. N., Francis, A., Buart, S., Terry, S., & Chouaïb, S. (2020) · Seminars in Cancer Biology · doi:10.1016/j.semcancer.2020.01.003 · Cited by 84
Immunotherapy for small cell lung cancer: mechanisms of resistance
Hamilton, G., & Rath, B. (2019) · Expert Opinion on Biological Therapy · doi:10.1080/14712598.2019.1592155 · Cited by 83
Mitochondrial immune regulation and anti-tumor immunotherapy strategies targeting mitochondria
Bai, R., & Cui, J. (2023) · Cancer Letters · doi:10.1016/j.canlet.2023.216223 · Cited by 83
Predictive biomarkers for immune checkpoint blockade and opportunities for combination therapies
Shen, H., Yang, E. S.-H., Conry, M., Fiveash, J. B., Contreras, C. M., Bonner, J. A., & Shi, L. Z. (2019) · Genes & Diseases · doi:10.1016/j.gendis.2019.06.006 · Cited by 78
Antihypoxic oxygenation agents with respiratory hyperoxia to improve cancer immunotherapy
Hatfield, S. M., & Sitkovsky, M. V. (2020) · Journal of Clinical Investigation · doi:10.1172/jci137554 · Cited by 73
Self-citationHLA class I antigen processing machinery defects in antitumor immunity and immunotherapy
Maggs, L., Sadagopan, A., Moghaddam, A. S., & Ferrone, S. (2021) · Trends in cancer · doi:10.1016/j.trecan.2021.07.006 · Cited by 76
Intratumoral hypoxia and mechanisms of immune evasion mediated by hypoxia-inducible factors
Semenza, G. L. (2021) · Physiology · doi:10.1152/physiol.00034.2020 · Cited by 64
Targeted Anti-Mitochondrial Therapy: The Future of Oncology
Taghizadeh‐Hesary, F., Behnam, B., Akbari, H., & Bahadori, M. (2022) · Genes · doi:10.3390/genes13101728 · Cited by 64
Eckert, F., Zwirner, K., Boeke, S., Thorwarth, D., Zips, D., & Huber, S. M. (2019) · Frontiers in Immunology · doi:10.3389/fimmu.2019.00407 · Cited by 61
Hiraoka, N., Ino, Y., Hori, S., Yamazaki–Itoh, R., Naito, C., Shimasaki, M., Esaki, M., Nara, S., Kishi, Y., Shimada, K., et al. (2020) · Cancer Science · doi:10.1111/cas.14514 · Cited by 59
Role of HIF-1α in the Responses of Tumors to Radiotherapy and Chemotherapy
Song, C. W., Kim, H., Kim, M.-S., Park, H. J., Paek, S.-H., Terezakis, S. A., & Cho, L. C. (2024) · Cancer Research and Treatment · doi:10.4143/crt.2024.255 · Cited by 58
Hypoxia promotes tumor immune evasion by suppressing MHC-I expression and antigen presentation
Estéphan, H., Tailor, A., Parker, R., Kreamer, M., Papandreou, I., Campo, L., Easton, A., Moon, E. J., Denko, N. C., Ternette, N., et al. (2025) · The EMBO Journal · doi:10.1038/s44318-024-00319-7 · Cited by 55
Modulating cancer mechanopathology to restore vascular function and enhance immunotherapy
Mpekris, F., Panagi, M., Charalambous, A., Voutouri, C., & Stylianopoulos, T. (2024) · Cell Reports Medicine · doi:10.1016/j.xcrm.2024.101626 · Cited by 55
Hypoxic Signalling in Tumour Stroma
Laitala, A., & Erler, J. T. (2018) · Frontiers in Oncology · doi:10.3389/fonc.2018.00189 · Cited by 55
Oxygen‐Generating Cryogels Restore T Cell Mediated Cytotoxicity in Hypoxic Tumors
Colombani, T., Eggermont, L. J., Hatfield, S. M., Rogers, Z. J., Rezaeeyazdi, M., Memić, A., Sitkovsky, M. V., & Bencherif, S. A. (2021) · Advanced Functional Materials · doi:10.1002/adfm.202102234 · Cited by 54
Self-citationOxygen levels at the time of activation determine T cell persistence and immunotherapeutic efficacy
Cunha, P. P., Minogue, E., Krause, L. C. M., Hess, R. M., Bargiela, D., Wadsworth, B. J., Barbieri, L., Brombach, C., Foskolou, I. P., Bogeski, I., et al. (2023) · eLife · doi:10.7554/elife.84280 · Cited by 54
Hypoxia and its therapeutic possibilities in paediatric cancers
Bernauer, C., Man, Y. K. S., Chisholm, J., Lepicard, E. Y., Robinson, S. P., & SHIPLEY, J. M. (2020) · British Journal of Cancer · doi:10.1038/s41416-020-01107-w · Cited by 50
Tumor microenvironment in glioblastoma: The central role of the hypoxic–necrotic core
Bayona, C., Ranđelović, T., & Ochoa, I. (2025) · Cancer Letters · doi:10.1016/j.canlet.2025.218216 · Cited by 52
Clinical and Pre-clinical Methods for Quantifying Tumor Hypoxia
Rickard, A. G., Palmer, G. M., & Dewhirst, M. W. (2019) · Advances in experimental medicine and biology · doi:10.1007/978-3-030-12734-3_2 · Cited by 41
Benoit, A., Vogin, G., Duhem, C., Berchem, G., & Janji, B. (2023) · Cells · doi:10.3390/cells12131787 · Cited by 39
“HIF-1 has a negative effect on MHC-I expression, thus limiting tumor cell recognition by T cells [132,133].”
BackgroundRationale for hypoxia assessment and amelioration for precision therapy and immunotherapy studies
Dewhirst, M. W., Mowery, Y. M., Mitchell, J. B., Cherukuri, M. K., & Secomb, T. W. (2019) · Journal of Clinical Investigation · doi:10.1172/jci126044 · Cited by 40
Corgnac, S., Damei, I., Gros, G., Caidi, A., Terry, S., Chouaïb, S., Deloger, M., & Mami‐Chouaib, F. (2022) · Journal for ImmunoTherapy of Cancer · doi:10.1136/jitc-2022-004527 · Cited by 40
Oxygen-dependent regulation of immune checkpoint mechanisms
Ohta, A. (2018) · International Immunology · doi:10.1093/intimm/dxy038 · Cited by 38
Self-citationChallenges and solutions for therapeutic TCR ‐based agents
Malviya, M., Aretz, Z. E. H., Molvi, Z., Lee, J., Pierre, S. A., Wallisch, P., Dao, T., & Scheinberg, D. A. (2023) · Immunological Reviews · doi:10.1111/imr.13233 · Cited by 37
Lee, T. W., Lai, A., Harms, J. K., Singleton, D. C., Dickson, B. D., Macann, A., Hay, M. P., & Jamieson, S. M. F. (2020) · Cancers · doi:10.3390/cancers12123743 · Cited by 38
Concise Review: Targeting Cancer Stem Cells and Their Supporting Niche Using Oncolytic Viruses
Crupi, M. J. F., Bell, J. C., & Singaravelu, R. (2019) · Stem Cells · doi:10.1002/stem.3004 · Cited by 36
Song, C. W., Kim, H., Cho, H., Kim, M., Paek, S.-H., Park, H. J., Griffin, R. J., Terezakis, S. A., & Cho, L. C. (2022) · Cancers · doi:10.3390/cancers14133273 · Cited by 35
Multifaceted Interplay between Hormones, Growth Factors and Hypoxia in the Tumor Microenvironment
Lappano, R., Todd, L. A., Stanic, M., Cai, Q., Maggiolini, M., Marincola, F., & Pietrobon, V. (2022) · Cancers · doi:10.3390/cancers14030539 · Cited by 32
Mechanical Properties Affect Primary T Cell Activation in 3D Bioprinted Hydrogels
Joseph, J. P., Gugulothu, S. B., Nandi, D., & Chatterjee, K. (2023) · ACS Macro Letters · doi:10.1021/acsmacrolett.3c00271 · Cited by 32
Fink, C., Smith, M. H., Gaudet, J. M., Makela, A. V., Foster, P. J., & Dekaban, G. A. (2019) · Molecular Imaging and Biology · doi:10.1007/s11307-019-01393-8 · Cited by 32
Chemokine Receptors and Exercise to Tackle the Inadequacy of T Cell Homing to the Tumor Site
Idorn, M., & Straten, P. T. (2018) · Cells · doi:10.3390/cells7080108 · Cited by 34
A clinically acceptable strategy for sensitizing anti-PD-1 treatment by hypoxia relief
Jiang, M., Qin, B., Luo, L., Li, X., Shi, Y., Zhang, J., Luo, Z., Zhu, C., Guan, G., Du, Y., et al. (2021) · Journal of Controlled Release · doi:10.1016/j.jconrel.2021.06.001 · Cited by 30
Hatfield, S. M., Halpin-Veszeleiova, K., Steingold, J., Sethuraman, J., & Sitkovsky, M. V. (2019) · Advances in experimental medicine and biology · doi:10.1007/978-3-030-12734-3_8 · Cited by 32
Self-citationThe Immune Landscape of Pheochromocytoma and Paraganglioma: Current Advances and Perspectives
Uher, O., Vanova, K. H., Taïeb, D., Calsina, B., Robledo, M., Clifton-Bligh, R. J., & Pacák, K. (2024) · Endocrine Reviews · doi:10.1210/endrev/bnae005 · Cited by 31
Igniting Hope for Tumor Immunotherapy: Promoting the “Hot and Cold” Tumor Transition
Chen, W., Ma, Y., Wang, F., Liao, Y., Chen, Y., Zhao, B., Zhao, Q., Wang, D., & Tang, D. (2022) · Clinical Medicine Insights Oncology · doi:10.1177/11795549221120708 · Cited by 31
Rao, M., Dodoo, E., Zumla, A. I., & Maeurer, M. J. (2019) · Frontiers in Microbiology · doi:10.3389/fmicb.2019.00962 · Cited by 29
Link, B., Crigna, A. T., Hölzel, M., Giordano, F. A., & Golubnitschaja, O. (2021) · Journal of Clinical Medicine · doi:10.3390/jcm10215124 · Cited by 27
Halpin-Veszeleiova, K., & Hatfield, S. M. (2020) · Current Opinion in Pharmacology · doi:10.1016/j.coph.2020.07.005 · Cited by 31
Self-citationVenkatesh, G. H., Khouzam, R. A., El‐Sayed, W., Zeinelabdin, N. A., Terry, S., & Chouaı̈b, S. (2021) · OncoImmunology · doi:10.1080/2162402x.2021.1974233 · Cited by 25
Halpin-Veszeleiova, K., Mallouh, M. P., Williamson, L. M., Apro, A. C., Botticello-Romero, N. R., Bahr, C., Shin, M., Ward, K. M., Rosenberg, L., Ritov, V. B., et al. (2025) · JCI Insight · doi:10.1172/jci.insight.174675 · Cited by 28
Self-citationB7 immune-checkpoints as targets for the treatment of neuroendocrine tumors
Yuan, Z., Gardiner, J. C., Maggi, E. C., Huang, S., Adem, A., Bagdasarov, S., Li, G., Lee, S. Y., Slegowski, D., Exarchakis, A., et al. (2021) · Endocrine Related Cancer · doi:10.1530/erc-20-0337 · Cited by 21
T cell adaptation in chronic infections and tumors
Luxenburger, H., Thimme, R., & Hofmann, M. (2026) · Cellular and Molecular Immunology · doi:10.1038/s41423-026-01405-y · Cited by 20
Low‐Cost, High‐Pressure‐Synthesized Oxygen‐Entrapping Materials to Improve Treatment of Solid Tumors
Bi, J., Witt, E., Voltarelli, V. A., Feig, V. R., Venkatachalam, V., Boyce, H., McGovern, M., Gutierrez, W. R., Rytlewski, J. D., Bowman, K. R., et al. (2023) · Advanced Science · doi:10.1002/advs.202205995 · Cited by 21
Role of hyperoxic treatment in cancer
Kim, S. W., Kim, I. K., & Lee, S. H. (2020) · Experimental Biology and Medicine · doi:10.1177/1535370220921547 · Cited by 20
Oxygen therapeutic agents to target hypoxia in cancer treatment
Spiess, B. D. (2020) · Current Opinion in Pharmacology · doi:10.1016/j.coph.2020.09.009 · Cited by 20
Mechanisms of HIF-driven immunosuppression in tumour microenvironment
Bandopadhyay, S., & Patranabis, S. (2023) · Journal of the Egyptian National Cancer Institute · doi:10.1186/s43046-023-00186-z · Cited by 20
Mukherjee, S., & Ray, S. K. (2021) · Recent Patents on Anti-Cancer Drug Discovery · doi:10.2174/1574892816666210728115605 · Cited by 18
Role of innate immunity and systemic inflammation in cystic fibrosis disease progression
Purushothaman, A. K., & Nelson, E. J. R. (2023) · Heliyon · doi:10.1016/j.heliyon.2023.e17553 · Cited by 19
The Role of Metabolism in Tumor Immune Evasion: Novel Approaches to Improve Immunotherapy
Cruz‐Bermúdez, A., Briviesca, R. L., Casarrubios, M., Sierra‐Rodero, B., & Provencio, M. (2021) · Biomedicines · doi:10.3390/biomedicines9040361 · Cited by 20
Maggs, L., & Ferrone, S. (2020) · Clinical Cancer Research · doi:10.1158/1078-0432.ccr-20-0358 · Cited by 17
Khouzam, R. A., Sharda, M., Rao, R. S. P., Kyerewah-Kersi, S. M., Zeinelabdin, N. A., Mahmood, A. S., Nawafleh, H. H., Khan, M. S., Venkatesh, G. H., & Chouaı̈b, S. (2023) · Frontiers in Cell and Developmental Biology · doi:10.3389/fcell.2023.1095419 · Cited by 15
Use of Radiomics in Characterizing Tumor Hypoxia
Huang, M., Law, H., & Tam, S. Y. (2025) · International Journal of Molecular Sciences · doi:10.3390/ijms26146679 · Cited by 14
Luo, A., Gong, Y., Kim, H., & Chen, Y. (2020) · NAR Cancer · doi:10.1093/narcan/zcaa010 · Cited by 14
Koukourakis, I. M., Giatromanolaki, A. N., Mitrakas, A. G., & Koukourakis, M. I. (2022) · Cellular Immunology · doi:10.1016/j.cellimm.2022.104495 · Cited by 14
Pro-tumorigenic role of type 2 diabetes-induced cellular senescence in colorectal cancer
Melia, F., Udomjarumanee, P., Zinovkin, D. A., Arghiani, N., & Pranjol, M. Z. I. (2022) · Frontiers in Oncology · doi:10.3389/fonc.2022.975644 · Cited by 14
The Role of Biomimetic Hypoxia on Cancer Cell Behaviour in 3D Models: A Systematic Review
Liu, Y., Mohri, Z., Alsheikh, W., & Cheema, U. (2021) · Cancers · doi:10.3390/cancers13061334 · Cited by 14
The Therapeutic Potential of Physical Exercise in Cancer: The Role of Chemokines
Buzaglo, G. B. B., Telles, G. D., Araújo, R. B., Dias, G., Ruberti, O. M., Ferreira, M. L. V., Derchain, S., VECHIN, F. C., & Conceição, M. S. (2024) · International Journal of Molecular Sciences · doi:10.3390/ijms252413740 · Cited by 12
Shayan, S., Arashkia, A., & Azadmanesh, K. (2022) · Cancer Cell International · doi:10.1186/s12935-022-02774-w · Cited by 10
Moving toward improved immune checkpoint immunotherapy for advanced prostate cancer
Velasco, M. A. D., Kura, Y., Fujita, K., & Uemura, H. (2024) · International Journal of Urology · doi:10.1111/iju.15378 · Cited by 11
Taghizadeh‐Hesary, F., Ghadyani, M., Kashanchi, F., & Behnam, B. (2024) · Cancers · doi:10.3390/cancers16173044 · Cited by 9
Geng, S., Zhu, L., Wang, Y., Liu, Q., Yu, C., Shi, S. R., & Yu, S. (2024) · International Immunopharmacology · doi:10.1016/j.intimp.2024.113535 · Cited by 9
Tackling HLA Deficiencies Head on with Oncolytic Viruses
Fisher, K. D., Hazini, A., & Seymour, L. W. (2021) · Cancers · doi:10.3390/cancers13040719 · Cited by 10
Hypoxia as a signal for prison breakout in cancer
Redfern, A. D., Agarwal, V., & Thompson, E. W. (2019) · Current Opinion in Clinical Nutrition & Metabolic Care · doi:10.1097/mco.0000000000000577 · Cited by 9
Mastrogiovanni, M., Donnadieu, E., Pathak, R., & Bartolo, V. D. (2024) · Biology · doi:10.3390/biology13110860 · Cited by 8
Zhao, K., Huang, Y., Chang, L., Wang, B., Ye, M., & Qi, J. (2025) · Frontiers in Oncology · doi:10.3389/fonc.2025.1691719 · Cited by 8
Immunologically relevant effects of radiation therapy on the tumor microenvironment
Galassi, C., Klapp, V., Formenti, S. C., Demaria, S., & Galluzzi, L. (2023) · Essays in Biochemistry · doi:10.1042/ebc20220248 · Cited by 8
Safa, A., Vruzhaj, I., Gambirasi, M., & Toffoli, G. (2025) · Cancers · doi:10.3390/cancers17213506 · Cited by 7
Therapeutic advantage of combinatorial chimeric antigen receptor T cell and chemotherapies
Ward, M. B., Jones, A. B., & Krenciute, G. (2024) · Pharmacological Reviews · doi:10.1124/pharmrev.124.001070 · Cited by 7
Wada, A., Hirohashi, Y., Kutomi, G., Murata, K., Iwabuchi, S., Mizue, Y., Murai, A., Kyuno, D., Shima, H., Minowa, T., et al. (2023) · Cancer Science · doi:10.1111/cas.15986 · Cited by 7
From Hypoxia to Bone: Reprogramming the Prostate Cancer Metastatic Cascade
Santos, M. D. O., Koushyar, S., Dart, D. A., & Onganer, P. U. (2025) · International Journal of Molecular Sciences · doi:10.3390/ijms26157452 · Cited by 6
The cancer-immunity cycle in motion: The effects of exercise on antitumor immunity
Leuchte, K., Trommer, M., Olofsson, G. H., & Straten, P. T. (2025) · Immunology Letters · doi:10.1016/j.imlet.2025.107101 · Cited by 7
Mohan, N., Wellach, K., Özerdem, C., Veits, N., Förster, J. D., Föehr, S., Bonsack, M., & Riemer, A. B. (2022) · Frontiers in Immunology · doi:10.3389/fimmu.2022.918528 · Cited by 6
Alim, L., Adityan, S., Chen, R., Neilson, T., Coleborn, E., Wilkinson, A., He, Y., Irgam, G., Bhavsar, C., Lourie, R., et al. (2025) · Biomedicine & Pharmacotherapy · doi:10.1016/j.biopha.2025.118141 · Cited by 4
Nanomedicine-Mediated Immunotherapy for Cancer Treatment
Hou, W., Song, W., Zhang, R., Lomova, M. V., Sadovnikov, А. V., & Song, Y. J. (2026) · ACS Biomaterials Science & Engineering · doi:10.1021/acsbiomaterials.5c02061 · Cited by 4
Targeting lung cancer utilizing smart nanoparticles: Nanomedicine meets tumor stroma
Guo, F.-Y., & Pan, Y.-Z. (2025) · Bioorganic Chemistry · doi:10.1016/j.bioorg.2025.109202 · Cited by 3
Gao, X., Sun, L., Li, T., Li, P., Liu, C., Li, Q., & Zhu, Y. (2025) · Frontiers in Immunology · doi:10.3389/fimmu.2025.1647988 · Cited by 3
Hypoxia induced VEGF secretion promotes resistance to bispecific T-cell engagers
Xu, M., Barakzai, S., Kumar, R., Veillard, I. E., Kim, E., Bregar, A. J., Eisenhauer, E. L., Penson, R. T., Bouberhan, S., Filipi, J., et al. (2025) · Signal Transduction and Targeted Therapy · doi:10.1038/s41392-025-02505-3 · Cited by 3
Inhibitory effect of Endostar on HIF-1 with upregulation of MHC-I in lung cancer cells
Zhao, M., Zheng, H.-F., Wang, J.-N., Zhang, Y., Wang, H., & Zhao, Z.-W. (2025) · Cancer Biology & Therapy · doi:10.1080/15384047.2025.2508535 · Cited by 2
Metadata
- Authors
- Sethumadhavan, S., Silva, M., Philbrook, P., Nguyen, T., Hatfield, S. M., Ohta, A., & Sitkovsky, M. V.
- Affiliations
- Northeastern University (US)
- Corresponding author
- Sitkovsky, Michail V.
- ORCID
- Venue
- PLOS ONE
- Publisher
- Public Library of Science (PLoS)
- Published
- 2017-11-20
- Volume
- 12
- Issue
- 11
- Pages
- e0187314
- ISSN
- 1932-6203 (ISSN-L)
- PMC
- PMC5695785
- OpenAlex
- W2769873734
- Cited by
- 119
- References
- 48
- Citations by year
- 2026: 6 · 2025: 20 · 2024: 12 · 2023: 19 · 2022: 11 · 2021: 15 · 2020: 19 · 2019: 13 · 2018: 4
- FWCI
- 4.46
- Type
- journal article
- Language
- en
- Open access
- gold
- doi.org
- Licence
- Locations
- PLoS ONE (publishedVersion, cc-by)
- PubMed Central (publishedVersion, cc-by)
- PubMed (publishedVersion)
- DOAJ (DOAJ: Directory of Open Access Journals) (submittedVersion, cc-by-sa)
- Figshare (submittedVersion, cc-by)
- Funders
- National Institutes of Health (R01GM)
- National Cancer Institute (R01CA112561, R01CA111985)
- National Institute of General Medical Sciences (R01GM097320)
- National Center for Complementary and Integrative Health (R21AT002788)
- Topics
- Life Sciences › Immunology and Microbiology › Immunology › Immunotherapy and Immune Responses
- Life Sciences › Biochemistry, Genetics and Molecular Biology › Cancer Research › Cancer, Hypoxia, and Metabolism
- Health Sciences › Medicine › Oncology › Cancer Immunotherapy and Biomarkers
- Keywords
- tumor hypoxia, hypoxia-inducible factor, MHC class I downregulation, antigen presentation, tumor microenvironment, immune evasion, T cell recognition, VHL, LMP7, hyperoxia, renal cell carcinoma, cancer vaccines, immune epitopes
- MeSH terms
- ATP Binding Cassette Transporter, Subfamily B, Member 2, Antigen-Presenting Cells, Genes, MHC Class I, Humans, Kidney Neoplasms, Oxygen, T-Lymphocytes, Transcriptional Activation, Cell Hypoxia, Gene Expression Regulation, Neoplastic, Proteasome Endopeptidase Complex, Hypoxia-Inducible Factor 1, Von Hippel-Lindau Tumor Suppressor Protein, Tumor Microenvironment
About these checks
Registry, retraction, Cites and statistics results are computed, not judged, with one exception: a printed reference that no index lists is read once by a model before it counts as a citation error. Claims are extracted by a model and kept only when their quote appears verbatim in the text; each cited source is then checked, with a model’s help, for whether it says what the claim relies on. Those verdicts can be wrong — read the claim’s quote and the cited source before relying on one.
Statistics and arithmetic are recomputed, not judged.
Confidence bands are shown only for fields calibrated on our annotated test set. None is calibrated yet, so no band is shown.
What counts as a claim ›How we measure confidence ›How we check this ›
Are you an author, or do you see a problem with this page? Request a review
