

Membrane Damage Elicits an Immunomodulatory Program in Staphylococcus aureus
Open accessThe DOI matches its Crossref record; 61 of the 62 references it cites were found in a registry or an index.
Abstract
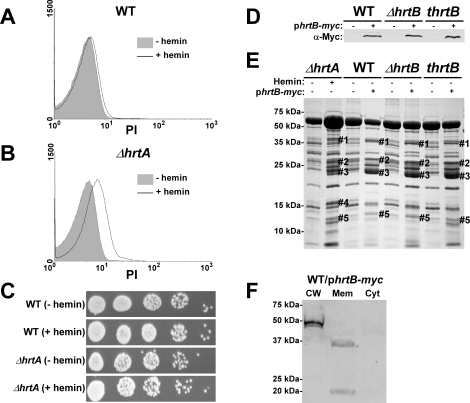
The Staphylococcus aureus HrtAB system is a hemin-regulated ABC transporter composed of an ATPase (HrtA) and a permease (HrtB) that protect S. aureus against hemin toxicity. S. aureus strains lacking hrtA exhibit liver-specific hyper-virulence and upon hemin exposure over-express and secrete immunomodulatory factors that interfere with neutrophil recruitment to the site of infection. It has been proposed that heme accumulation in strains lacking hrtAB is the signal which triggers S. aureus to elaborate this anti-neutrophil response. However, we report here that S. aureus strains expressing catalytically inactive HrtA do not elaborate the same secreted protein profile. This result indicates that the physical absence of HrtA is responsible for the increased expression of immunomodulatory factors, whereas deficiencies in the ATPase activity of HrtA do not contribute to this process. Furthermore, HrtB expression in strains lacking hrtA decreases membrane integrity consistent with dysregulated permease function. Based on these findings, we propose a model whereby hemin-mediated over-expression of HrtB in the absence of HrtA damages the staphylococcal membrane through pore formation. In turn, S. aureus senses this membrane damage, triggering the increased expression of immunomodulatory factors. In support of this model, wildtype S. aureus treated with anti-staphylococcal channel-forming peptides produce a secreted protein profile that mimics the effect of treating DeltahrtA with hemin. These results suggest that S. aureus senses membrane damage and elaborates a gene expression program that protects the organism from the innate immune response of the host.
Overview
The claims and statistics of this paper haven’t been checked yet.
Free: it reads the open-access text and checks the first 5 claims that cite a source we can check. Create a free account to check every claim.
Integrity signals
Registry
Cites
Statistics
Figures





Verification
Claims the paper makes
The claims and statistics of this paper haven’t been checked yet.
Free: it reads the open-access text and checks the first 5 claims that cite a source we can check. Create a free account to check every claim.
Claims other papers make about this one
Each is checked against this paper’s own text: does it say what the citing paper says it does?
In the citing paper
“Further experiments revealed that inactivation of HrtA leads to membrane damage which triggers increased expression and secretion of immunomodulatory factors [132].”
From Metal ion acquisition in Staphylococcus aureus: overcoming nutritional immunity (2012) · cites this paper as [132]
In the citing paper
“This phenomenon has a dramatic effect on the virulence of S. aureus (discussed below).”
From Molecular Mechanisms of Staphylococcus aureus Iron Acquisition (2011) · cites this paper as [4]
In the citing paper
“HrtB expression in the absence of HrtA results in a decrease in the integrity of the membrane and an altered protein secretion profile (4).”
From Molecular Mechanisms of Staphylococcus aureus Iron Acquisition (2011) · cites this paper as [4]
In the citing paper
“The increased secretion of immunomodulatory proteins that leads to the hypervirulent phenotype is due to a loss of membrane integrity in the hrtA mutant (4).”
From Molecular Mechanisms of Staphylococcus aureus Iron Acquisition (2011) · cites this paper as [4]
Self-check
Percentages, sums and reported differences re-computed from the paper’s own numbers.
The self-check needs the paper’s full text.
Citations
Cites
Staphylococcus aureus Infections
Lowy, F. D. (1998) · New England Journal of Medicine · doi:10.1056/nejm199808203390806 · Cited by 6,005
Antimicrobial peptides: pore formers or metabolic inhibitors in bacteria?
Brogden, K. A. (2005) · Nature Reviews Microbiology · doi:10.1038/nrmicro1098 · Cited by 5,829 · cited 2×
“In general, AMPs exert their antimicrobial activity through pore formation or membrane barrier disruption, however some AMPs mediate their antibacterial activity through altering septum formation or inhibiting cell-wall, nucleic-acid, or protein synthesis [34,35,36].”
BackgroundKlevens, R. M. (2007) · JAMA · doi:10.1001/jama.298.15.1763 · Cited by 3,726 · cited 1×
“more serious diseases such as endocarditis, septicemia, pneumonia and toxic shock syndrome [3,4].”
BackgroundMode of action of membrane active antimicrobial peptides
Shai, Y. (2002) · Peptide Science · doi:10.1002/bip.10260 · Cited by 1,576 · cited 2×
“On the other hand, several AMPs, including the widely expressed human LL37, have been described to perturb membranes through what is known as the ‘‘carpet’’ or ‘‘detergent like’’ mechanism [23,37].”
BackgroundStructure, Function, and Evolution of Bacterial ATP-Binding Cassette Systems
Davidson, A. L., Dassa, E., Orelle, C., & Chen, J. (2008) · Microbiology and Molecular Biology Reviews · doi:10.1128/mmbr.00031-07 · Cited by 1,420 · cited 1×
“the transport of solutes across the membrane [17,18].”
BackgroundDiekema, D. J., Pfaller, M. A., Schmitz, F. J., Smayevsky, J., Bell, J., Jones, R. N., Beach, M., & SENTRY Participants Group (2001) · Clinical Infectious Diseases · doi:10.1086/320184 · Cited by 1,362
Isolation and Characterization of Human μ-Defensin-3, a Novel Human Inducible Peptide Antibiotic
Harder, J., Bartels, J., Christophers, E., & Schröder, J.-M. (2001) · Journal of Biological Chemistry · doi:10.1074/jbc.m008557200 · Cited by 1,311
Autoinduction and signal transduction in the regulation of staphylococcal virulence
Novick, R. P. (2003) · Molecular Microbiology · doi:10.1046/j.1365-2958.2003.03526.x · Cited by 1,280 · cited 1×
“aureus [40,41,42].”
Wertheim, H. F., Vos, M. C., Ott, A., van Belkum, A., Voss, A., Kluytmans, J. A., van Keulen, P. H., Vandenbroucke-Grauls, C. M., Meester, M. H., & Verbrugh, H. A. (2004) · The Lancet · doi:10.1016/s0140-6736(04)16897-9 · Cited by 892 · cited 1×
“of the population [1].”
The ATP switch model for ABC transporters
Higgins, C. F., & Linton, K. J. (2004) · Nature Structural & Molecular Biology · doi:10.1038/nsmb836 · Cited by 748 · cited 1×
“export waste and toxic products [16].”
ATP-Binding Cassette Transporters in Bacteria
Davidson, A. L., & Chen, J. (2004) · Annual Review of Biochemistry · doi:10.1146/annurev.biochem.73.011303.073626 · Cited by 666 · cited 1×
“ABC transporters represent one of the largest protein superfamilies in both eukaryotes and bacteria [15].”
BackgroundDunman, P. M., Murphy, E., Haney, S., Palacios, D., Tucker-Kellogg, G., Wu, S., Brown, E. L., Zagursky, R. J., Shlaes, D., & Projan, S. J. (2001) · Journal of Bacteriology · doi:10.1128/jb.183.24.7341-7353.2001 · Cited by 648 · cited 3×
“It was shown that ssl4 (set9) is up-regulated in a SarA-dependent manner while ssl3 (set8) is up-regulated in an agr-dependent manner [49].”
BackgroundInfluentialStaphylococcal Coagulase: Mode of Action and Antigenicity
DUTHIE, E. S., & LORENZ, L. L. (1952) · Microbiology · doi:10.1099/00221287-6-1-2-95 · Cited by 622 · cited 10×
“A subset of these strains (UAMS-1, USA100, and USA300) exhibit altered expression of proteins migrating at the predicted size for the immunomodulatory proteins affected in the Newman strain.”
MethodInfluentialAllelic replacement in Staphylococcus aureus with inducible counter-selection
Bae, T., & Schneewind, O. (2006) · Plasmid · doi:10.1016/j.plasmid.2005.05.005 · Cited by 621 · cited 3×
“aureus mutant strain lacking ssls 1-11 (Dssl1-11) was constructed using the pKOR-1 plasmid as described by [54].”
MethodPassage of Heme-Iron Across the Envelope of Staphylococcus aureus
Mazmanian, S. K., Skaar, E. P., Gaspar, A. H., Humayun, M., Gornicki, P., Jelenska, J., Joachmiak, A., Missiakas, D. M., & Schneewind, O. (2003) · Science · doi:10.1126/science.1081147 · Cited by 593 · cited 2×
“combined action of the iron regulated surface determinant (Isd) system and the heme transport system (Hts) [7,8,9,10,11].”
BackgroundMethodSelf-citationHolland, I. B., & A. Blight, M. (1999) · Journal of Molecular Biology · doi:10.1006/jmbi.1999.2993 · Cited by 578 · cited 1×
“the transport of solutes across the membrane [17,18].”
Background[27] Genetic systems in Staphylococci
Novick, R. P. (1991) · Methods in Enzymology · doi:10.1016/0076-6879(91)04029-n · Cited by 568 · cited 2×
“aureus RN4220 [57] followed by transformation into the respective electrocompetent S.”
BackgroundRecognition of Antimicrobial Peptides by a Bacterial Sensor Kinase
Bader, M. W., Sanowar, S., Daley, M. E., Schneider, A. R., Cho, U., Xu, W., Klevit, R. E., Le Moual, H., & Miller, S. I. (2005) · Cell · doi:10.1016/j.cell.2005.05.030 · Cited by 567 · cited 1×
“Among these systems, the Gram negative PhoPQ system is the best characterized [38].”
BackgroundInsights into Mechanisms Used by Staphylococcus aureus to Avoid Destruction by Human Neutrophils
Voyich, J. M., Braughton, K. R., Sturdevant, D. E., Whitney, A. R., Saïd-Salim, B., Porcella, S. F., Long, R. D., Dorward, D. W., Gardner, D. J., Kreiswirth, B. N., et al. (2005) · The Journal of Immunology · doi:10.4049/jimmunol.175.6.3907 · Cited by 563
Alternative mechanisms of action of cationic antimicrobial peptides on bacteria
Hale, J. D., & Hancock, R. E. (2007) · Expert Review of Anti-infective Therapy · doi:10.1586/14787210.5.6.951 · Cited by 549 · cited 1×
“In general, AMPs exert their antimicrobial activity through pore formation or membrane barrier disruption, however some AMPs mediate their antibacterial activity through altering septum formation or inhibiting cell-wall, nucleic-acid, or protein synthesis [34,35,36].”
BackgroundTabb, D. L., Fernando, C. G., & Chambers, M. C. (2007) · Journal of Proteome Research · doi:10.1021/pr0604054 · Cited by 546 · cited 1×
“instrument and separated as described [59].”
The bacterial superantigen and superantigen‐like proteins
Fraser, J. D., & Proft, T. (2008) · Immunological Reviews · doi:10.1111/j.1600-065x.2008.00681.x · Cited by 495 · cited 4×
“However, very little is known about the regulation of these exotoxins [19].”
BackgroundInfluentialRegulation of virulence determinants in vitro and in vivo in Staphylococcus aureus
Cheung, A. L., Bayer, A. S., Zhang, G., Gresham, H., & Xiong, Y.-Q. (2004) · FEMS Immunology & Medical Microbiology · doi:10.1016/s0928-8244(03)00309-2 · Cited by 449 · cited 1×
“aureus [40,41,42].”
Proteomic Parsimony through Bipartite Graph Analysis Improves Accuracy and Transparency
Zhang, B., Chambers, M. C., & Tabb, D. L. (2007) · Journal of Proteome Research · doi:10.1021/pr070230d · Cited by 373 · cited 1×
“Protein reassembly from identified peptide sequences was done as previously described [60].”
MethodImproved method for electroporation of Staphylococcus aureus
Schenk, S., & Laddaga, R. A. (1992) · FEMS Microbiology Letters · doi:10.1111/j.1574-6968.1992.tb05302.x · Cited by 344 · cited 1×
“aureus strain using the protocol described [58].”
Staphylococcus aureus virulence genes identified by bursa aurealis mutagenesis and nematode killing
Bae, T., Banger, A. K., Wallace, A., Glass, E. M., Åslund, F., Schneewind, O., & Missiakas, D. M. (2004) · Proceedings of the National Academy of Sciences · doi:10.1073/pnas.0404728101 · Cited by 315 · cited 2×
“An erythromycin cassette insertion mutant of hrtA was obtained from the Phoenix (N) library (thrtA) [13,53].”
MethodStaphylococcus aureus IsdB Is a Hemoglobin Receptor Required for Heme Iron Utilization
Torres, V. J., Pishchany, G., Humayun, M., Schneewind, O., & Skaar, E. P. (2006) · Journal of Bacteriology · doi:10.1128/jb.01335-06 · Cited by 302 · cited 1×
“combined action of the iron regulated surface determinant (Isd) system and the heme transport system (Hts) [7,8,9,10,11].”
BackgroundSelf-citationGram-positive three-component antimicrobial peptide-sensing system
Li, M., Lai, Y., Villaruz, A. E., Cha, D. J., Sturdevant, D. E., & Otto, M. (2007) · Proceedings of the National Academy of Sciences · doi:10.1073/pnas.0702159104 · Cited by 288 · cited 2×
“The Aps/Gra system is a three component bacterial sensing system that senses AMPs to induce a resistance response that includes modification of cell surface components and increased expression of putative AMP transporters [25,39,40].”
BackgroundIsdG and IsdI, Heme-degrading Enzymes in the Cytoplasm of Staphylococcus aureus
Skaar, E. P., Gaspar, A. H., & Schneewind, O. (2004) · Journal of Biological Chemistry · doi:10.1074/jbc.m307952200 · Cited by 282 · cited 1×
“combined action of the iron regulated surface determinant (Isd) system and the heme transport system (Hts) [7,8,9,10,11].”
BackgroundSelf-citationRationalizing membrane protein overexpression
Wagner, S., Bader, M. L., Drew, D., & de Gier, J.-W. (2006) · Trends in Biotechnology · doi:10.1016/j.tibtech.2006.06.008 · Cited by 270 · cited 1×
“These possibilities are in accordance with the observation that over-expression of membrane proteins usually leads to reduced growth rates that are generally assumed to be due to negative effects on membrane integrity [29].”
ResultHost defense and pathogenesis in Staphylococcus aureus infections
DeLeo, F. R., Diep, B. A., & Otto, M. (2009) · Infectious Disease Clinics of North America · doi:10.1016/j.idc.2008.10.003 · Cited by 269 · cited 1×
“employs an arsenal of virulence factors including proteins that contribute to immune evasion and alter immune system function”
BackgroundHost defenses against Staphylococcus aureus infection require recognition of bacterial lipoproteins
Bubeck Wardenburg, J., Williams, W. A., & Missiakas, D. (2006) · Proceedings of the National Academy of Sciences · doi:10.1073/pnas.0603072103 · Cited by 262 · cited 1×
“aureus shuttle vector pOS1-plgt [56] which had been digested with the same restriction enzymes.”
MethodHerbert, S., Bera, A., Nerz, C., Kraus, D., Peschel, A., Goerke, C., Meehl, M., Cheung, A., & Götz, F. (2007) · PLoS Pathogens · doi:10.1371/journal.ppat.0030102 · Cited by 247 · cited 2×
“The Aps/Gra system is a three component bacterial sensing system that senses AMPs to induce a resistance response that includes modification of cell surface components and increased expression of putative AMP transporters [25,39,40].”
BackgroundA Staphylococcus aureus Regulatory System that Responds to Host Heme and Modulates Virulence
Torres, V. J., Stauff, D. L., Pishchany, G., Bezbradica, J. S., Gordy, L. E., Iturregui, J., Anderson, K. L., Dunman, P. M., Joyce, S., & Skaar, E. P. (2007) · Cell Host & Microbe · doi:10.1016/j.chom.2007.03.001 · Cited by 241 · cited 10×
“recruitment to the site of infection [13,19,20,21].”
InfluentialSelf-citationLangley, R., Wines, B., Willoughby, N., Basu, I., Proft, T., & Fraser, J. D. (2005) · The Journal of Immunology · doi:10.4049/jimmunol.174.5.2926 · Cited by 236 · cited 2×
“For instance Ssl7 binds IgA and complement C5, blocking IgA-FcR interactions and complement activation [26].”
BackgroundStaphylococcus aureus Redirects Central Metabolism to Increase Iron Availability
Friedman, D. B., Stauff, D. L., Pishchany, G., Whitwell, C. W., Torres, V. J., & Skaar, E. P. (2006) · PLoS Pathogens · doi:10.1371/journal.ppat.0020087 · Cited by 222 · cited 1×
“HrtAB is up-regulated approximately 45-fold [28].”
Self-citationPorcelli, F., Verardi, R., Shi, L., Henzler-Wildman, K. A., Ramamoorthy, A., & Veglia, G. (2008) · Biochemistry · doi:10.1021/bi702036s · Cited by 215 · cited 1×
“On the other hand, several AMPs, including the widely expressed human LL37, have been described to perturb membranes through what is known as the ‘‘carpet’’ or ‘‘detergent like’’ mechanism [23,37].”
BackgroundGeiger, T., Goerke, C., Mainiero, M., Kraus, D., & Wolz, C. (2008) · Journal of Bacteriology · doi:10.1128/jb.01927-07 · Cited by 197 · cited 13×
“aureus virulence regulator Sae is highly activated upon exposure to a-defensins and H2O2 but not LL37 [43].”
BackgroundInfluentialLai, Y., Villaruz, A. E., Li, M., Cha, D. J., Sturdevant, D. E., & Otto, M. (2007) · Molecular Microbiology · doi:10.1111/j.1365-2958.2006.05540.x · Cited by 183 · cited 3×
“The Aps/Gra system is a three component bacterial sensing system that senses AMPs to induce a resistance response that includes modification of cell surface components and increased expression of putative AMP transporters [25,39,40].”
BackgroundStaphylococcal superantigen-like 5 binds PSGL-1 and inhibits P-selectin–mediated neutrophil rolling
Bestebroer, J., Poppelier, M. J. J. G., Ulfman, L. H., Lenting, P. J., Denis, C. V., van Kessel, K. P. M., van Strijp, J. A. G., & de Haas, C. J. C. (2007) · Blood · doi:10.1182/blood-2006-06-015461 · Cited by 183
Neutrophil antibacterial peptides, multifunctional effector molecules in the mammalian immune system
Gudmundsson, G. H., & Agerberth, B. (1999) · Journal of Immunological Methods · doi:10.1016/s0022-1759(99)00152-0 · Cited by 171 · cited 1×
“aureus faces an array of membrane damaging peptides and small proteins that perturb the cell membrane leading to cell leakage and eventually death [30,31].”
BackgroundPalazzolo-Ballance, A. M., Reniere, M. L., Braughton, K. R., Sturdevant, D. E., Otto, M., Kreiswirth, B. N., Skaar, E. P., & DeLeo, F. R. (2008) · The Journal of Immunology · doi:10.4049/jimmunol.180.1.500 · Cited by 142 · cited 1×
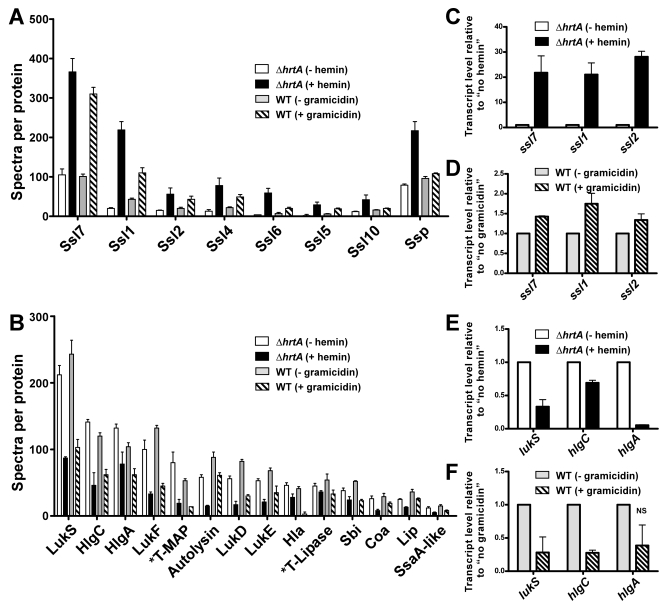
“When the CAMRSA strain MW2 was exposed to neutrophil azurophilic granule proteins [46], there was an up-regulation of genes encoding numerous virulence factors including hemolysins (hla, hld, hlgA, hlgB, and hlgC) and leukotoxins (lukS and lukF) in addition to several immunomodulatory toxins belonging to the Ssl group…”
BackgroundSelf-citationLukomski, S., Hoe, N. P., Abdi, I., Rurangirwa, J., Kordari, P., Liu, M., Dou, S.-J., Adams, G. G., & Musser, J. M. (2000) · Infection and Immunity · doi:10.1128/iai.68.2.535-542.2000 · Cited by 137 · cited 1×
“The resulting plasmid was digested with XmaI and ligated to the non-polar spectinomycin cassette from plasmid pSL60-1[55].”
MethodA New Staphylococcal Anti-Inflammatory Protein That Antagonizes the Formyl Peptide Receptor-Like 1
Prat, C., Bestebroer, J., de Haas, C. J. C., van Strijp, J. A. G., & van Kessel, K. P. M. (2006) · The Journal of Immunology · doi:10.4049/jimmunol.177.11.8017 · Cited by 133 · cited 1×
“recruitment to the site of infection [13,19,20,21].”
Williams, R. J., Ward, J. M., Henderson, B., Poole, S., O'Hara, B. P., Wilson, M., & Nair, S. P. (2000) · Infection and Immunity · doi:10.1128/iai.68.8.4407-4415.2000 · Cited by 131 · cited 1×
“recruitment to the site of infection [13,19,20,21].”
Kraus, D., Herbert, S., Kristian, S. A., Khosravi, A., Nizet, V., Götz, F., & Peschel, A. (2008) · BMC Microbiology · doi:10.1186/1471-2180-8-85 · Cited by 100 · cited 1×
“aureus Aps/Gra system is a two-component system responsible for resistance to antimicrobial peptides suggesting a potential involvement in the response to gramicidin reported here [24,25].”
BackgroundIntracellular metalloporphyrin metabolism in Staphylococcus aureus
Reniere, M. L., Torres, V. J., & Skaar, E. P. (2007) · BioMetals · doi:10.1007/s10534-006-9032-0 · Cited by 99 · cited 1×
“combined action of the iron regulated surface determinant (Isd) system and the heme transport system (Hts) [7,8,9,10,11].”
BackgroundSelf-citationStauff, D. L., Torres, V. J., & Skaar, E. P. (2007) · Journal of Biological Chemistry · doi:10.1074/jbc.m703797200 · Cited by 95 · cited 1×
“aureus senses heme exposure through the HssRS twocomponent system [12,13] resulting in the up-regulation of the heme regulated transporter (HrtAB).”
BackgroundSelf-citationStaphylococcal SSL5 inhibits leukocyte activation by chemokines and anaphylatoxins
Bestebroer, J., van Kessel, K. P. M., Azouagh, H., Walenkamp, A., Boer, I. G. J., Romijn, R. A., van Strijp, J. A. G., & de Haas, C. J. C. (2008) · Blood · doi:10.1182/blood-2008-04-153882 · Cited by 88 · cited 1×
“Both Ssl5 and Ssl11 inhibit neutrophil rolling while Ssl5 was recently shown to inhibit leukocyte activation by chemokines and anaphylatoxins [27,47].”
BackgroundStauff, D. L., Bagaley, D., Torres, V. J., Joyce, R., Anderson, K. L., Kuechenmeister, L., Dunman, P. M., & Skaar, E. P. (2008) · Journal of Bacteriology · doi:10.1128/jb.01921-07 · Cited by 83 · cited 5×
“(B) Exoprotein profiles of wildtype transformed with control plasmid pOS1 and DhrtA transformed with control plasmid or plasmids expressing WT HrtA, catalytically inactive HrtA variants (K45A, G145A, G145T, and E167Q) or partially catalytically active HrtA (R76A) [14].”
BackgroundMethodSelf-citationDinulos, J. G. H., Mentele, L., Fredericks, L. P., Dale, B. A., & Darmstadt, G. L. (2003) · Clinical and Vaccine Immunology · doi:10.1128/cdli.10.1.161-166.2003 · Cited by 82
Subcellular Localization of the Staphylococcus aureus Heme Iron Transport Components IsdA and IsdB
Pishchany, G., Dickey, S. E., & Skaar, E. P. (2009) · Infection and Immunity · doi:10.1128/iai.01531-08 · Cited by 77 · cited 1×
“combined action of the iron regulated surface determinant (Isd) system and the heme transport system (Hts) [7,8,9,10,11].”
BackgroundSelf-citationSass, V., Pag, U., Tossi, A., Bierbaum, G., & Sahl, H. (2008) · International Journal of Medical Microbiology · doi:10.1016/j.ijmm.2008.01.011 · Cited by 74
Staphylococcal Superantigen-like 10 Inhibits CXCL12-Induced Human Tumor Cell Migration
Walenkamp, A., Boer, I. G. J., Bestebroer, J., Rozeveld, D., Timmer‐Bosscha, H., Hemrika, W., van Strijp, J. A. G., & de Haas, C. J. C. (2009) · Neoplasia · doi:10.1593/neo.81508 · Cited by 72 · cited 1×
“. In addition, Ssl10 inhibits CXCL12-induced human tumor cell migration”
BackgroundBiophysical and Biological Studies of End-Group-Modified Derivatives of Pep-1
Weller, K., Lauber, S., Lerch, M., Renaud, A., Merkle, H. P., & Zerbe, O. (2005) · Biochemistry · doi:10.1021/bi051535d · Cited by 57 · cited 4×
“Analysis was performed on a FACSCalibur system, (BD, Franklin Lakes, NJ) using Cell Quest Pro software (BD).”
MethodInfluentialDiversity in Antistaphylococcal Mechanisms among Membrane-Targeting Antimicrobial Peptides
Koo, S.-P., Bayer, A. S., & Yeaman, M. R. (2001) · Infection and Immunity · doi:10.1128/iai.69.8.4916-4922.2001 · Cited by 52 · cited 1×
“In general, AMPs exert their antimicrobial activity through pore formation or membrane barrier disruption, however some AMPs mediate their antibacterial activity through altering septum formation or inhibiting cell-wall, nucleic-acid, or protein synthesis [34,35,36].”
BackgroundIRON AND INFECTION: MOLECULAR, PHYSIOLOGICAL AND CLINICAL ASPECTS, 2ND EDITION
Bullen, J. J., Griffiths, E., & Edmiston, C. E. (1999) · Shock · doi:10.1097/00024382-199911000-00013 · Cited by 50 · cited 1×
“faces several barriers that interfere with its ability to replicate and colonize its host. One of these barriers is the paucity of free iron, which is a critical component of several reactions within the bacterial cell”
BackgroundInnate defences against methicillin‐resistant Staphylococcus aureus (MRSA) infection
Komatsuzawa, H., Ouhara, K., Yamada, S., Fujiwara, T., Sayama, K., Hashimoto, K., & Sugai, M. (2005) · The Journal of Pathology · doi:10.1002/path.1898 · Cited by 48 · cited 1×
“aureus faces an array of membrane damaging peptides and small proteins that perturb the cell membrane leading to cell leakage and eventually death [30,31].”
BackgroundFung, S. K., O'Grady, S., Kennedy, C., Dedier, H., Campbell, I., & Conly, J. M. (2000) · Infection Control and Hospital Epidemiology · doi:10.1086/501709 · Cited by 33 · cited 1×
“colonization and infections [50,51].”
Fournier, B., & Klier, A. F. (2003) · Molecular Microbiology · doi:10.1046/j.1365-2958.2003.03792.x · Cited by 31
Infective endocarditis in a hemodialysis patient: A dreaded complication
Schubert, C., & Moosa, M. R. (2007) · Hemodialysis International · doi:10.1111/j.1542-4758.2007.00204.x · Cited by 16 · cited 1×
“colonization and infections [50,51].”
Cited by
Sully, E. K., Malachowa, N., Elmore, B. O., Alexander, S. M., Femling, J. K., Gray, B. M., DeLeo, F. R., Otto, M., Cheung, A. L., Edwards, B. S., et al. (2014) · PLoS Pathogens · doi:10.1371/journal.ppat.1004174 · Cited by 386
“S4B), properties that are altered by antibiotic compounds that could affect agr signaling [24,25] and that could be impaired by agr-independent, non-specific toxic effects [6].”
BackgroundMethodMolecular Mechanisms of Staphylococcus aureus Iron Acquisition
Hammer, N. D., & Skaar, E. P. (2011) · Annual Review of Microbiology · doi:10.1146/annurev-micro-090110-102851 · Cited by 379
“HrtB expression in the absence of HrtA results in a decrease in the integrity of the membrane and an altered protein secretion profile (4).”
BackgroundSelf-citationA play in four acts: Staphylococcus aureus abscess formation
Cheng, A. G., DeDent, A. C., Schneewind, O., & Missiakas, D. (2011) · Trends in Microbiology · doi:10.1016/j.tim.2011.01.007 · Cited by 310
Brackman, G., Breyne, K., De Rycke, R., Vermote, A., Van Nieuwerburgh, F., Meyer, E., Van Calenbergh, S., & Coenye, T. (2016) · Scientific Reports · doi:10.1038/srep20321 · Cited by 174
Metal ion acquisition in Staphylococcus aureus: overcoming nutritional immunity
Cassat, J. E., & Skaar, E. P. (2012) · Seminars in Immunopathology · doi:10.1007/s00281-011-0294-4 · Cited by 155
“Further experiments revealed that inactivation of HrtA leads to membrane damage which triggers increased expression and secretion of immunomodulatory factors [132].”
BackgroundSelf-citation
Metadata
- Authors
- Attia, A. S., Benson, M. A., Stauff, D. L., Torres, V. J., & Skaar, E. P.
- Affiliations
- Cairo University (EG)
- New York University (US)
- Vanderbilt University Medical Center (US)
- Corresponding author
- Skaar, Eric P.
- Venue
- PLoS Pathogens
- Publisher
- Public Library of Science (PLoS)
- Published
- 2010-03-12
- Volume
- 6
- Issue
- 3
- Pages
- e1000802
- ISSN
- 1553-7366 (ISSN-L)
- 1553-7374
- PMC
- PMC2837406
- OpenAlex
- W1974193789
- Cited by
- 44
- References
- 62
- Citations by year
- 2026: 1 · 2025: 1 · 2024: 1 · 2023: 2 · 2021: 5 · 2020: 2 · 2019: 2 · 2018: 3 · 2017: 3 · 2016: 2 · 2015: 4 · 2014: 2 · 2013: 4 · 2012: 3
- FWCI
- 3.31
- Type
- journal article
- Language
- en
- Open access
- gold
- doi.org
- Locations
- PLoS Pathogens (publishedVersion, cc-by)
- PubMed Central (publishedVersion, cc-by)
- PubMed (publishedVersion)
- DOAJ (DOAJ: Directory of Open Access Journals) (submittedVersion, cc-by-sa)
- Figshare (submittedVersion, cc-by)
- Greater South Information System
- Funders
- Burroughs Wellcome Fund
- Vanderbilt University (T32 HL069765)
- Vanderbilt University Medical Center
- U.S. Public Health Service
- National Heart, Lung, and Blood Institute (T32HL069765)
- National Institute of Allergy and Infectious Diseases (AI073843, AI69233, F32AI071487, R01AI069233, AI071487, R01AI073843)
- Topics
- Health Sciences › Medicine › Infectious Diseases › Antimicrobial Resistance in Staphylococcus
- Life Sciences › Biochemistry, Genetics and Molecular Biology › Genetics › Bacterial Genetics and Biotechnology
- Life Sciences › Immunology and Microbiology › Microbiology › Escherichia coli research studies
- Keywords
- Staphylococcus aureus, immunomodulatory factors, neutrophil recruitment, membrane permeability, pore formation, channel-forming peptides, innate immune evasion, secreted proteins
- MeSH terms
- Adenosine Triphosphatases, Animals, Anti-Bacterial Agents, Cell Movement, Exotoxins, Female, Gramicidin, Hemin, Immunologic Factors, Mice, Inbred BALB C, Neutrophils, Staphylococcal Skin Infections, Staphylococcus aureus, Transcription, Genetic, Virulence, Up-Regulation, Gene Expression Regulation, Bacterial, ATP-Binding Cassette Transporters, Membrane Transport Proteins, Mice
About these checks
Registry, retraction, Cites and statistics results are computed, not judged, with one exception: a printed reference that no index lists is read once by a model before it counts as a citation error. Claims are extracted by a model and kept only when their quote appears verbatim in the text; each cited source is then checked, with a model’s help, for whether it says what the claim relies on. Those verdicts can be wrong — read the claim’s quote and the cited source before relying on one.
Statistics and arithmetic are recomputed, not judged.
Confidence bands are shown only for fields calibrated on our annotated test set. None is calibrated yet, so no band is shown.
What counts as a claim ›How we measure confidence ›How we check this ›
Are you an author, or do you see a problem with this page? Request a review
Data sources
Bibliographic data: Semantic Scholar, OpenAlex, Crossref.
Contains information from the Semantic Scholar Academic Graph Datasets, made available under the ODC Attribution License (ODC-BY 1.0).
Semantic Scholar’s data is described in: Kinney, R., et al. (2023). The Semantic Scholar Open Data Platform. arXiv:2301.10140.
