Cited by 32

The DOI matches its Crossref record; 13 of the 13 references it cites were found in a registry or an index.

A Gating Mutation in Ryanodine Receptor Type 2 Rescues Phenotypes of Alzheimer’s Disease Mouse Models by Upregulating Neuronal Autophagy

Zhang, Hua, Knight, Caitlynn, Chen, S.R. Wayne, Bezprozvanny, Ilya·2023·The Journal of Neuroscience

Abstract

It is well established that ryanodine receptors (RyanRs) are overactive in Alzheimer’s disease (AD), and it has been suggested that inhibition of RyanR is potentially beneficial for AD treatment. In the present study, we explored a potential connection between basal RyanR activity and autophagy in neurons. Autophagy plays an important role in clearing damaged organelles and long-lived protein aggregates, and autophagy dysregulation occurs in both AD patients and AD animal models. Autophagy is known to be regulated by intracellular calcium (Ca 2+) signals, and our results indicated that basal RyanR2 activity in hippocampal neurons inhibited autophagy through activation of calcineurin and the resulting inhibition of the AMPK (AMP-activated protein kinase)–ULK1 (unc-51-like autophagy-activating kinase 1) pathway. Thus, we hypothesized that increased basal RyanR2 activity in AD may lead to the inhibition of neuronal autophagy and accumulation of β-amyloid. To test this hypothesis, we took advantage of the RyanR2-E4872Q knock-in mouse model (EQ) in which basal RyanR2 activity is reduced because of shortened channel open time. We discovered that crossing EQ mice with the APPKI and APPPS1 mouse models of AD (both males and females) rescued amyloid accumulation and LTP impairment in these mice. Our results revealed that reduced basal activity of RyanR2-EQ channels disinhibited the autophagic pathway and led to increased amyloid clearance in these models. These data indicated a potential pathogenic outcome of RyanR2 overactivation in AD and also provided additional targets for therapeutic intervention in AD. Basal activity of ryanodine receptors controls neuronal autophagy and contributes to development of the AD phenotype. SIGNIFICANCE STATEMENT It is well established that neuronal autophagy is impaired in Alzheimer’s disease (AD). Our results suggest that supranormal calcium (Ca 2+) release from endoplasmic reticulum contributes to the inhibition of autophagy in AD and that reduction in basal activity of type 2 ryanodine receptors disinhibits the neuronal autophagic pathway and leads to increased amyloid clearance in AD models. Our findings directly link neuronal Ca 2+dysregulation with autophagy dysfunction in AD and point to additional targets for therapeutic intervention.

Overview

The claims and statistics of this paper haven’t been checked yet.

Run the check — free, no account needed. It reads the open-access text and checks the sources it cites.

A few free checks a day · papers already verified open instantly · results are public

Integrity signals

Registry

Crossref · 10.1523/jneurosci.1820-22.2022

Cites

13 of 13 references verified0 citation errors · 0 not checkable

Statistics

Figures

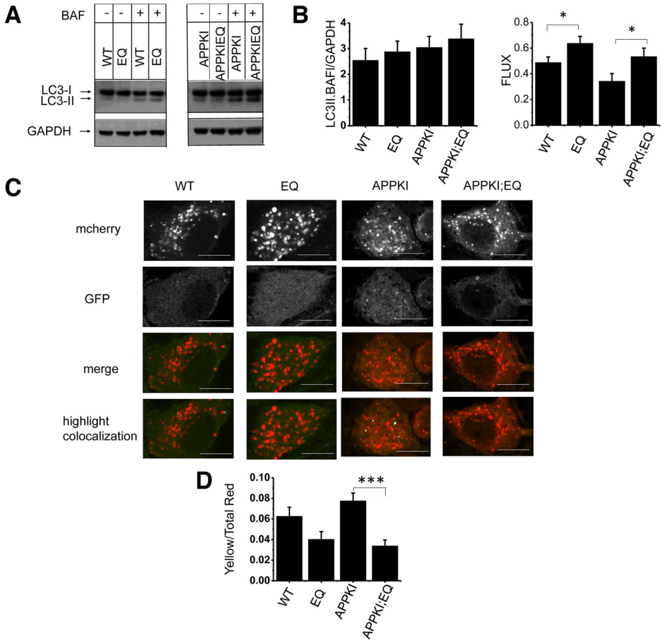
Figure 1 RyanR2-E4872Q (EQ) mutation increases autophagic flux in primary hippocampal neuronal cultures. A , Western blot staining of lysates prepared from wild-type, EQ, APPKI, and APPKI;EQ primary hippocampal neuronal culture at DIV15 with ( 1 ) or without ( -) 4 h treatment with BAF. The blots were stained with antibodies against autophagic marker LC3 and with GAPDH as loading control. LC3-I and LC3-3-II forms were detected as indicated. B , An average intensity of LC3-II staining in the presence of BAF (normalized to GAPDH intensity for each sample) is shown for wild-type, EQ, APPKI, and APPKI;EQ lysates. An average autophagic flux calculated as LC3II(BAF)-LC3II(CON)/LC3II(BAF) for each sample is shown for wild-type, EQ, APPKI, and APPKI;EQ lysates. The data are shown as the mean 6 SE ( n  11 cultures). * p , 0.05, one-way ANOVA with Tukey ' s post hoc test. C , Representative confocal images of wild-type, EQ, APPKI, and APPKI;EQ primary hippocampal neuronal cultures infected with Lenti-mCherry-GFP-LC3 viruses. The images are shown for red (mCherry) and green (GFP) channels, a merged red/green channel (merge), and a highlighted colocalization image with white color using the FUJI colocalization plugin. Scale bar, 5 m m. D , An average Y/R ratio is shown for wild-type ( N =61), EQ ( N =46), APPKI ( N =112), and APPKI;EQ ( N =84) neurons from three batches of cultures. The data are shown as the mean 6 SE. *** p , 0.001, one-way ANOVA with Tukey ' s post hoc test.
Figure 1 RyanR2-E4872Q (EQ) mutation increases autophagic flux in primary hippocampal neuronal cultures. A , Western blot staining of lysates prepared from wild-type, EQ, APPKI, and APPKI;EQ primary hippocampal neuronal culture at DIV15 with ( 1 ) or without ( -) 4 h treatment with BAF. The blots were stained with antibodies against autophagic marker LC3 and with GAPDH as loading control. LC3-I and LC3-3-II forms were detected as indicated. B , An average intensity of LC3-II staining in the presence of BAF (normalized to GAPDH intensity for each sample) is shown for wild-type, EQ, APPKI, and APPKI;EQ lysates. An average autophagic flux calculated as LC3II(BAF)-LC3II(CON)/LC3II(BAF) for each sample is shown for wild-type, EQ, APPKI, and APPKI;EQ lysates. The data are shown as the mean 6 SE ( n  11 cultures). * p , 0.05, one-way ANOVA with Tukey ' s post hoc test. C , Representative confocal images of wild-type, EQ, APPKI, and APPKI;EQ primary hippocampal neuronal cultures infected with Lenti-mCherry-GFP-LC3 viruses. The images are shown for red (mCherry) and green (GFP) channels, a merged red/green channel (merge), and a highlighted colocalization image with white color using the FUJI colocalization plugin. Scale bar, 5 m m. D , An average Y/R ratio is shown for wild-type ( N =61), EQ ( N =46), APPKI ( N =112), and APPKI;EQ ( N =84) neurons from three batches of cultures. The data are shown as the mean 6 SE. *** p , 0.001, one-way ANOVA with Tukey ' s post hoc test.CC-BY-NC-SA · From the PDF
Image 2
CC-BY-NC-SA · From the PDF
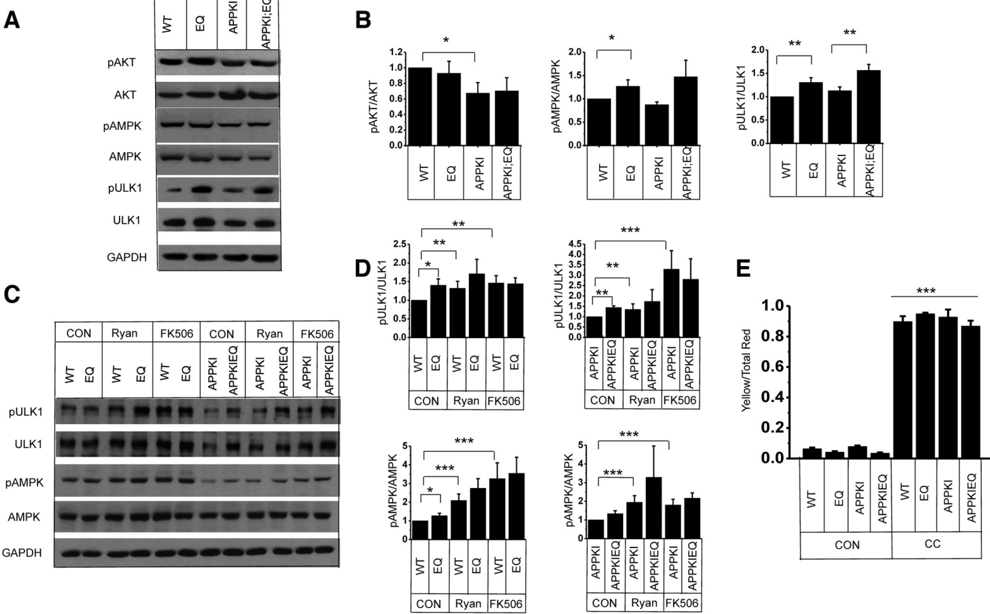
Figure 3 Basal RyanR2 activity regulates autophagy flux by modulating the CaN -pAMPK -pULK1 pathway. A , Western blot staining of lysates prepared from wild-type, EQ, APPKI, and APPKI;EQ primary hippocampal neuronal cultures at DIV15. The blots were stained with antibodies against pAKT and AKT, pAMPK, and AMPK, pULK1 (Ser555), and ULK1, and with GAPDH as a loading control. B , An average ratio of pAKT/AKT, pAMPK/AMPK, and pULK1(Ser555)/ULK1 is shown for wild-type, EQ, APPKI, and APPKI;EQ samples. The data are shown as the mean 6 SE ( n  5 cultures). * p , 0.05, ** p , 0.01, one-way ANOVA with Tukey ' s post hoc test. C , Western blot staining of lysates prepared from wild-type, EQ, APPKI, and APPKI;EQ primary hippocampal neuronal cultures at DIV15 in control conditions (CON) or after 4 h treatment with Ryan or FK506 as indicated. The blots were stained with antibodies against pAMPK and AMPK, pULK1 (Ser555), and ULK1, and with GAPDH as a loading control. D , An average ratio of pAKT/AKT and pULK1(Ser555)/ULK1 is shown for wild-type, EQ, APPKI, and APPKI;EQ samples in control conditions (CON) or after 4 h of treatment with Ryan or FK506 as indicated. The data are shown as the mean 6 SE ( n  3 cultures). * p , 0.05, ** p , 0.01, *** p , 0.001, one-way ANOVA with Tukey ' s post hoc test. E , Pharmacological inhibition of AMPK blocks autophagic flux. Average Yellow/Red ratios in wild-type, EQ, APPKI, and APPKI;EQ primary hippocampal cultures infected with Lenti-mCherry-GFP-LC3 viruses in control conditions (con) or after 4 h of treatment with compound C (comp C). The data are shown as the mean 6 SE ( n  17 neurons from four coverslips of cultures); all of the four CC groups are significantly more increased than the four control groups. *** p , 0.001, one-way ANOVA with Tukey ' s post hoc test. Note: data from control groups are from the same data as in Figure 1.
Figure 3 Basal RyanR2 activity regulates autophagy flux by modulating the CaN -pAMPK -pULK1 pathway. A , Western blot staining of lysates prepared from wild-type, EQ, APPKI, and APPKI;EQ primary hippocampal neuronal cultures at DIV15. The blots were stained with antibodies against pAKT and AKT, pAMPK, and AMPK, pULK1 (Ser555), and ULK1, and with GAPDH as a loading control. B , An average ratio of pAKT/AKT, pAMPK/AMPK, and pULK1(Ser555)/ULK1 is shown for wild-type, EQ, APPKI, and APPKI;EQ samples. The data are shown as the mean 6 SE ( n  5 cultures). * p , 0.05, ** p , 0.01, one-way ANOVA with Tukey ' s post hoc test. C , Western blot staining of lysates prepared from wild-type, EQ, APPKI, and APPKI;EQ primary hippocampal neuronal cultures at DIV15 in control conditions (CON) or after 4 h treatment with Ryan or FK506 as indicated. The blots were stained with antibodies against pAMPK and AMPK, pULK1 (Ser555), and ULK1, and with GAPDH as a loading control. D , An average ratio of pAKT/AKT and pULK1(Ser555)/ULK1 is shown for wild-type, EQ, APPKI, and APPKI;EQ samples in control conditions (CON) or after 4 h of treatment with Ryan or FK506 as indicated. The data are shown as the mean 6 SE ( n  3 cultures). * p , 0.05, ** p , 0.01, *** p , 0.001, one-way ANOVA with Tukey ' s post hoc test. E , Pharmacological inhibition of AMPK blocks autophagic flux. Average Yellow/Red ratios in wild-type, EQ, APPKI, and APPKI;EQ primary hippocampal cultures infected with Lenti-mCherry-GFP-LC3 viruses in control conditions (con) or after 4 h of treatment with compound C (comp C). The data are shown as the mean 6 SE ( n  17 neurons from four coverslips of cultures); all of the four CC groups are significantly more increased than the four control groups. *** p , 0.001, one-way ANOVA with Tukey ' s post hoc test. Note: data from control groups are from the same data as in Figure 1.CC-BY-NC-SA · From the PDF
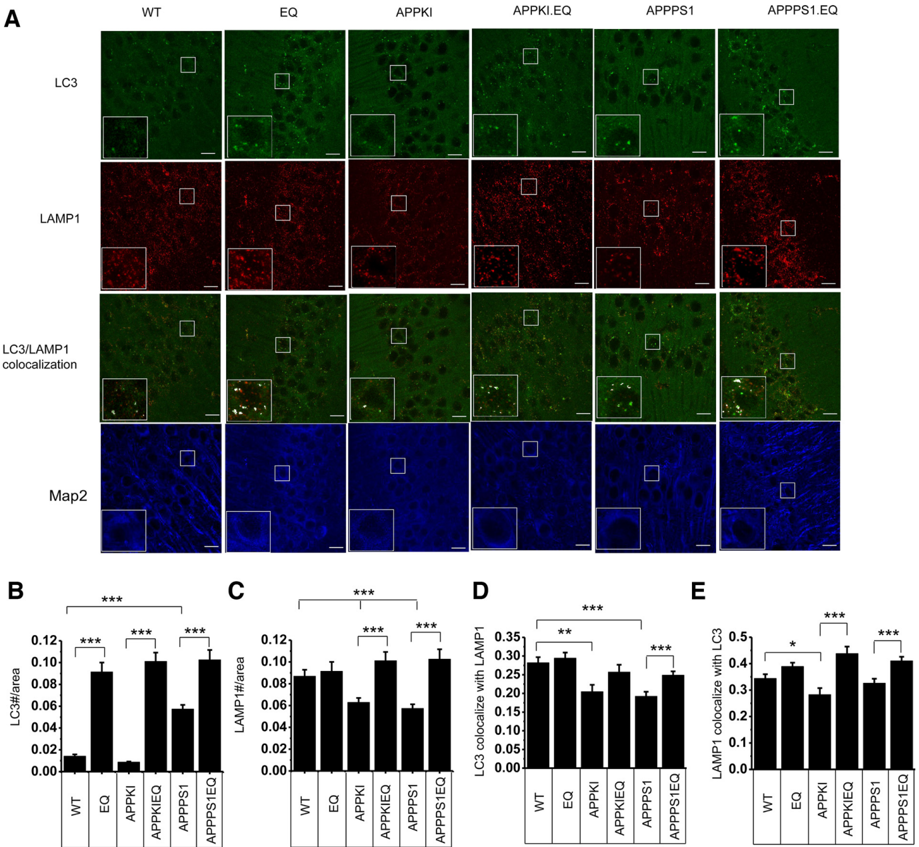
Figure 4 RyanR2-E4872Q (EQ) mutations upregulate the autophagy pathway in vivo . A , Representative confocal images of hippocampal CA1 regions from 6-month-old wild-type, EQ, APPKI, APPKI;EQ, APPPS1, and APPPS1;EQ mice stained with antibodies against autophagic marker LC3 (green), lysosomal marker LAMP1 (red) and neuronal marker MAP2 (blue). Higher magnificent images of white box area were shown in the bottom left corner; LC3 and LAMP1 colocalization images were also shown. Colocalization pixels in the box area were highlighted with white color using the FUJI colocalization plugin. Scale bar, 20 m m. B , C , The average of LC3-positive ( B ) and LAMP1-positive ( C ) puncta numbers normalized to CA1 cell body layer area is shown for each strain of mice. The data are shown as the mean 6 SE ( n  9 slices from 5 mice in each group). * p , 0.05, ** p , 0.01, *** p , 0.001, one-way ANOVA with Tukey ' s post hoc test. D , MCC of LC3 with LAMP1 puncta in hippocampal CA1 neurons. The data are shown as the mean 6 SE ( n  54 neurons from 5 mice in each group). * p , 0.05, ** p , 0.01, *** p , 0.001, one-way ANOVA with Tukey ' s post hoc test. E , MCC of LAMP1 with LC3 puncta in hippocampal CA1 neurons. The data are shown as the mean 6 SE ( n  54 neurons from 5 mice in each group). * p , 0.05, ** p , 0.01, *** p , 0.001, one-way ANOVA with Tukey ' s post hoc test.
Figure 4 RyanR2-E4872Q (EQ) mutations upregulate the autophagy pathway in vivo . A , Representative confocal images of hippocampal CA1 regions from 6-month-old wild-type, EQ, APPKI, APPKI;EQ, APPPS1, and APPPS1;EQ mice stained with antibodies against autophagic marker LC3 (green), lysosomal marker LAMP1 (red) and neuronal marker MAP2 (blue). Higher magnificent images of white box area were shown in the bottom left corner; LC3 and LAMP1 colocalization images were also shown. Colocalization pixels in the box area were highlighted with white color using the FUJI colocalization plugin. Scale bar, 20 m m. B , C , The average of LC3-positive ( B ) and LAMP1-positive ( C ) puncta numbers normalized to CA1 cell body layer area is shown for each strain of mice. The data are shown as the mean 6 SE ( n  9 slices from 5 mice in each group). * p , 0.05, ** p , 0.01, *** p , 0.001, one-way ANOVA with Tukey ' s post hoc test. D , MCC of LC3 with LAMP1 puncta in hippocampal CA1 neurons. The data are shown as the mean 6 SE ( n  54 neurons from 5 mice in each group). * p , 0.05, ** p , 0.01, *** p , 0.001, one-way ANOVA with Tukey ' s post hoc test. E , MCC of LAMP1 with LC3 puncta in hippocampal CA1 neurons. The data are shown as the mean 6 SE ( n  54 neurons from 5 mice in each group). * p , 0.05, ** p , 0.01, *** p , 0.001, one-way ANOVA with Tukey ' s post hoc test.CC-BY-NC-SA · From the PDF
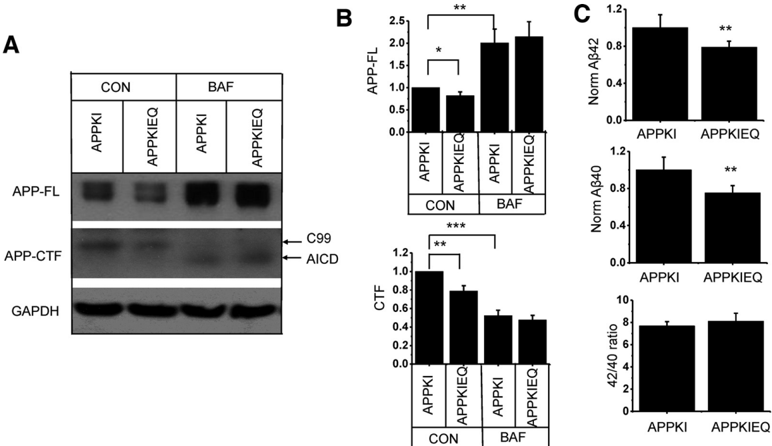
Figure 5 The RyanR2-E4872Q (EQ) mutation promotes APP degradation through the autophagic pathway. A , Western blot staining of lysates prepared from APPKI and APPKI;EQ primary hippocampal neuronal culture at DIV15 with (BAF) or without (CON) 4 h of treatment with bafolimycin 1A. The blots were stained with antibodies against APP and with GAPDH as a loading control. Full-length APP (APP-FL) and APP-CTF were detected, as indicated. B , C , An average intensity of APP-FL ( B ) and APP-CTF ( C ) staining in control conditions (CON) and in the presence of BAF (normalized to GAPDH intensity for each sample) is shown for EQ, APPKI, and APPKI;EQ sample. The data are shown as the mean 6 SE ( n  14 cultures). * p , 0.05, ** p , 0.01, *** p , 0.001, one-way ANOVA with Tukey ' s post hoc test. D , Normalized A b 40, A b 42 (to cell density loading control), and A b 42/A b 40 ratio in the culture media collected from APPKI and APPKI;EQ hippocampal neuronal cultures at DIV15. The data are shown as the mean 6 SE ( n = 6 cultures). ** p , 0.01, Student ' s t test.
Figure 5 The RyanR2-E4872Q (EQ) mutation promotes APP degradation through the autophagic pathway. A , Western blot staining of lysates prepared from APPKI and APPKI;EQ primary hippocampal neuronal culture at DIV15 with (BAF) or without (CON) 4 h of treatment with bafolimycin 1A. The blots were stained with antibodies against APP and with GAPDH as a loading control. Full-length APP (APP-FL) and APP-CTF were detected, as indicated. B , C , An average intensity of APP-FL ( B ) and APP-CTF ( C ) staining in control conditions (CON) and in the presence of BAF (normalized to GAPDH intensity for each sample) is shown for EQ, APPKI, and APPKI;EQ sample. The data are shown as the mean 6 SE ( n  14 cultures). * p , 0.05, ** p , 0.01, *** p , 0.001, one-way ANOVA with Tukey ' s post hoc test. D , Normalized A b 40, A b 42 (to cell density loading control), and A b 42/A b 40 ratio in the culture media collected from APPKI and APPKI;EQ hippocampal neuronal cultures at DIV15. The data are shown as the mean 6 SE ( n = 6 cultures). ** p , 0.01, Student ' s t test.CC-BY-NC-SA · From the PDF
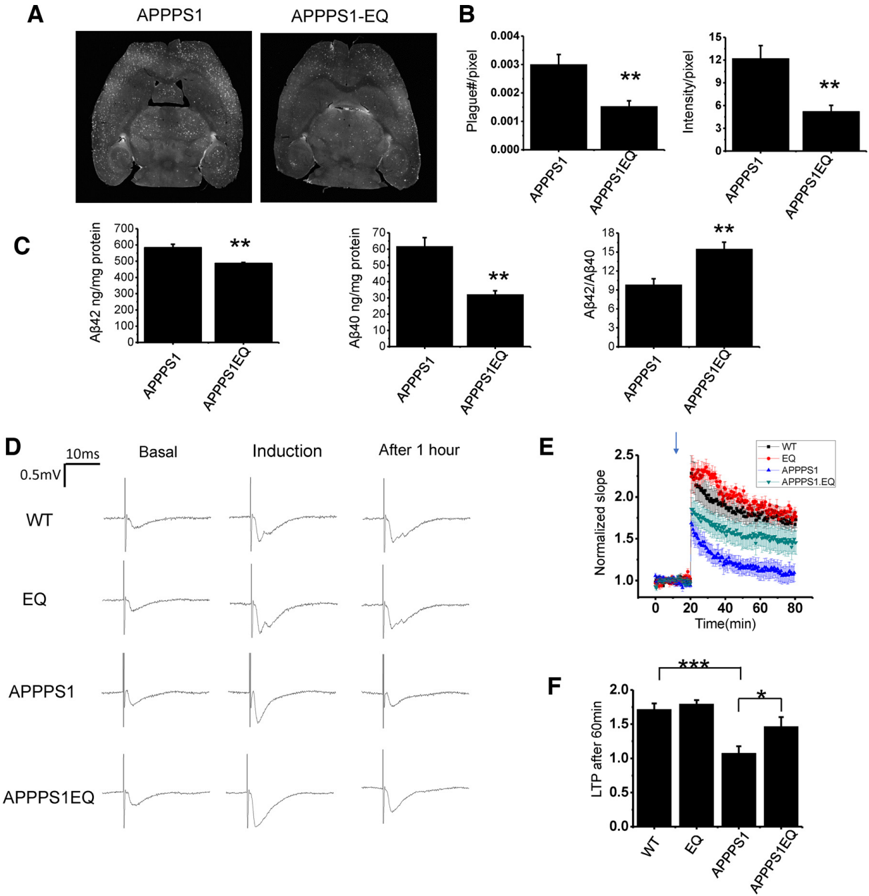
Figure 6 RyanR2-E4872Q (EQ) mutation reduces amyloid plaque accumulation and rescues the LTP defect in APPPS1 mice. A , Representative IsoCyte laser-scanning images of horizontal brain slices from 6-month-old APPPS1 and APPPS1;EQ mice stained with fluorescently labeled 6E10 anti-amyloid antibodies. B , Average density of amyloid plaques and average signal intensity within the plaques for APPPS1 and APPPS1;EQ mice samples. The data are shown as the mean 6 SE ( n  10 mice). ** p , 0.01, Student ' s t test. C , Normalized A b 40 concentration, A b 42 concentration, and A b 42/A b 40 ratio in the cortex homogenates collected from 6-month-old APPPS1 and APPPS1;EQ mice. The data are shown as the mean 6 SE ( n  5 mice). ** p , 0.01, Student ' s t test. D , Sample fEPSP traces are shown for 6-month-old WT, EQ, APPPS1, and APPPS1:EQ brain slices before stimulation (basal), immediately after tetanus stimulation (induction), and 1 h after tetanus stimulation (after 1 h). E , Normalized and averaged slope of fEPSP recorded from 6-month-old hippocampal slices from wild-type, EQ, APPPS1, and APPPS1: EQ mice. The LTP was induced by HFS shown by the arrow. F , Averaged change in normalized fEPSP slope recorded 1 h after HFS for wild-type, EQ, APPPS1, and APPPS1;EQ mice. The data are shown as the mean 6 SE ( n  8 mice). * p , 0.05, *** p , 0.001, one-way ANOVA with Tukey ' s post hoc test.
Figure 6 RyanR2-E4872Q (EQ) mutation reduces amyloid plaque accumulation and rescues the LTP defect in APPPS1 mice. A , Representative IsoCyte laser-scanning images of horizontal brain slices from 6-month-old APPPS1 and APPPS1;EQ mice stained with fluorescently labeled 6E10 anti-amyloid antibodies. B , Average density of amyloid plaques and average signal intensity within the plaques for APPPS1 and APPPS1;EQ mice samples. The data are shown as the mean 6 SE ( n  10 mice). ** p , 0.01, Student ' s t test. C , Normalized A b 40 concentration, A b 42 concentration, and A b 42/A b 40 ratio in the cortex homogenates collected from 6-month-old APPPS1 and APPPS1;EQ mice. The data are shown as the mean 6 SE ( n  5 mice). ** p , 0.01, Student ' s t test. D , Sample fEPSP traces are shown for 6-month-old WT, EQ, APPPS1, and APPPS1:EQ brain slices before stimulation (basal), immediately after tetanus stimulation (induction), and 1 h after tetanus stimulation (after 1 h). E , Normalized and averaged slope of fEPSP recorded from 6-month-old hippocampal slices from wild-type, EQ, APPPS1, and APPPS1: EQ mice. The LTP was induced by HFS shown by the arrow. F , Averaged change in normalized fEPSP slope recorded 1 h after HFS for wild-type, EQ, APPPS1, and APPPS1;EQ mice. The data are shown as the mean 6 SE ( n  8 mice). * p , 0.05, *** p , 0.001, one-way ANOVA with Tukey ' s post hoc test.CC-BY-NC-SA · From the PDF
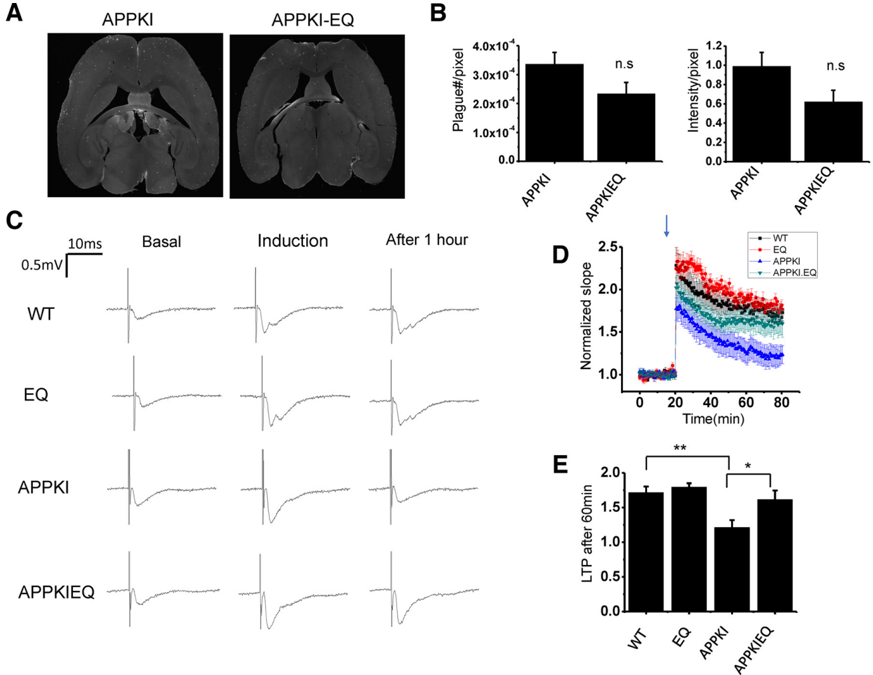
Figure 7 RyanR2-E4872Q (EQ) mutation rescues LTP defect in APPKI mice. A , Representative IsoCyte laser-scanning images of horizontal brain slices from 13-month-old APPKI and APPKI;EQ mice stained with fluorescently labeled 6E10 antiamyloid antibodies. B , Average density of amyloid plaques and average signal intensity within the plaques for APPKI and APPKI;EQ mouse samples. The data are shown as the mean 6 SE ( n  6 mice). n.s., Nonsignificant, Student ' s t test. C , Sample fEPSP traces are shown for 6-month-old WT, EQ, APPKI, and APPKI:EQ brain slices before stimulation (basal), immediately after tetanus stimulation (induction), and 1 h after tetanus stimulation (after 1 h). D , Normalized and averaged slope of fEPSP recorded from 6-monthold hippocampal slices from wild-type, EQ, APPKI, and APPKI;EQ mice. The LTP was induced by HFS, as shown by the arrow. E , Averaged change in normalized fEPSP slope recorded 1 h after HFS for wild-type, EQ, APPKI, and APPKI;EQ mice. The data are shown as the mean 6 SE ( n  8 mice). * p , 0.05, ** p , 0.01, one-way ANOVA with Tukey ' s post hoc test. Note: WT and EQ data were the same as in Figure 6.
Figure 7 RyanR2-E4872Q (EQ) mutation rescues LTP defect in APPKI mice. A , Representative IsoCyte laser-scanning images of horizontal brain slices from 13-month-old APPKI and APPKI;EQ mice stained with fluorescently labeled 6E10 antiamyloid antibodies. B , Average density of amyloid plaques and average signal intensity within the plaques for APPKI and APPKI;EQ mouse samples. The data are shown as the mean 6 SE ( n  6 mice). n.s., Nonsignificant, Student ' s t test. C , Sample fEPSP traces are shown for 6-month-old WT, EQ, APPKI, and APPKI:EQ brain slices before stimulation (basal), immediately after tetanus stimulation (induction), and 1 h after tetanus stimulation (after 1 h). D , Normalized and averaged slope of fEPSP recorded from 6-monthold hippocampal slices from wild-type, EQ, APPKI, and APPKI;EQ mice. The LTP was induced by HFS, as shown by the arrow. E , Averaged change in normalized fEPSP slope recorded 1 h after HFS for wild-type, EQ, APPKI, and APPKI;EQ mice. The data are shown as the mean 6 SE ( n  8 mice). * p , 0.05, ** p , 0.01, one-way ANOVA with Tukey ' s post hoc test. Note: WT and EQ data were the same as in Figure 6.CC-BY-NC-SA · From the PDF
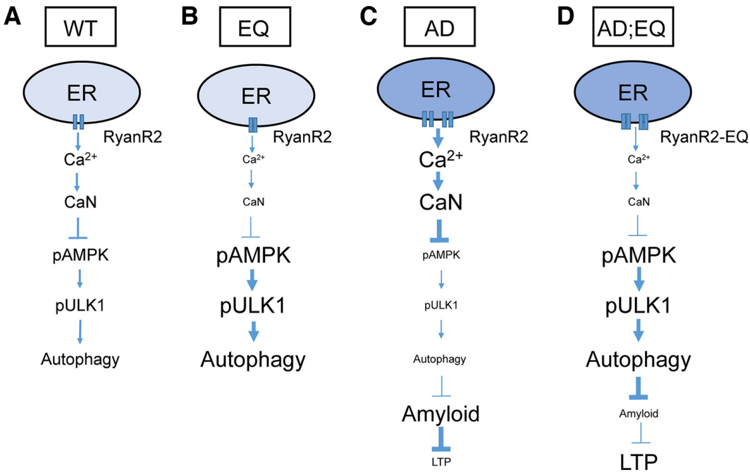
Figure 8 RyanR2-mediated basal calcium flux and control of neuronal autophagy in health and disease. A , Wild-type. Basal Ca 2 1 flux from ER via RyanR2 maintains the steady-state level of CaN activation in neuronal cytoplasm. CaN dephosphorylates and inactivates AMPK, reducing the levels of ULK1 phosphorylation (Ser555) and limiting autophagic flux. B , EQ mutant. Basal Ca 2 1 flux from ER via RyanR2 is reduced because of E4872Q gating mutation and shortened channel open times. Reduction of basal Ca 2 1 flux from the ER leads to reduced steady-state levels of CaN activity, increase in AMPK and ULK1 (Ser555) phosphorylation, and stimulation of autophagic flux. C , AD. Basal Ca 2 1 flux from ER is enhanced in early AD and aging because of overloaded ER Ca 2 1 stores and increased the levels of RyanR2 expression. Resulting enhancement of basal Ca 2 1 flux leads to overstimulation of CaN, reduced levels of AMPK and ULK1 (Ser555) phosphorylation, and reduced autophagic flux. Reduced autophagy impaired the clearance of APP and APP fragments, causing accumulation of A b oligomers and plaques and impaired synaptic plasticity (LTP). D , AD;EQ. Basal Ca 2 1 from ER is normalized in AD;EQ mutants because of reduced RyanR2 channel open times. As a result, steady-state CaN activity is also normalized, causing increased phosphorylation of AMPK and ULK1 (Ser555) and disinhibition of autophagy. Enhanced autophagy promotes the clearance of APP and APP fragments, reduces the amounts of A b oligomers and amyloid plaques, leading to the rescue of synaptic plasticity (LTP) defects.
Figure 8 RyanR2-mediated basal calcium flux and control of neuronal autophagy in health and disease. A , Wild-type. Basal Ca 2 1 flux from ER via RyanR2 maintains the steady-state level of CaN activation in neuronal cytoplasm. CaN dephosphorylates and inactivates AMPK, reducing the levels of ULK1 phosphorylation (Ser555) and limiting autophagic flux. B , EQ mutant. Basal Ca 2 1 flux from ER via RyanR2 is reduced because of E4872Q gating mutation and shortened channel open times. Reduction of basal Ca 2 1 flux from the ER leads to reduced steady-state levels of CaN activity, increase in AMPK and ULK1 (Ser555) phosphorylation, and stimulation of autophagic flux. C , AD. Basal Ca 2 1 flux from ER is enhanced in early AD and aging because of overloaded ER Ca 2 1 stores and increased the levels of RyanR2 expression. Resulting enhancement of basal Ca 2 1 flux leads to overstimulation of CaN, reduced levels of AMPK and ULK1 (Ser555) phosphorylation, and reduced autophagic flux. Reduced autophagy impaired the clearance of APP and APP fragments, causing accumulation of A b oligomers and plaques and impaired synaptic plasticity (LTP). D , AD;EQ. Basal Ca 2 1 from ER is normalized in AD;EQ mutants because of reduced RyanR2 channel open times. As a result, steady-state CaN activity is also normalized, causing increased phosphorylation of AMPK and ULK1 (Ser555) and disinhibition of autophagy. Enhanced autophagy promotes the clearance of APP and APP fragments, reduces the amounts of A b oligomers and amyloid plaques, leading to the rescue of synaptic plasticity (LTP) defects.CC-BY-NC-SA · From the PDF

Verification

Claims the paper makes

The claims and statistics of this paper haven’t been checked yet.

Run the check — free, no account needed. It reads the open-access text and checks the sources it cites.

A few free checks a day · papers already verified open instantly · results are public

Claims other papers make about this one

Each is checked against this paper’s own text: does it say what the citing paper says it does?

Self-check

Percentages, sums and reported differences re-computed from the paper’s own numbers.

The self-check needs the paper’s full text.

Citations

Cites

Research works printed but not linked: 82

  1. 10.1111/nyas.14305 · DOI
  2. 10.1016/j.lfs.2020.118020 · DOI
  3. 10.1083/jcb.201206003 · DOI
  4. 10.1016/j.tins.2008.06.005 · DOI · Paper page
  5. 10.1523/JNEUROSCI.0800-08.2008 · DOI · Paper page
  6. 10.1093/brain/awv236 · DOI · Paper page
  7. 10.1016/j.bbrc.2016.09.088 · DOI
  8. 10.1016/j.neurobiolaging.2011.03.011 · DOI
  9. 10.1038/nn.3304 · DOI · Paper page
  10. 10.1016/j.cell.2010.06.007 · DOI · Paper page
  11. 10.1093/jnen/63.8.821 · DOI
  12. 10.1523/JNEUROSCI.2047-09.2009 · DOI
  13. 10.1371/journal.pone.0052056 · DOI
  14. 10.1007/s12035-021-02487-7 · DOI
  15. 10.1038/nm.3440 · DOI
  16. 10.3389/fncel.2016.00116 · DOI
  17. 10.1152/jn.1993.69.4.1150 · DOI
  18. 10.1038/nn.2709 · DOI · Paper page
  19. 10.1016/j.ceca.2011.04.001 · DOI
  20. 10.4161/auto.7.12.17909 · DOI · Paper page
  21. 10.1002/jnr.22445 · DOI
  22. 10.1126/science.1196371 · DOI · Paper page
  23. 10.3389/fncel.2018.00435 · DOI
  24. 10.1080/15548627.2019.1596489 · DOI
  25. 10.4103/1673-5374.262584 · DOI
  26. 10.1523/JNEUROSCI.14-08-04794.1994 · DOI
  27. 10.1083/jcb.128.5.893 · DOI
  28. 10.1074/jbc.270.11.6186 · DOI
  29. 10.1038/cddis.2013.533 · DOI
  30. 10.1016/S0306-4522(99)00042-1 · DOI · Paper page
  31. 10.1074/jbc.M110.114207 · DOI
  32. 10.1016/j.neurobiolaging.2015.09.007 · DOI
  33. 10.1111/cns.13216 · DOI
  34. 10.1007/s00401-017-1733-7 · DOI · Paper page
  35. 10.1091/mbc.E07-08-0823 · DOI
  36. 10.1038/s41598-019-56675-6 · DOI
  37. 10.1016/j.cell.2010.05.008 · DOI · Paper page
  38. 10.1016/j.celrep.2015.07.050 · DOI · Paper page
  39. 10.3389/fnmol.2019.00203 · DOI
  40. 10.4161/chan.27471 · DOI
  41. 10.1002/jnr.24936 · DOI
  42. 10.18632/aging.103305 · DOI
  43. 10.1097/FJC.0000000000000134 · DOI
  44. 10.3390/cells9020311 · DOI
  45. 10.3390/cells9122655 · DOI · Paper page
  46. 10.1038/ncb3114 · DOI
  47. 10.1038/s41598-021-86822-x · DOI
  48. 10.1093/jnen/64.2.113 · DOI · Paper page
  49. 10.1523/JNEUROSCI.0875-12.2012 · DOI
  50. 10.1016/j.neulet.2012.04.008 · DOI
  51. 10.2217/nmt.15.36 · DOI
  52. 10.1097/ALN.0000000000001730 · DOI
  53. 10.3390/biomedicines9010005 · DOI
  54. 10.1016/j.nbd.2010.11.014 · DOI · Paper page
  55. 10.4161/auto.5.5.8823 · DOI · Paper page
  56. 10.1007/s00401-011-0896-x · DOI · Paper page
  57. 10.1126/science.1174447 · DOI · Paper page
  58. 10.1529/biophysj.108.128728 · DOI
  59. 10.1038/emboj.2012.32 · DOI · Paper page
  60. 10.1111/j.1471-4159.2005.03332.x · DOI
  61. Stallings, 2018, Pin1 mediates Aβ42-induced dendritic spine loss, Sci Signal, 11, aap8734, 10.1126/scisignal.aap8734 · DOI
  62. 10.1073/pnas.0804672105 · DOI
  63. 10.1523/JNEUROSCI.0739-06.2006 · DOI
  64. 10.1186/s13195-020-00649-8 · DOI · Paper page
  65. 10.3390/cells10082125 · DOI
  66. 10.1016/j.neulet.2021.136011 · DOI
  67. 10.1074/jbc.M606736200 · DOI
  68. 10.1016/j.bbr.2008.12.034 · DOI
  69. 10.3233/JAD-150065 · DOI
  70. 10.1007/s00401-020-02234-7 · DOI · Paper page
  71. 10.1016/j.bbadis.2018.08.042 · DOI
  72. 10.3389/fncel.2018.00089 · DOI
  73. 10.1016/j.bcp.2017.03.011 · DOI
  74. 10.1016/j.nbd.2006.09.019 · DOI
  75. 10.1523/JNEUROSCI.4456-09.2010 · DOI · Paper page
  76. 10.1093/brain/awq341 · DOI · Paper page
  77. 10.1016/j.celrep.2020.108169 · DOI
  78. 10.1093/hmg/ddv056 · DOI · Paper page
  79. 10.1083/jcb.200505082 · DOI · Paper page
  80. 10.1523/JNEUROSCI.1554-10.2010 · DOI
  81. 10.1523/JNEUROSCI.1188-16.2016 · DOI
  82. 10.1016/j.arr.2021.101464 · DOI

Cited by

Sorted by citations

See all 32

Metadata

Authors
Zhang, H., Knight, C., Chen, S. R. W., & Bezprozvanny, I.
Venue
The Journal of Neuroscience
Published
2023-01-10
Volume
43
Issue
8
Pages
1441-1454
ISSN
  • 0270-6474
  • 1529-2401
Cited by
32
References
13
Language
en
Funders
  • National Institute of Aging (R56AG071310, R01AG055577)
  • Canadian Institutes of Health Research (PJT-152914)

About these checks

Registry, retraction, Cites and statistics results are computed, not judged, with one exception: a printed reference that no index lists is read once by a model before it counts as a citation error. Claims are extracted by a model and kept only when their quote appears verbatim in the text; each cited source is then checked, with a model’s help, for whether it says what the claim relies on. Those verdicts can be wrong — read the claim’s quote and the cited source before relying on one.

Statistics and arithmetic are recomputed, not judged.

Confidence bands are shown only for fields calibrated on our annotated test set. None is calibrated yet, so no band is shown.

What counts as a claim ›How we measure confidence ›How we check this ›

Are you an author, or do you see a problem with this page? Request a review