

The DOI matches its Crossref record; 68 of the 68 references it cites were found in a registry or an index.
Neural Correlates of Expected Risks and Returns in Risky Choice across Development
Open accessAbstract
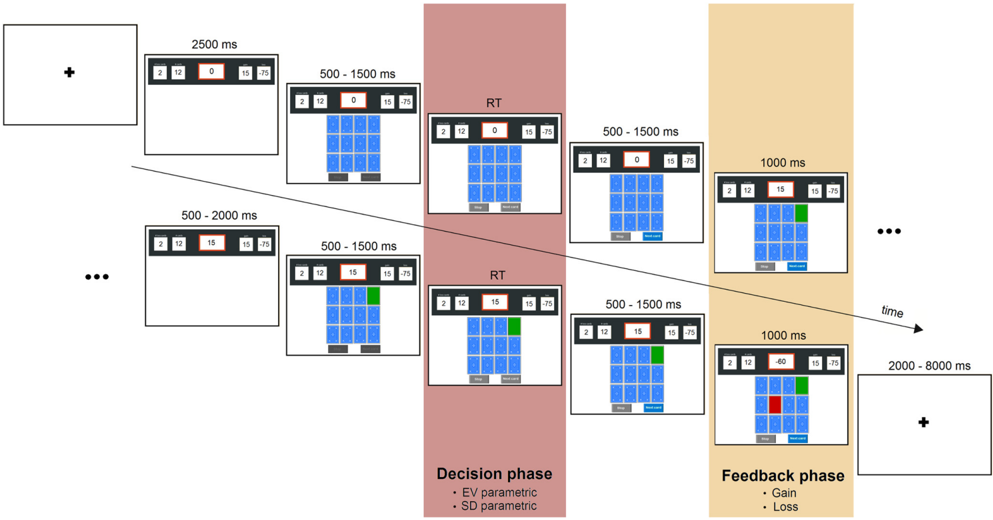
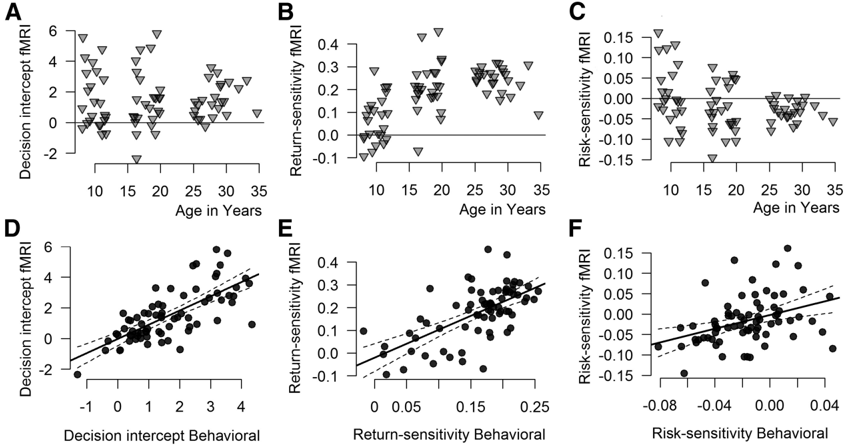
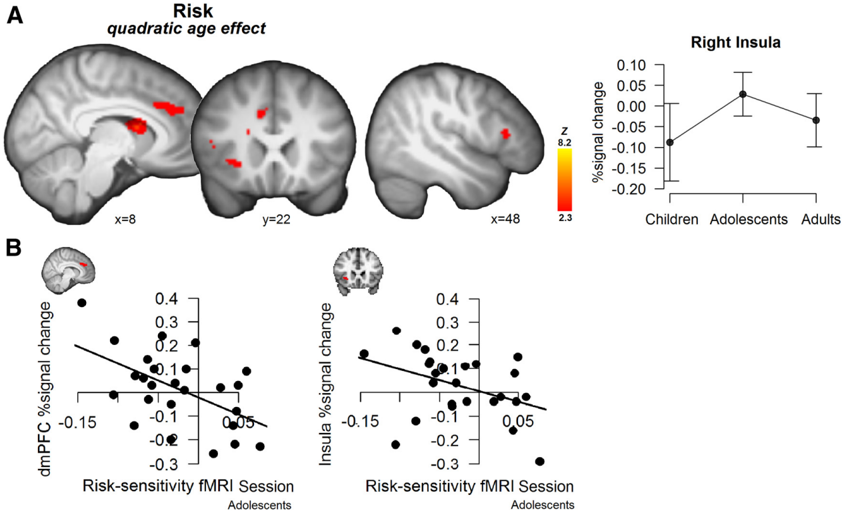
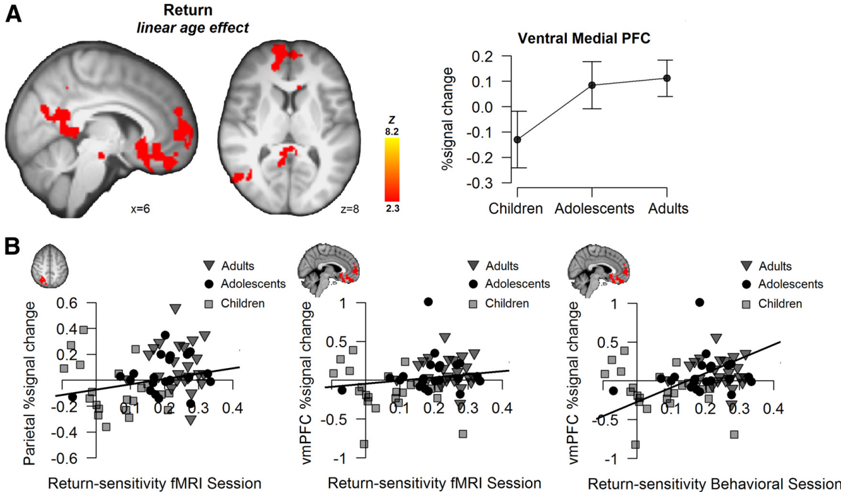
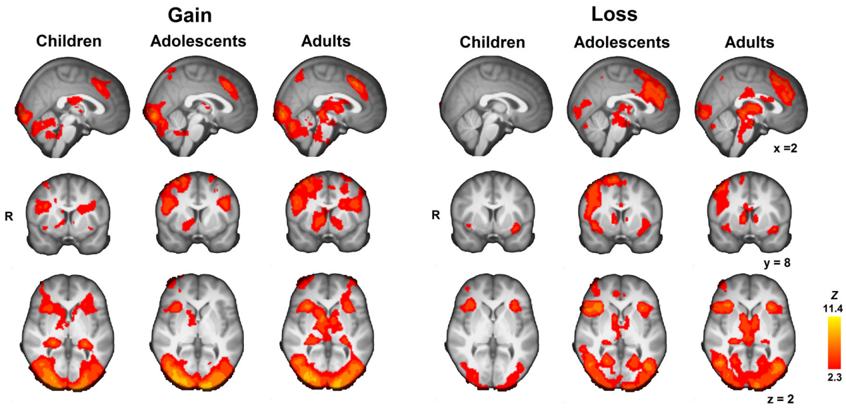
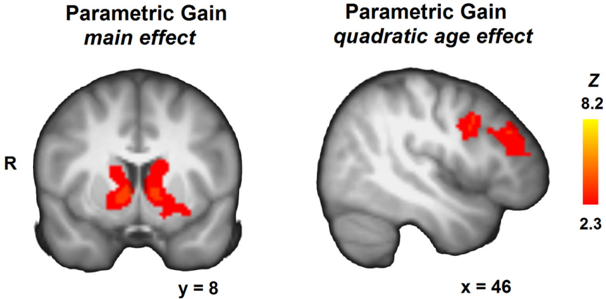
Adolescence is often described as a period of increased risk taking relative to both childhood and adulthood. This inflection in risky choice behavior has been attributed to a neurobiological imbalance between earlier developing motivational systems and later developing top-down control regions. Yet few studies have decomposed risky choice to investigate the underlying mechanisms or tracked their differential developmental trajectory. The current study uses a risk–return decomposition to more precisely assess the development of processes underlying risky choice and to link them more directly to specific neural mechanisms. This decomposition specifies the influence of changing risks (outcome variability) and changing returns (expected value) on the choices of children, adolescents, and adults in a dynamic risky choice task, the Columbia Card Task. Behaviorally, risk aversion increased across age groups, with adults uniformly risk averse and adolescents showing substantial individual differences in risk sensitivity, ranging from risk seeking to risk averse. Neurally, we observed an adolescent peak in risk-related activation in the anterior insula and dorsal medial PFC. Return sensitivity, on the other hand, increased monotonically across age groups and was associated with increased activation in the ventral medial PFC and posterior cingulate cortex with age. Our results implicate adolescence as a developmental phase of increased neural risk sensitivity. Importantly, this work shows that using a behaviorally validated decision-making framework allows a precise operationalization of key constructs underlying risky choice that inform the interpretation of results.
Overview
The claims and statistics of this paper haven’t been checked yet.
Run the check — free, no account needed. It reads the open-access text and checks the sources it cites.
Integrity signals
Registry
Cites
Statistics
Figures
Verification
Claims the paper makes
The claims and statistics of this paper haven’t been checked yet.
Run the check — free, no account needed. It reads the open-access text and checks the sources it cites.
Claims other papers make about this one
Each is checked against this paper’s own text: does it say what the citing paper says it does?
In the citing paper
“specific cognitive capacities co-evolve with complex network effects within and between different RSNs, throughout postnatal development”
From Development of large-scale functional networks from birth to adulthood: A guide to the neuroimaging literature (2017) · cites this paper as van Duijvenvoorde et al., 2015
Self-check
Percentages, sums and reported differences re-computed from the paper’s own numbers.
The self-check needs the paper’s full text.
Citations
Cites
Prospect Theory: An Analysis of Decision under Risk
Kahneman, D., & Tversky, A. (1979) · Econometrica · doi:10.2307/1914185 · Cited by 48,524
Prospect theory: An analysis of decision under risk
Kahneman, D. J., & Tversky, A. (1988) · Cambridge University Press eBooks · doi:10.1017/cbo9780511609220.014 · Cited by 32,720
An Integrative Theory of Prefrontal Cortex Function
Miller, E. K., & Cohen, J. D. (2001) · Annual Review of Neuroscience · doi:10.1146/annurev.neuro.24.1.167 · Cited by 12,803
Jenkinson, M., Bannister, P., Brady, M., & Smith, S. (2002) · NeuroImage · doi:10.1006/nimg.2002.1132 · Cited by 11,888
Fast robust automated brain extraction
Smith, S. M. (2002) · Human Brain Mapping · doi:10.1002/hbm.10062 · Cited by 10,496
Random effects structure for confirmatory hypothesis testing: Keep it maximal
Barr, D. J., Levy, R., Scheepers, C., & Tily, H. J. (2013) · Journal of Memory and Language · doi:10.1016/j.jml.2012.11.001 · Cited by 10,328
Mixed-effects modeling with crossed random effects for subjects and items
Baayen, R. H., Davidson, D. J., & Bates, D. M. (2008) · Journal of Memory and Language · doi:10.1016/j.jml.2007.12.005 · Cited by 8,540
A global optimisation method for robust affine registration of brain images
Jenkinson, M., & Smith, S. M. (2001) · Medical Image Analysis · doi:10.1016/s1361-8415(01)00036-6 · Cited by 7,018
Dynamic mapping of human cortical development during childhood through early adulthood
Gogtay, N., Giedd, J. N., Lusk, L., Hayashi, K. M., Greenstein, D., Vaituzis, A. C., Nugent, T. F., Herman, D. H., Clasen, L. S., Toga, A. W., et al. (2004) · Proceedings of the National Academy of Sciences · doi:10.1073/pnas.0402680101 · Cited by 5,604 · cited 2×
“…there are ongoing increases in myelination and a gradual decrease in synaptic density (Huttenlocher, 1990; Huttenlocher and Dabholkar, 1997; Gogtay et al., 2004; Tamnes et al., 2010), with prefrontal regions—implicated in top-down control processes—developing later than subcortical regions…”
BackgroundWechsler Abbreviated Scale of Intelligence
Dumont, R., Willis, J. O., Veizel, K., & Zibulsky, J. (2014) · Wiley eBooks · doi:10.1002/9781118660584.ese2519 · Cited by 5,546
Research works printed but not linked: 2
- 10.1037//0033-2909.125.3.367 · DOI · Paper page
- 10.1016/S1053-8119(02)91132-8 · DOI · Paper page
Cited by
Sorted by citations
The dual systems model: Review, reappraisal, and reaffirmation
Shulman, E. P., Smith, A. R., Silva, K., Icenogle, G., Duell, N., Chein, J., & Steinberg, L. (2016) · Developmental Cognitive Neuroscience · doi:10.1016/j.dcn.2015.12.010 · Cited by 867
“Recent connectivity analyses have demonstrated that increases in control behaviors across adolescence are associated with an increase in connectivity between striatal and prefrontal regions (van den Bos et al., 2015; van Duijvenvoorde et al., 2015a; Vink et al., 2014).”
Braams, B. R., van Duijvenvoorde, A. C. K., Peper, J. S., & Crone, E. A. (2015) · The Journal of Neuroscience · doi:10.1523/jneurosci.4764-14.2015 · Cited by 617
Grayson, D. S., & Fair, D. A. (2017) · NeuroImage · doi:10.1016/j.neuroimage.2017.01.079 · Cited by 411
Neural Perspectives on Cognitive Control Development during Childhood and Adolescence
Crone, E. A., & Steinbeis, N. (2017) · Trends in Cognitive Sciences · doi:10.1016/j.tics.2017.01.003 · Cited by 287
van Duijvenvoorde, A. C. K., Peters, S., Braams, B. R., & Crone, E. A. (2016) · Neuroscience & Biobehavioral Reviews · doi:10.1016/j.neubiorev.2016.06.037 · Cited by 261
Metadata
- Authors
- van Duijvenvoorde, A. C. K., Huizenga, H. M., Somerville, L. H., Delgado, M. R., Powers, A., Weeda, W. D., Casey, B. J., Weber, E. U., & Figner, B.
- Affiliations
- University of Amsterdam (NL)
- Harvard University (US)
- Rutgers, The State University of New Jersey (US)
- Cornell University (US)
- Vrije Universiteit Amsterdam (NL)
- Columbia University (US)
- Radboud University Nijmegen (NL)
- ORCID
- Venue
- The Journal of Neuroscience
- Publisher
- Society for Neuroscience
- Published
- 2015-01-28
- Volume
- 35
- Issue
- 4
- Pages
- 1549-1560
- ISSN
- 0270-6474 (ISSN-L)
- 1529-2401
- PMC
- PMC6795265
- OpenAlex
- W2086045708
- Cited by
- 141
- References
- 68
- Citations by year
- 2026: 6 · 2025: 11 · 2024: 12 · 2023: 9 · 2022: 10 · 2021: 13 · 2020: 11 · 2019: 18 · 2018: 17 · 2017: 10 · 2016: 11 · 2015: 12
- FWCI
- 10.02
- Type
- journal article
- Language
- en
- Open access
- hybrid
- doi.org
- Licence
- Locations
- Journal of Neuroscience (publishedVersion, cc-by-nc-sa)
- PubMed Central (publishedVersion)
- PubMed (publishedVersion)
- VU Research Portal (publishedVersion)
- Radboud Repository (Radboud University) (submittedVersion)
- Leiden Repository (Leiden University) (submittedVersion)
- UvA-DARE (University of Amsterdam) (submittedVersion, other-oa)
- Radboud Repository (Radboud University) (submittedVersion, other-oa)
- Data Archiving and Networked Services (DANS) (submittedVersion)
- Data Archiving and Networked Services (DANS) (submittedVersion, other-oa)
- Funders
- National Science Foundation (0922743)
- Schweizerischer Nationalfonds zur Förderung der Wissenschaftlichen Forschung (15327)
- Topics
- Life Sciences › Neuroscience › Cognitive Neuroscience › Neural and Behavioral Psychology Studies
- Social Sciences › Decision Sciences › General Decision Sciences › Decision-Making and Behavioral Economics
- Life Sciences › Neuroscience › Cellular and Molecular Neuroscience › Neurotransmitter Receptor Influence on Behavior
- Keywords
- decision making under risk, adolescence, risk aversion, risk sensitivity, Columbia Card Task, anterior insula, dorsomedial prefrontal cortex, ventromedial prefrontal cortex, posterior cingulate cortex, developmental trajectories, individual differences
- MeSH terms
- Adolescent, Adult, Aging, Brain, Brain Mapping, Child, Choice Behavior, Female, Games, Experimental, Humans, Image Processing, Computer-Assisted, Magnetic Resonance Imaging, Male, Motivation, Oxygen, Risk-Taking, Young Adult
About these checks
Registry, retraction, Cites and statistics results are computed, not judged, with one exception: a printed reference that no index lists is read once by a model before it counts as a citation error. Claims are extracted by a model and kept only when their quote appears verbatim in the text; each cited source is then checked, with a model’s help, for whether it says what the claim relies on. Those verdicts can be wrong — read the claim’s quote and the cited source before relying on one.
Statistics and arithmetic are recomputed, not judged.
Confidence bands are shown only for fields calibrated on our annotated test set. None is calibrated yet, so no band is shown.
What counts as a claim ›How we measure confidence ›How we check this ›
Are you an author, or do you see a problem with this page? Request a review
