

The DOI matches its Crossref record; 68 of the 68 references it cites were found in a registry or an index.
A Mouse Model of Tuberous Sclerosis: Neuronal Loss of Tsc1 Causes Dysplastic and Ectopic Neurons, Reduced Myelination, Seizure Activity, and Limited Survival
Open accessAbstract
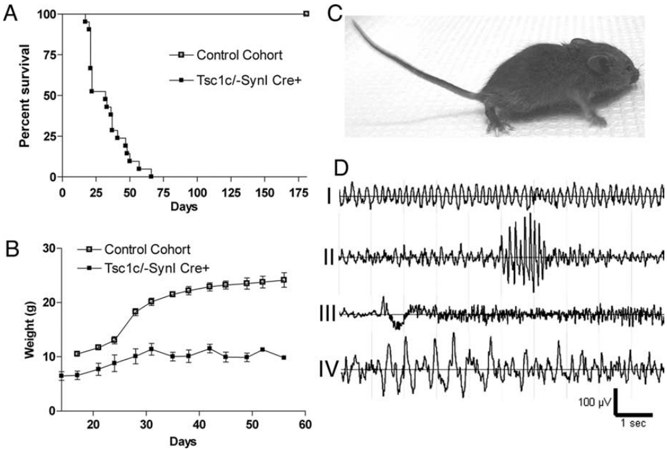
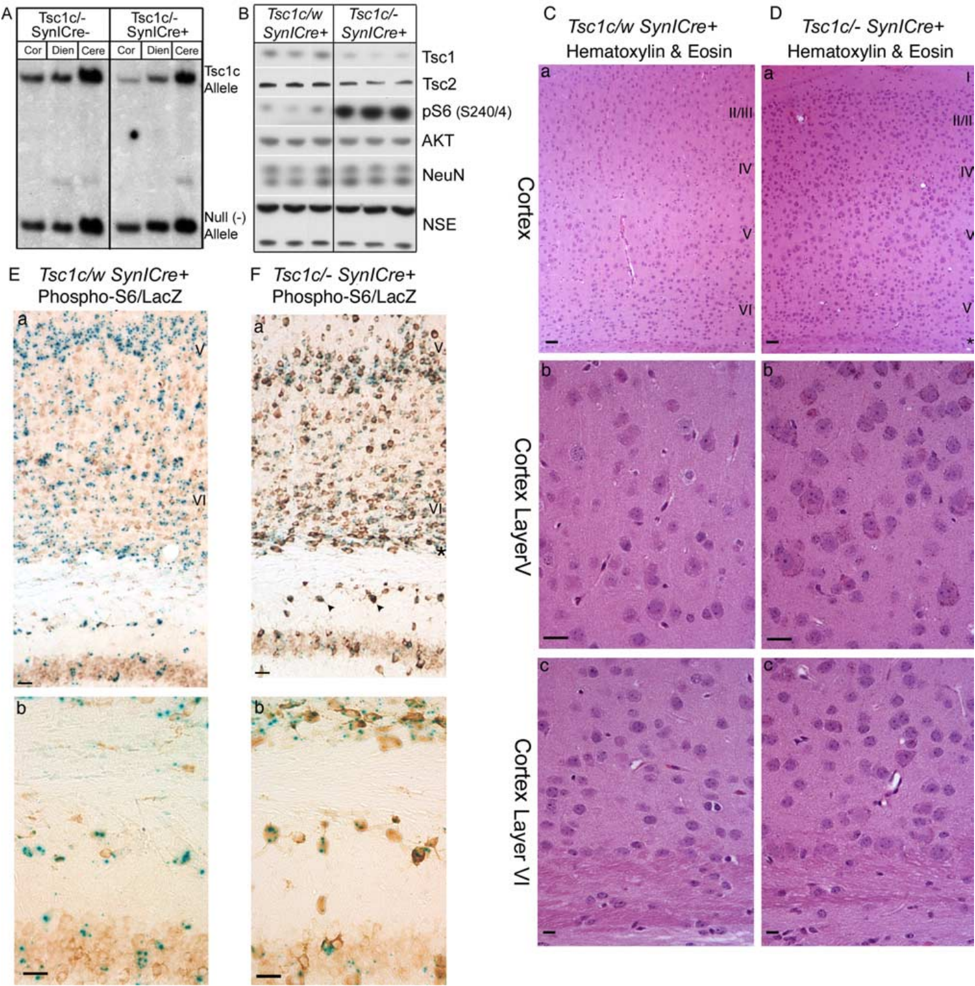
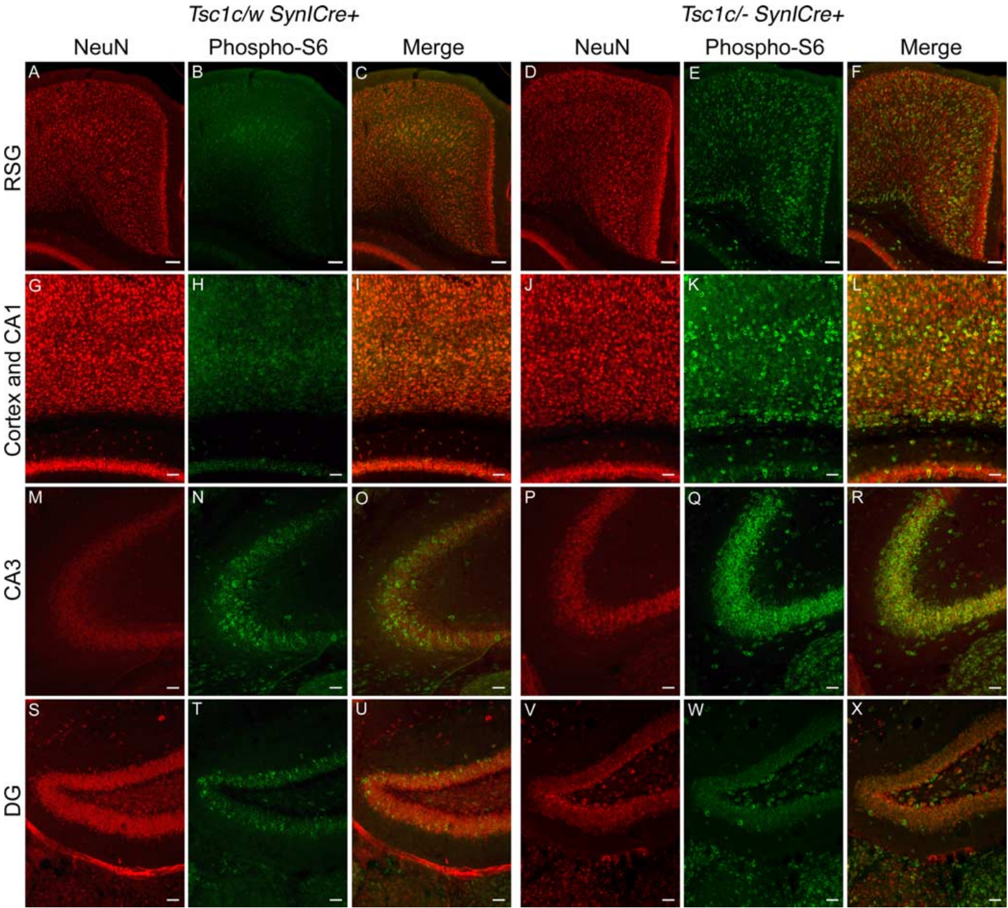
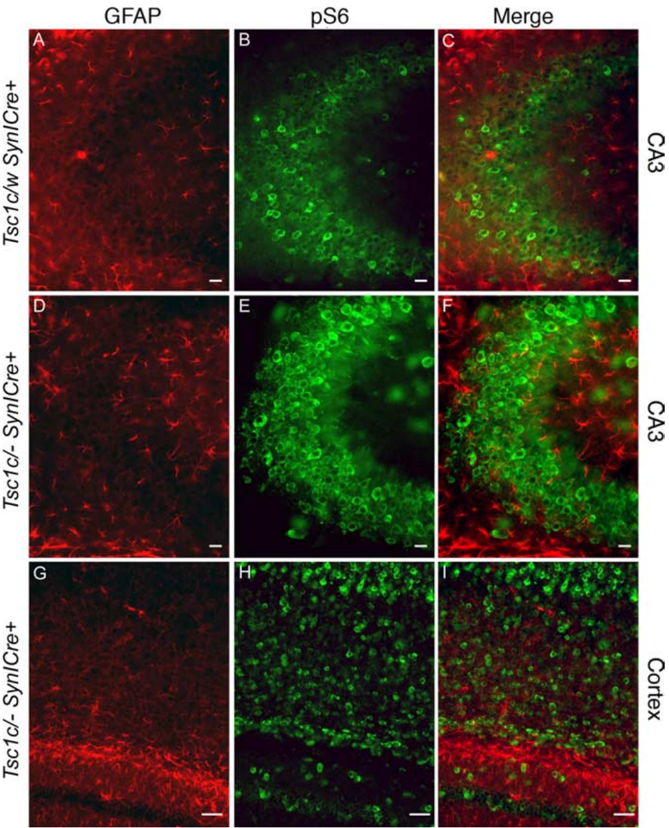
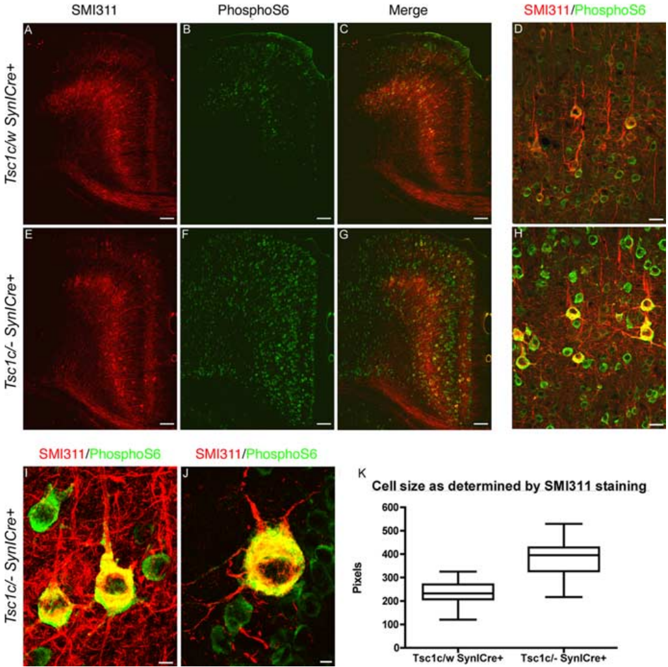
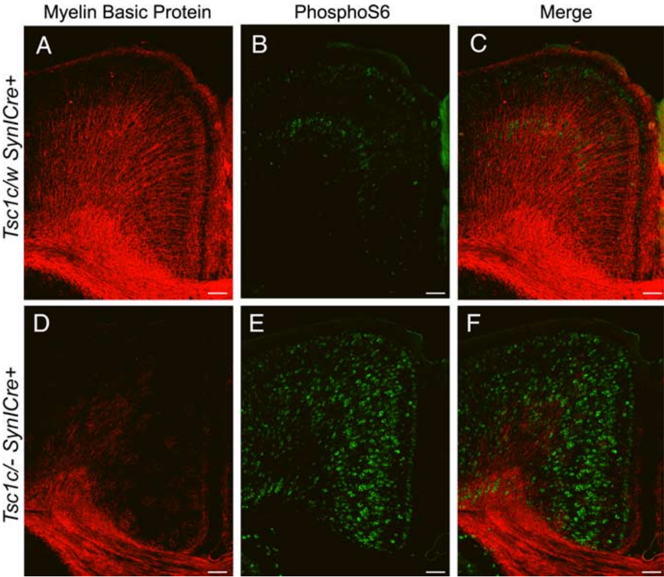
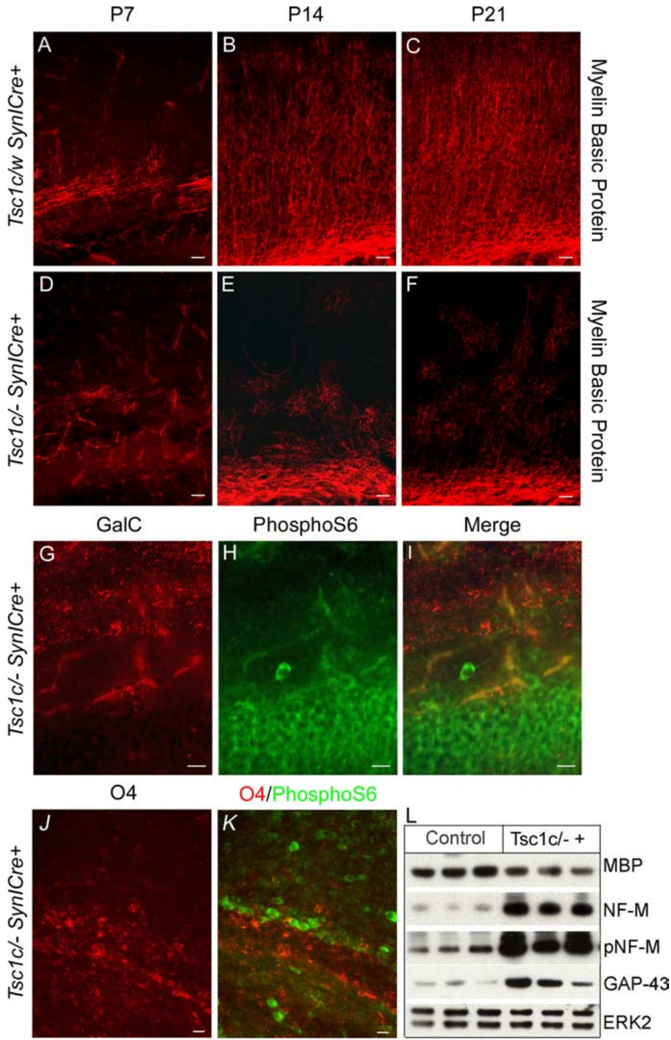
Tuberous sclerosis (TSC) is a hamartoma syndrome caused by mutations in TSC1 or TSC2 in which cerebral cortical tubers and seizures are major clinical issues. We have engineered mice in which most cortical neurons lose Tsc1 expression during embryonic development. These Tsc1 mutant mice display several neurological abnormalities beginning at postnatal day 5 with subsequent failure to thrive and median survival of 35 d. The mice also display clinical and electrographic seizures both spontaneously and with physical stimulation, and some seizures end in a fatal tonic phase. Many cortical and hippocampal neurons are enlarged and/or dysplastic in the Tsc1 mutant mice, strongly express phospho-S6, and are ectopic in multiple sites in the cortex and hippocampus. There is a striking delay in myelination in the mutant mice, which appears to be caused by an inductive neuronal defect. This new TSC brain model replicates several features of human TSC brain lesions and implicates an important function of Tsc1/Tsc2 in neuronal development.
Overview
The claims and statistics of this paper haven’t been checked yet.
Run the check — free, no account needed. It reads the open-access text and checks the sources it cites.
Integrity signals
Registry
Cites
Statistics
Figures
Verification
Claims the paper makes
The claims and statistics of this paper haven’t been checked yet.
Run the check — free, no account needed. It reads the open-access text and checks the sources it cites.
Claims other papers make about this one
Each is checked against this paper’s own text: does it say what the citing paper says it does?
The cited source says what the claim attributes to it.
In the citing paper
“In addition, whereas this work highlights astrocytes, we also observed transcriptomic changes in neurons, and considerable previous work has shown that TSC1–TSC2 loss affects neuronal development and properties11,13,35,55,56,57.”
From mTORC1 drives cell-autonomous astrocyte reactivity in tuberous sclerosis (2026) · cites this paper as [11]
The cited source says what the claim attributes to it.
In the citing paper
“Furthermore, mTOR hyperactivation accompanies epileptic activity across different seizure models including animal models of TLE, PTE, FCDII, Dravet syndrome, ASD, and TSC (Meikle et al., 2007; Zeng et al., 2008; Sha et al., 2012; Guo et al., 2013; Gheyara et al., 2014; Butler et al., 2015; Marsan and Baulac, 2018; Tai et al., 2020; Shao et al., 2022).”
From Tauopathy and Epilepsy Comorbidities and Underlying Mechanisms (2022) · cites this paper as Meikle et al., 2007
Self-check
Percentages, sums and reported differences re-computed from the paper’s own numbers.
The self-check needs the paper’s full text.
Citations
Cites
Liang, H., Liang, P., Xu, Y., Wu, J., Liang, T., & Xu, X. (2009) · Journal of Neurotrauma · doi:10.1089/neu.2008.0850 · Cited by 1,749
Growing roles for the mTOR pathway
Sarbassov, D. D., Ali, S. M., & Sabatini, D. M. (2005) · Current Opinion in Cell Biology · doi:10.1016/j.ceb.2005.09.009 · Cited by 1,590
GAP-43: an intrinsic determinant of neuronal development and plasticity
Benowitz, L. I., & Routtenberg, A. (1997) · Trends in Neurosciences · doi:10.1016/s0166-2236(96)10072-2 · Cited by 1,329
Hypothalamic mTOR Signaling Regulates Food Intake
Cota, D., Proulx, K., Smith, K. A. B., Kozma, S. C., Thomas, G., Woods, S. C., & Seeley, R. J. (2006) · Science · doi:10.1126/science.1124147 · Cited by 1,278
Holz, M. K., Ballif, B. A., Gygi, S. P., & Blenis, J. (2005) · Cell · doi:10.1016/j.cell.2005.10.024 · Cited by 1,262
Dysregulation of the TSC-mTOR pathway in human disease
Inoki, K., Corradetti, M. N., & Guan, K. (2004) · Nature Genetics · doi:10.1038/ng1494 · Cited by 980
Kwiatkowski, D. J. (2002) · Human Molecular Genetics · doi:10.1093/hmg/11.5.525 · Cited by 674
Self-citationFluoro-Jade C results in ultra high resolution and contrast labeling of degenerating neurons
Schmued, L. C., Stowers, C. C., Scallet, A. C., & Xu, L. (2005) · Brain Research · doi:10.1016/j.brainres.2004.11.054 · Cited by 633
Zhu, Y., Romero‐Ortega, M. I., Ghosh, P., Ye, Z., Charnay, P., Rushing, E. J., Marth, J. D., & Parada, L. F. (2001) · Genes & Development · doi:10.1101/gad.862101 · Cited by 606
Smalley, S. L., Tanguay, P. E., Smith, M., & Gutierrez, G. (1992) · Journal of Autism and Developmental Disorders · doi:10.1007/bf01048239 · Cited by 511
Cited by
Sorted by citations
Promoting Axon Regeneration in the Adult CNS by Modulation of the PTEN/mTOR Pathway
Park, K. K., Liu, K., Hu, Y., Smith, P. D., Wang, C., Cai, B., Xu, B., Connolly, L., Kramvis, I., Sahin, M., et al. (2008) · Science · doi:10.1126/science.1161566 · Cited by 1,686
Autistic-like behaviour and cerebellar dysfunction in Purkinje cell Tsc1 mutant mice
Tsai, P. T., Hull, C., Chu, Y., Greene-Colozzi, E., Sadowski, A. R., Leech, J. M., Steinberg, J., Crawley, J. N., Regehr, W. G., & Sahin, M. (2012) · Nature · doi:10.1038/nature11310 · Cited by 888
Postsynaptic BDNF‐TrkB signaling in synapse maturation, plasticity, and disease
Yoshii, A., & Constantine‐Paton, M. (2010) · Developmental Neurobiology · doi:10.1002/dneu.20765 · Cited by 744
Lipton, J. O., & Şahin, M. (2014) · Neuron · doi:10.1016/j.neuron.2014.09.034 · Cited by 771
Disentangling the heterogeneity of autism spectrum disorder through genetic findings
Jeste, S. S., & Geschwind, D. H. (2014) · Nature Reviews Neurology · doi:10.1038/nrneurol.2013.278 · Cited by 644
The Autistic Neuron: Troubled Translation?
Kelleher, R. J., & Bear, M. F. (2008) · Cell · doi:10.1016/j.cell.2008.10.017 · Cited by 598
Autism spectrum disorder: neuropathology and animal models
Varghese, M., Keshav, N., Jacot-Descombes, S., Warda, T., Wicinski, B., Dickstein, D. L., Harony-Nicolas, H., De Rubeis, S., Drapeau, E., Buxbaum, J. D., et al. (2017) · Acta Neuropathologica · doi:10.1007/s00401-017-1736-4 · Cited by 536
Gao, R., & Penzes, P. (2015) · Current Molecular Medicine · doi:10.2174/1566524015666150303003028 · Cited by 516
Meikle, L. M., Pollizzi, K. N., Egnor, A., Kramvis, I., Lane, H. A., Şahin, M., & Kwiatkowski, D. J. (2008) · Journal of Neuroscience · doi:10.1523/jneurosci.0955-08.2008 · Cited by 509
Self-citationZhou, J., Blundell, J., Ogawa, S., Kwon, C.-H., Zhang, W., Sinton, C., Powell, C. M., & Parada, L. F. (2009) · The Journal of Neuroscience · doi:10.1523/jneurosci.5685-08.2009 · Cited by 441
Everolimus treatment of refractory epilepsy in tuberous sclerosis complex
Krueger, D. A., Wilfong, A. A., Holland‐Bouley, K. D., Anderson, A. E., Agricola, K. D., Tudor, C., Mays, M., Lopez, C., Kim, M., & Franz, D. N. (2013) · Annals of Neurology · doi:10.1002/ana.23960 · Cited by 389
Bateup, H. S., Johnson, C. A., Denefrio, C. L., Saulnier, J. L., Kornacker, K., & Sabatini, B. L. (2013) · Neuron · doi:10.1016/j.neuron.2013.03.017 · Cited by 343
D’Gama, A. M., Woodworth, M. B., Hossain, A. A., Bizzotto, S., Hatem, N. E., LaCoursiere, C. M., Najm, I., Ying, Z., Yang, E., Barkovich, A. J., et al. (2017) · Cell Reports · doi:10.1016/j.celrep.2017.11.106 · Cited by 333
Self-citationAkt Signals through the Mammalian Target of Rapamycin Pathway to Regulate CNS Myelination
Narayanan, S. P., Flores, A. I., Wang, F., & Macklin, W. B. (2009) · Journal of Neuroscience · doi:10.1523/jneurosci.0232-09.2009 · Cited by 328
Molecular Profiling of Activated Neurons by Phosphorylated Ribosome Capture
Knight, Z. A., Tan, K., Birsoy, K., Schmidt, S. F., Garrison, J. L., Wysocki, R. W., Emiliano, A. B., Ekstrand, M. I., & Friedman, J. M. (2012) · Cell · doi:10.1016/j.cell.2012.10.039 · Cited by 312
Human cerebral organoids — a new tool for clinical neurology research
Eichmüller, O. L., & Knoblich, J. A. (2022) · Nature Reviews Neurology · doi:10.1038/s41582-022-00723-9 · Cited by 319
Tuberous sclerosis complex proteins control axon formationPreprint
Choi, Y.-J., Nardo, A. D., Kramvis, I., Meikle, L. M., Kwiatkowski, D. J., Şahin, M., & He, X. (2008) · Genes & Development · doi:10.1101/gad.1685008 · Cited by 260
Self-citationMagri, L., Cambiaghi, M., Cominelli, M., Alfaro‐Cervelló, C., Cursi, M., Pala, M., Bulfone, A., García‐Verdugo, J. M., Leocani, L., Minicucci, F., et al. (2011) · Cell stem cell · doi:10.1016/j.stem.2011.09.008 · Cited by 264
Cognitive deficits in Tsc1+/−mice in the absence of cerebral lesions and seizures
Goorden, S. M. I., van Woerden, G. M., van der Weerd, L., Cheadle, J. P., & Elgersma, Y. (2007) · Annals of Neurology · doi:10.1002/ana.21317 · Cited by 230
mTOR: A pathogenic signaling pathway in developmental brain malformations
Crino, P. B. (2011) · Trends in Molecular Medicine · doi:10.1016/j.molmed.2011.07.008 · Cited by 266
Buckmaster, P. S., & Lew, F. H. (2011) · Journal of Neuroscience · doi:10.1523/jneurosci.4852-10.2011 · Cited by 243
Meredith, R. M. (2014) · Neuroscience & Biobehavioral Reviews · doi:10.1016/j.neubiorev.2014.12.001 · Cited by 262
Zeng, L.-H., Rensing, N. R., Zhang, B., Gutmann, D. H., Gambello, M. J., & Wong, M. (2010) · Human Molecular Genetics · doi:10.1093/hmg/ddq491 · Cited by 233
Protein interactome reveals converging molecular pathways among autism disorders
Sakai, Y., Shaw, C. A., Dawson, B. C., Dugas, D. V., Al-Mohtaseb, Z., Hill, D. E., & Zoghbi, H. Y. (2011) · Science Translational Medicine · doi:10.1126/scitranslmed.3002166 · Cited by 226
Abnormal mTOR Activation in Autism
Winden, K. D., Ebrahimi‐Fakhari, D., & Şahin, M. (2018) · Annual Review of Neuroscience · doi:10.1146/annurev-neuro-080317-061747 · Cited by 232
Ribosomal Protein S6 Phosphorylation in the Nervous System: From Regulation to Function
Biever, A., Valjent, E., & Puighermanal, E. (2015) · Frontiers in Molecular Neuroscience · doi:10.3389/fnmol.2015.00075 · Cited by 227
Rapamycin for treating Tuberous sclerosis and Autism spectrum disorders
Ehninger, D., & Silva, A. J. (2010) · Trends in Molecular Medicine · doi:10.1016/j.molmed.2010.10.002 · Cited by 223
Identification of risk factors for autism spectrum disorders in tuberous sclerosis complex
Numis, A. L., Major, P., Montenegro, M. A., Muzykewicz, D. A., Pulsifer, M. B., & Thiele, E. A. (2011) · Neurology · doi:10.1212/wnl.0b013e3182104347 · Cited by 214
Loss of Tsc2 in radial glia models the brain pathology of tuberous sclerosis complex in the mouse
Way, S. W., McKenna, J., Mietzsch, U., Reith, R. M., Wu, H. C., & Gambello, M. J. (2009) · Human Molecular Genetics · doi:10.1093/hmg/ddp025 · Cited by 213
Regulation of YAP by mTOR and autophagy reveals a therapeutic target of tuberous sclerosis complex
Liang, N., Zhang, C., Dill, P., Panasyuk, G., Pion, D., Koka, V., Gallazzini, M., Olson, E. N., Lam, H., Henske, E. P., et al. (2014) · Journal of Experimental Medicine · doi:10.1084/jem.20140341 · Cited by 205
Self-citationGenetically engineered human cortical spheroid models of tuberous sclerosis
Blair, J. D., Hockemeyer, D. F., & Bateup, H. S. (2018) · Nature Medicine · doi:10.1038/s41591-018-0139-y · Cited by 205
Loss of Tsc1 In Vivo Impairs Hippocampal mGluR-LTD and Increases Excitatory Synaptic Function
Bateup, H. S., Takasaki, K. T., Saulnier, J. L., Denefrio, C. L., & Sabatini, B. L. (2011) · Journal of Neuroscience · doi:10.1523/jneurosci.1617-11.2011 · Cited by 204
Advances in behavioral genetics: mouse models of autism
Moy, S. S., & Nadler, J. J. (2007) · Molecular Psychiatry · doi:10.1038/sj.mp.4002082 · Cited by 204
Reversing Neurodevelopmental Disorders in Adults
Ehninger, D., Li, W., Fox, K., Stryker, M. P., & Silva, A. J. (2008) · Neuron · doi:10.1016/j.neuron.2008.12.007 · Cited by 196
Reith, R. M., McKenna, J., Wu, H. C., Hashmi, S. S., Cho, S., Dash, P. K., & Gambello, M. J. (2012) · Neurobiology of Disease · doi:10.1016/j.nbd.2012.10.014 · Cited by 193
PTEN signaling in autism spectrum disorders
Zhou, J., & Parada, L. F. (2012) · Current Opinion in Neurobiology · doi:10.1016/j.conb.2012.05.004 · Cited by 188
Balanced mTORC1 Activity in Oligodendrocytes Is Required for Accurate CNS Myelination
Lebrun-Julien, F., Bachmann, L. C., Norrmén, C., Trötzmüller, M., Köfeler, H. C., Rüegg, M. A., Hall, M. N., & Suter, U. (2014) · Journal of Neuroscience · doi:10.1523/jneurosci.1105-14.2014 · Cited by 199
Review: Mechanistic target of rapamycin (mTOR) pathway, focal cortical dysplasia and epilepsy
Marsan, E., & Baulac, S. (2018) · Neuropathology and Applied Neurobiology · doi:10.1111/nan.12463 · Cited by 162
LaSarge, C. L., & Danzer, S. C. (2014) · Frontiers in Molecular Neuroscience · doi:10.3389/fnmol.2014.00018 · Cited by 202
Viral vectors for therapy of neurologic diseases
Choudhury, S. R., Hudry, E., Maguire, C. A., Sena-Esteves, M., Breakefield, X. O., & Grandi, P. (2017) · Neuropharmacology · doi:10.1016/j.neuropharm.2016.02.013 · Cited by 190
Critical Role for Hypothalamic mTOR Activity in Energy Balance
Mori, H., Inoki, K., Münzberg, H., Opland, D. M., Faouzi, M., Villanueva, E. C., Ikenoue, T., Kwiatkowski, D. J., MacDougald, O. A., Myers, M. G., et al. (2009) · Cell Metabolism · doi:10.1016/j.cmet.2009.03.005 · Cited by 189
Self-citationmTOR Signaling in Epilepsy: Insights from Malformations of Cortical DevelopmentPreprint
Crino, P. B. (2015) · Cold Spring Harbor Perspectives in Medicine · doi:10.1101/cshperspect.a022442 · Cited by 188
Chronic Activation of mTOR Complex 1 Is Sufficient to Cause Hepatocellular Carcinoma in Mice
Menon, S., Yecies, J. L., Zhang, H., Howell, J. J., Nicholatos, J. W., Harputlugil, E., Bronson, R. T., Kwiatkowski, D. J., & Manning, B. D. (2012) · Science Signaling · doi:10.1126/scisignal.2002739 · Cited by 193
Self-citationPeters, J. M., Taquet, M., Vega, C., Jeste, S., Fernández, I. S., Tan, J., Nelson, C. A., Şahin, M., & Warfield, S. K. (2013) · BMC Medicine · doi:10.1186/1741-7015-11-54 · Cited by 190
Talos, D. M., Sun, H., Zhou, X., Fitzgerald, E. C., Jackson, M. C., Klein, P., Lan, V. J., Joseph, A., & Jensen, F. E. (2012) · PLoS ONE · doi:10.1371/journal.pone.0035885 · Cited by 182
Self-citationGoto, J., Talos, D. M., Klein, P., Qin, W., Chekaluk, Y. I., Anderl, S., Malinowska, I. A., Nardo, A. D., Bronson, R. T., Chan, J. A.-W., et al. (2011) · Proceedings of the National Academy of Sciences · doi:10.1073/pnas.1106454108 · Cited by 176
Self-citationProgress report on new antiepileptic drugs: A summary of the Twelfth Eilat Conference (EILAT XII)
Bialer, M., Johannessen, S. I., Levy, R. H., Perucca, E., Tomson, T., & White, H. S. (2015) · Epilepsy Research · doi:10.1016/j.eplepsyres.2015.01.001 · Cited by 174
Feliciano, D. M., Su, T. Y., López, J. M., Platel, J., & Bordey, A. (2011) · Journal of Clinical Investigation · doi:10.1172/jci44909 · Cited by 174
Translational Mouse Models of Autism: Advancing Toward Pharmacological Therapeutics
Kazdoba, T. M., Leach, P. T., Yang, M., Silverman, J. L., Solomon, M., & Crawley, J. N. (2015) · Current topics in behavioral neurosciences · doi:10.1007/7854_2015_5003 · Cited by 185
Neuronal and glia abnormalities in Tsc1-deficient forebrain and partial rescue by rapamycin
Carson, R. P., Van Nielen, D. L., Winzenburger, P. A., & Ess, K. C. (2012) · Neurobiology of Disease · doi:10.1016/j.nbd.2011.08.024 · Cited by 165
Di Nardo, A., Kramvis, I., Cho, N., Sadowski, A., Meikle, L., Kwiatkowski, D. J., & Sahin, M. (2009) · The Journal of Neuroscience · doi:10.1523/jneurosci.0778-09.2009 · Cited by 165
Self-citationmTOR pathway inhibition as a new therapeutic strategy in epilepsy and epileptogenesis
Citraro, R., Leo, A., Constanti, A., Russo, E., & Sarro, G. D. (2016) · Pharmacological Research · doi:10.1016/j.phrs.2016.03.039 · Cited by 165
Behavioral profiles of mouse models for autism spectrum disorders
Ey, E., Leblond, C. S., & Bourgeron, T. (2011) · Autism Research · doi:10.1002/aur.175 · Cited by 166
Bøttger, P., Tracz‐Gaszewska, Z., Heuck, A., Nissen, P., Romero‐Ramos, M., & Lykke‐Hartmann, K. (2010) · The Journal of Comparative Neurology · doi:10.1002/cne.22524 · Cited by 160
Differential response of skeletal muscles to mTORC1 signaling during atrophy and hypertrophy
Bentzinger, C. F., Lin, S., Romanino, K., Castets, P., Guridi, M., Summermatter, S., Handschin, C., Tintignac, L. A., Hall, M. N., & Rüegg, M. A. (2013) · Skeletal Muscle · doi:10.1186/2044-5040-3-6 · Cited by 153
Hepatic mTORC1 controls locomotor activity, body temperature, and lipid metabolism through FGF21
Cornu, M., Oppliger, W., Albert, V., Robitaille, A. M., Trapani, F., Quagliata, L., Fuhrer, T., Sauer, U., Terracciano, L., & Hall, M. N. (2014) · Proceedings of the National Academy of Sciences · doi:10.1073/pnas.1412047111 · Cited by 152
Biallelic TSC gene inactivation in tuberous sclerosis complex
Crino, P. B., Aronica, E., Baltuch, G., & Nathanson, K. L. (2010) · Neurology · doi:10.1212/wnl.0b013e3181e04325 · Cited by 153
Genetic Etiologies, Diagnosis, and Treatment of Tuberous Sclerosis Complex
Salussolia, C. L., Klonowska, K., Kwiatkowski, D. J., & Sahin, M. (2019) · Annual Review of Genomics and Human Genetics · doi:10.1146/annurev-genom-083118-015354 · Cited by 163
Self-citationBhandari, R., Paliwal, J. K., & Kuhad, A. (2020) · Advances in neurobiology · doi:10.1007/978-3-030-30402-7_4 · Cited by 167
Impaired Mitochondrial Dynamics and Mitophagy in Neuronal Models of Tuberous Sclerosis Complex
Ebrahimi-Fakhari, D., Saffari, A., Wahlster, L., Di Nardo, A., Turner, D., Lewis, T. L., Conrad, C., Rothberg, J. M., Lipton, J. O., Kölker, S., et al. (2016) · Cell Reports · doi:10.1016/j.celrep.2016.09.054 · Cited by 146
Recent advances in neurobiology of Tuberous Sclerosis Complex
Napolioni, V., Moavero, R., & Curatolo, P. (2008) · Brain and Development · doi:10.1016/j.braindev.2008.09.013 · Cited by 147
Ozkan, E. D., Creson, T. K., Kramár, E. A., Rojas, C., Seese, R. R., Babyan, A. H., Shi, Y., Lucero, R., Xu, X., Noebels, J. L., et al. (2014) · Neuron · doi:10.1016/j.neuron.2014.05.015 · Cited by 144
Talos, D. M., Kwiatkowski, D. J., Cordero, K., Black, P. M., & Jensen, F. E. (2008) · Annals of Neurology · doi:10.1002/ana.21342 · Cited by 156
Self-citationEvolving neurobiology of tuberous sclerosis complex
Crino, P. B. (2013) · Acta Neuropathologica · doi:10.1007/s00401-013-1085-x · Cited by 139
Behavioral and Neuroanatomical Phenotypes in Mouse Models of Autism
Ellegood, J., & Crawley, J. N. (2015) · Neurotherapeutics · doi:10.1007/s13311-015-0360-z · Cited by 137
Mechanistic Target of Rapamycin (mTOR) in Tuberous Sclerosis Complex-Associated Epilepsy
Curatolo, P. (2014) · Pediatric Neurology · doi:10.1016/j.pediatrneurol.2014.10.028 · Cited by 135
Huang, W.-C., Chen, Y., & Page, D. T. (2016) · Nature Communications · doi:10.1038/ncomms13421 · Cited by 130
Rheb1 Is Required for mTORC1 and Myelination in Postnatal Brain Development
Zou, J., Zhou, L., Du, X.-X., Ji, Y.-F., Xu, J., Tian, J., Jiang, W., Zou, Y., Yu, S., Gan, L., et al. (2011) · Developmental Cell · doi:10.1016/j.devcel.2010.11.020 · Cited by 127
Lozovaya, N., Gataullina, S., Tsintsadze, T. S., Tsintsadze, V., Pallesi‐Pocachard, E., Minlebaev, M., Goriounova, N. A., Buhler, E., Watrin, F., Shityakov, S., et al. (2014) · Nature Communications · doi:10.1038/ncomms5563 · Cited by 125
Role of the mTOR signaling pathway in epilepsy
Meng, X., Yu, J., Song, J., Chi, S., & Tan, L. (2013) · Journal of the Neurological Sciences · doi:10.1016/j.jns.2013.05.029 · Cited by 127
Peters, J. M., Şahin, M., Vogel‐Farley, V. K., Jeste, S., Nelson, C. A., Gregas, M. C., Prabhu, S. P., Scherrer, B., & Warfield, S. K. (2011) · Academic Radiology · doi:10.1016/j.acra.2011.08.016 · Cited by 124
Weston, M. C., Chen, H., & Swann, J. W. (2014) · Frontiers in Molecular Neuroscience · doi:10.3389/fnmol.2014.00001 · Cited by 123
Role of Oligodendrocytes and Myelin in the Pathophysiology of Autism Spectrum Disorder
Gálvez‐Contreras, A. Y., Zárate-López, D., Torres-Chávez, A. L., & González-Pérez, Ó. (2020) · Brain Sciences · doi:10.3390/brainsci10120951 · Cited by 131
GABAergic Interneuron Development and Function Is Modulated by the Tsc1 Gene
Fu, C., Cawthon, B., Clinkscales, W. B., Bruce, A., Winzenburger, P. A., & Ess, K. C. (2011) · Cerebral Cortex · doi:10.1093/cercor/bhr300 · Cited by 126
Ehninger, D., De Vries, P. J., & Silva, A. J. (2009) · Journal of Intellectual Disability Research · doi:10.1111/j.1365-2788.2009.01208.x · Cited by 120
Sunnen, C. N., Brewster, A. L., Lugo, J. N., Vanegas, F., Turcios, E., Mukhi, S., Parghi, D., D’Arcangelo, G., & Anderson, A. E. (2011) · Epilepsia · doi:10.1111/j.1528-1167.2011.03280.x · Cited by 122
Phelan–McDermid Syndrome and SHANK3: Implications for Treatment
Costales, J. L., & Kolevzon, A. (2015) · Neurotherapeutics · doi:10.1007/s13311-015-0352-z · Cited by 130
Curing epilepsy: Progress and future directions
Jacobs, M. P., Leblanc, G. G., Brooks‐Kayal, A. R., Jensen, F. E., Lowenstein, D. H., Noebels, J. L., Spencer, D. D., & Swann, J. W. (2009) · Epilepsy & Behavior · doi:10.1016/j.yebeh.2009.02.036 · Cited by 126
Self-citationWeston, M. C., Chen, H., & Swann, J. W. (2012) · Journal of Neuroscience · doi:10.1523/jneurosci.1283-12.2012 · Cited by 125
Rakhade, S. N., Klein, P., Huynh, T., Hilario‐Gomez, C., Kosaras, B., Rotenberg, A., & Jensen, F. E. (2011) · Epilepsia · doi:10.1111/j.1528-1167.2011.02992.x · Cited by 120
Self-citationCosta, V., Aigner, S., Vukcevic, M., Sauter, E. J., Behr, K., Ebeling, M., Dunkley, T. P. J., Friedlein, A., Zoffmann, S., Meyer, C. A., et al. (2016) · Cell Reports · doi:10.1016/j.celrep.2016.02.090 · Cited by 112
Sundberg, M., Tochitsky, I., Buchholz, D. E., Winden, K. D., Kujala, V. J., Kapur, K., Cataltepe, D., Turner, D., Han, M., Woolf, C. J., et al. (2018) · Molecular Psychiatry · doi:10.1038/s41380-018-0018-4 · Cited by 120
Santini, E., & Klann, E. (2014) · Science Signaling · doi:10.1126/scisignal.2005832 · Cited by 118
Fetal Brain mTOR Signaling Activation in Tuberous Sclerosis Complex
Tsai, V., Parker, W. E., Orlova, K. A., Baybis, M., Chi, A. W. S., Berg, B. D., Birnbaum, J. F., Estevez, J., Okochi, K., Sarnat, H. B., et al. (2012) · Cerebral Cortex · doi:10.1093/cercor/bhs310 · Cited by 118
Malformations of Cortical Development
Aronica, E., Becker, A. J., & Spreafico, R. (2012) · Brain Pathology · doi:10.1111/j.1750-3639.2012.00581.x · Cited by 115
STRADα deficiency results in aberrant mTORC1 signaling during corticogenesis in humans and mice
Orlova, K. A., Parker, W. E., Heuer, G. G., Tsai, V., Yoon, J. T., Baybis, M., Fenning, R. S., Strauss, K. A., & Crino, P. B. (2010) · Journal of Clinical Investigation · doi:10.1172/jci41592 · Cited by 114
Yuskaitis, C. J., Jones, B. M., Wolfson, R. L., Super, C. E., Dhamne, S. C., Rotenberg, A., Sabatini, D. M., Şahin, M., & Poduri, A. (2017) · Neurobiology of Disease · doi:10.1016/j.nbd.2017.12.010 · Cited by 116
Self-citationZhou, J., Shrikhande, G., Xu, J., McKay, R. M., Burns, D. K., Johnson, J. E. B., & Parada, L. F. (2011) · Genes & Development · doi:10.1101/gad.16750211 · Cited by 114
Drug discovery for autism spectrum disorder: challenges and opportunities
Ghosh, A., Michalon, A., Lindemann, L., Fontoura, P., & Santarelli, L. (2013) · Nature Reviews Drug Discovery · doi:10.1038/nrd4102 · Cited by 108
Ruppe, V., Dilsiz, P., Reiss, C. S., Carlson, C., Devinsky, O., Zagzag, D., Weiner, H. L., & Talos, D. M. (2014) · Epilepsia · doi:10.1111/epi.12545 · Cited by 108
Self-citationKassai, H., Sugaya, Y., Noda, S., Nakao, K., Maeda, T., Kano, M., & Aiba, A. (2014) · Cell Reports · doi:10.1016/j.celrep.2014.04.048 · Cited by 107
TSC1/TSC2 signaling in the CNS
Han, J. M., & Sahin, M. (2011) · FEBS Letters · doi:10.1016/j.febslet.2011.02.001 · Cited by 105
Chapleau, C. A., Larimore, J. L., Theibert, A. B., & Pozzo‐Miller, L. D. (2009) · Journal of Neurodevelopmental Disorders · doi:10.1007/s11689-009-9027-6 · Cited by 112
New directions in clinical imaging of cortical dysplasias
Madan, N., & Grant, P. E. (2009) · Epilepsia · doi:10.1111/j.1528-1167.2009.02292.x · Cited by 104
Depdc5 knockout rat: A novel model of mTORopathy.
Marsan, E., Ishida, S., Schramm, A. E., Weckhuysen, S., Muraca, G., Lecas, S., Liang, N., Treins, C., Pende, M., Roussel, D., et al. (2016) · Neurobiology of Disease · doi:10.1016/j.nbd.2016.02.010 · Cited by 95
Neuronal CTGF/CCN2 negatively regulates myelination in a mouse model of tuberous sclerosis complex
Ercan-Herbst, E., Han, J. M., Nardo, A. D., Winden, K. D., Han, M., Hoyo, L., Saffari, A., Leask, A., Geschwind, D. H., & Şahin, M. (2017) · The Journal of Experimental Medicine · doi:10.1084/jem.20160446 · Cited by 99
Tuberous sclerosis complex, implication from a rare genetic disease to common cancer treatment
Inoki, K., & Guan, K. (2009) · Human Molecular Genetics · doi:10.1093/hmg/ddp032 · Cited by 101
Focal malformations of cortical development: New vistas for molecular pathogenesis
Lim, K., & Crino, P. B. (2013) · Neuroscience · doi:10.1016/j.neuroscience.2013.07.037 · Cited by 98
Neural Mechanisms Underlying Repetitive Behaviors in Rodent Models of Autism Spectrum Disorders
Gandhi, T., & Lee, C. C. (2021) · Frontiers in Cellular Neuroscience · doi:10.3389/fncel.2020.592710 · Cited by 97
Metadata
- Authors
- Meikle, L., Talos, D. M., Onda, H., Pollizzi, K., Rotenberg, A., Sahin, M., Jensen, F. E., & Kwiatkowski, D. J.
- Affiliations
- Brigham and Women's Hospital (US)
- Boston Children's Hospital (US)
- Corresponding author
- Jensen, Frances E.
- Venue
- The Journal of Neuroscience
- Publisher
- Society for Neuroscience
- Published
- 2007-05-23
- Volume
- 27
- Issue
- 21
- Pages
- 5546-5558
- ISSN
- 0270-6474 (ISSN-L)
- 1529-2401
- PMC
- PMC6672762
- OpenAlex
- W2024191529
- Cited by
- 462
- References
- 68
- Citations by year
- 2026: 9 · 2025: 17 · 2024: 14 · 2023: 14 · 2022: 20 · 2021: 27 · 2020: 23 · 2019: 22 · 2018: 29 · 2017: 23 · 2016: 25 · 2015: 37 · 2014: 31 · 2013: 35 · 2012: 50
- FWCI
- 12.30
- Type
- journal article
- Language
- en
- Open access
- hybrid
- doi.org
- Licence
- Locations
- Journal of Neuroscience (publishedVersion, cc-by-nc-sa)
- PubMed Central (publishedVersion)
- PubMed (publishedVersion)
- Funders
- Tuberous Sclerosis Alliance
- National Institutes of Health (DP1OD003347, NS31718, NS24279)
- National Institute of Neurological Disorders and Stroke (NS31718, R01NS031718, R56NS031718, P01NS024279, NS 24279)
- Topics
- Health Sciences › Medicine › Genetics (clinical) › Tuberous Sclerosis Complex Research
- Life Sciences › Biochemistry, Genetics and Molecular Biology › Molecular Biology › PI3K/AKT/mTOR signaling in cancer
- Health Sciences › Medicine › Clinical Neurology › Epilepsy research and treatment
- Keywords
- tuberous sclerosis complex, TSC1, TSC2, mouse model, cortical tubers, neuronal loss, ectopic neurons, seizures, hippocampus, phospho-S6, neuronal development, survival
- MeSH terms
- Tuberous Sclerosis Complex 1 Protein, Animals, Demyelinating Diseases, Disease Models, Animal, Female, Male, Mice, Inbred CBA, Mice, Inbred C57BL, Mice, Transgenic, Neurons, Seizures, Tuberous Sclerosis, Survival Rate, Tumor Suppressor Proteins, Mice
About these checks
Registry, retraction, Cites and statistics results are computed, not judged, with one exception: a printed reference that no index lists is read once by a model before it counts as a citation error. Claims are extracted by a model and kept only when their quote appears verbatim in the text; each cited source is then checked, with a model’s help, for whether it says what the claim relies on. Those verdicts can be wrong — read the claim’s quote and the cited source before relying on one.
Statistics and arithmetic are recomputed, not judged.
Confidence bands are shown only for fields calibrated on our annotated test set. None is calibrated yet, so no band is shown.
What counts as a claim ›How we measure confidence ›How we check this ›
Are you an author, or do you see a problem with this page? Request a review
