

The DOI matches its Crossref record; 82 of the 82 references it cites were found in a registry or an index.
Long‐term expanding human airway organoids for disease modeling
Open accessPublished version of a preprint
Abstract
Abstract Organoids are self-organizing 3D structures grown from stem cells that recapitulate essential aspects of organ structure and function. Here we describe a method to establish long-term-expanding human airway organoids from broncho-alveolar biopsies or lavage material. The pseudostratified airway organoid epithelium consists of basal cells, functional multi-ciliated cells, mucus-producing goblet cells, and CC10-secreting club cells. Airway organoids derived from cystic fibrosis (CF) patients allow assessment of CFTR function in an organoid swelling assay. Organoid culture conditions also allow gene editing as well as the derivation of various types of lung cancer organoids. Respiratory syncytial virus (RSV) infection recapitulated central disease features and dramatically increases organoid cell motility, found to be driven by the non-structural viral NS2 protein. We conclude that human airway organoids represent versatile models for the in vitro study of hereditary, malignant, and infectious pulmonary disease.
Overview
The claims and statistics of this paper haven’t been checked yet.
Run the check — free, no account needed. It reads the open-access text and checks the sources it cites.
Integrity signals
Registry
Cites
Statistics
Figures
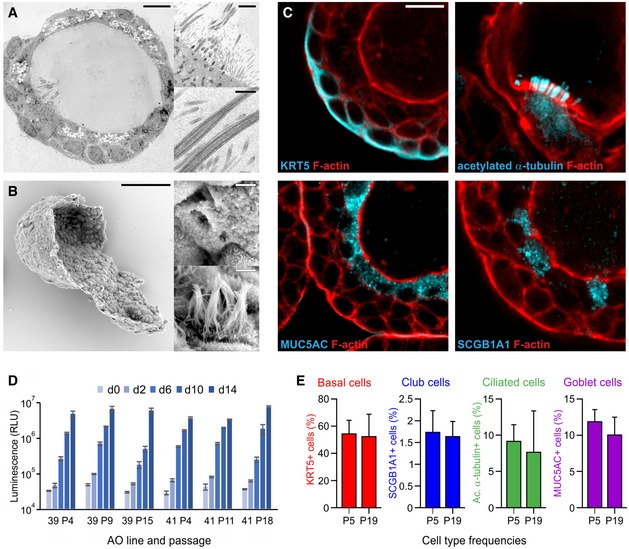
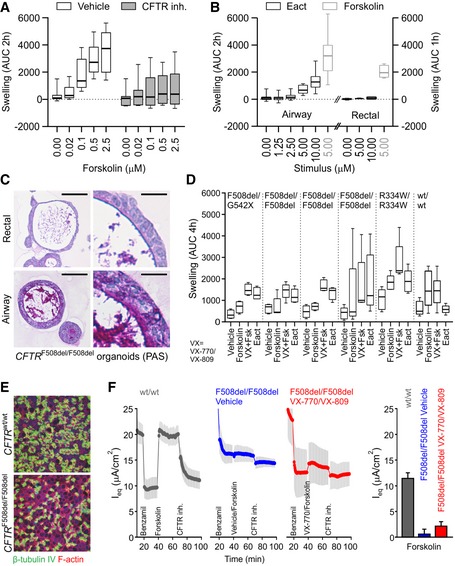
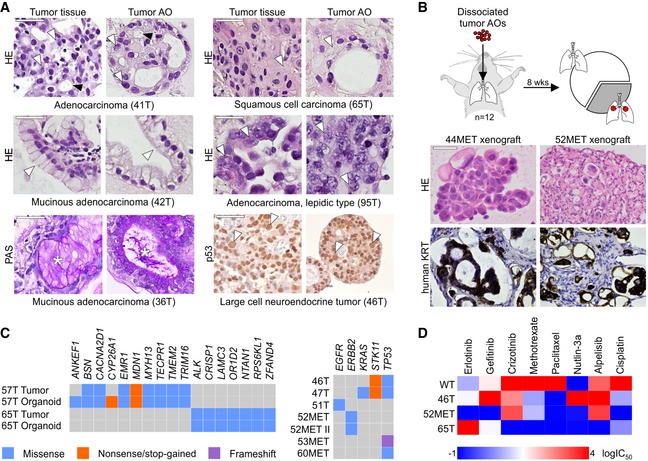
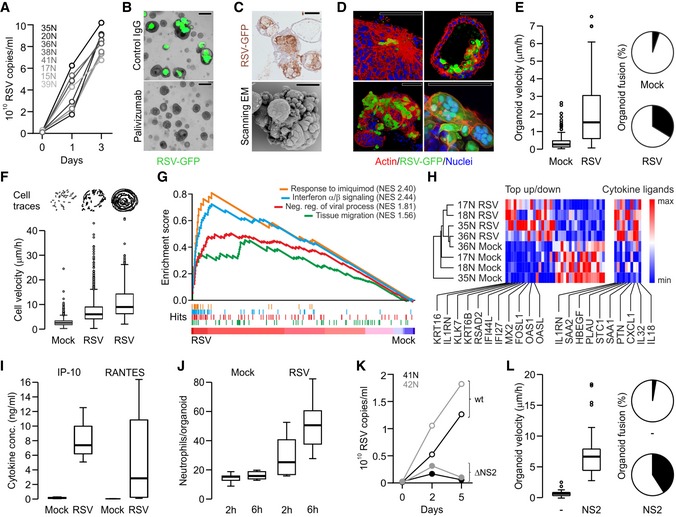
Verification
Claims the paper makes
The claims and statistics of this paper haven’t been checked yet.
Run the check — free, no account needed. It reads the open-access text and checks the sources it cites.
Claims other papers make about this one
Each is checked against this paper’s own text: does it say what the citing paper says it does?
The check wasn’t confident either way, so it gives no verdict — never disputed.
In the citing paper
“Infection of murine gastric organoids by H. pylori showed increased cytosolic β-catenin levels induced by bacterially originated CagA, which led to increased proliferation in infected organoids179.”
From Organoids (2022) · cites this paper as [179]
Experimental — accuracy not yet measured
Self-check
Percentages, sums and reported differences re-computed from the paper’s own numbers.
The self-check needs the paper’s full text.
Citations
Cites
Fast and accurate short read alignment with Burrows-Wheeler transform
Li, H., & Durbin, R. (2009) · Bioinformatics · doi:10.1093/bioinformatics/btp324 · Cited by 58,607
Subramanian, A., Tamayo, P., Mootha, V. K., Mukherjee, S., Ebert, B. L., Gillette, M. A., Paulovich, A., Pomeroy, S. L., Golub, T. R., Lander, E. S., et al. (2005) · Proceedings of the National Academy of Sciences · doi:10.1073/pnas.0506580102 · Cited by 53,625
A framework for variation discovery and genotyping using next-generation DNA sequencing data
DePristo, M. A., Banks, E., Poplin, R. E., Garimella, K. V., Maguire, J., Hartl, C., Philippakis, A., del Angel, G., Rivas, M. A., Hanna, M., et al. (2011) · Nature Genetics · doi:10.1038/ng.806 · Cited by 11,508
Mootha, V. K., Lindgren, C. M., Eriksson, K.-F., Subramanian, A., Sihag, S., Lehar, J., Puigserver, P., Carlsson, E., Ridderstråle, M., Laurila, E., et al. (2003) · Nature Genetics · doi:10.1038/ng1180 · Cited by 10,197
Analysis of protein-coding genetic variation in 60,706 humans
Exome Aggregation Consortium, Lek, M., Karczewski, K. J., Minikel, E. V., Samocha, K. E., Banks, E., Fennell, T., O’Donnell-Luria, A. H., Ware, J. S., Hill, A. J., et al. (2016) · Nature · doi:10.1038/nature19057 · Cited by 9,587
dbSNP: the NCBI database of genetic variation
Sherry, S. T. (2001) · Nucleic Acids Research · doi:10.1093/nar/29.1.308 · Cited by 7,502
In Vivo Activation of the p53 Pathway by Small-Molecule Antagonists of MDM2
Vassilev, L. T., Vu, B. T., Graves, B., Carvajal, D., Podlaski, F., Filipovic, Z., Kong, N., Kammlott, U., Lukacs, C., Klein, C., et al. (2004) · Science · doi:10.1126/science.1092472 · Cited by 4,661
Webb, A. K. (2006) · Cited by 4,369
Sato, T., Stange, D. E., Ferrante, M., Vries, R. G. J., van Es, J. H., van den Brink, S., van Houdt, W. J., Pronk, A., van Gorp, J., Siersema, P. D., et al. (2011) · Gastroenterology · doi:10.1053/j.gastro.2011.07.050 · Cited by 3,753
Self-citationOrganoid Models and Applications in Biomedical Research
Xinaris, C., Brizi, V., & Remuzzi, G. (2015) · The Nephron journals/Nephron journals · doi:10.1159/000433566 · Cited by 3,519
Cited by
Sorted by citations
Items 201–300 of 1,000
Rapid tissue prototyping with micro-organospheres
Wang, Z., Boretto, M., Millen, R., Natesh, N. R., Reckzeh, E. S., Hsu, C., Negrete, M., Yao, H., Quayle, W. B., Heaton, B. E., et al. (2022) · Stem Cell Reports · doi:10.1016/j.stemcr.2022.07.016 · Cited by 56
Self-citationChoi, K.-Y. G., Wu, B. C., Lee, A. H., Baquir, B., & Hancock, R. E. W. (2020) · Frontiers in Cellular and Infection Microbiology · doi:10.3389/fcimb.2020.00228 · Cited by 54
Tian, L., Gao, J., Garcia, I. M., Chen, H. J., Castaldi, A., & Chen, Y. (2020) · Wiley Interdisciplinary Reviews Developmental Biology · doi:10.1002/wdev.399 · Cited by 54
Neoantigen cancer vaccines: a new star on the horizon
Li, X., You, J., Hong, L., Liu, W., Guo, P., & Hao, X. (2023) · Cancer Biology and Medicine · doi:10.20892/j.issn.2095-3941.2023.0395 · Cited by 53
Organoids from pluripotent stem cells and human tissues: When two cultures meet each other
Artegiani, B., & Hendriks, D. F. G. (2025) · Developmental Cell · doi:10.1016/j.devcel.2025.01.005 · Cited by 54
Organoid: a powerful tool to study lung regeneration and disease
Lu, T., Cao, Y., Zhao, P., Shen, S., & Xi, Y. (2021) · Cell Regeneration · doi:10.1186/s13619-021-00082-8 · Cited by 55
Shpichka, A. I., Bikmulina, P., Peshkova, M., Kosheleva, N. V., Михайловна, З. И., Zahmatkesh, E., Rad, N. K., Lipina, M., Голубева, Е. Н., Butnaru, D. V., et al. (2020) · International Journal of Bioprinting · doi:10.18063/ijb.v6i4.302 · Cited by 52
Ekanger, C. T., Zhou, F., Bohan, D., Lotsberg, M. L., Ramnefjell, M., Hoareau, L., Røsland, G. V., Lü, N., Aanerud, M., Gärtner, F., et al. (2022) · Frontiers in Cellular and Infection Microbiology · doi:10.3389/fcimb.2022.841447 · Cited by 55
A multimodal iPSC platform for cystic fibrosis drug testing
Berical, A. C., Lee, R. E., Lu, J., Beermann, M. L., Suer, J. A. L., Mithal, A., Thomas, D., Ranallo, N., Peasley, M., Stuffer, A. J., et al. (2022) · Nature Communications · doi:10.1038/s41467-022-31854-8 · Cited by 52
Measuring cystic fibrosis drug responses in organoids derived from 2D differentiated nasal epithelia
Amatngalim, G. D., Rodenburg, L. W., Aalbers, B. L., Raeven, H. H. M., Aarts, E., Sarhane, D., Spelier, S., Lefferts, J. W., Silva, I. A. L., Nijenhuis, W., et al. (2022) · Life Science Alliance · doi:10.26508/lsa.202101320 · Cited by 56
Self-citationGerli, M., Calà, G., Beesley, M. A., Sina, B., Tullie, L., Sun, K. Y., Panariello, F., Michielin, F., Davidson, J., Russo, F. M., et al. (2024) · Nature Medicine · doi:10.1038/s41591-024-02807-z · Cited by 53
Intestinal organoids for Cystic Fibrosis research
de Poel, E., Lefferts, J. W., & Beekman, J. M. (2019) · Journal of Cystic Fibrosis · doi:10.1016/j.jcf.2019.11.002 · Cited by 51
Self-citationAdvancing lung organoids for COVID-19 research
van der Vaart, J., Lamers, M. M., Haagmans, B. L., & Clevers, H. C. (2021) · Disease Models & Mechanisms · doi:10.1242/dmm.049060 · Cited by 50
Self-citationIntestinal organoids to model cystic fibrosis
van Mourik, P., Beekman, J. M., & van der Ent, C. K. (2019) · European Respiratory Journal · doi:10.1183/13993003.02379-2018 · Cited by 50
Self-citationLopez, J., Ly, P. M., & Feldman, M. F. (2020) · mBio · doi:10.1128/mbio.02761-19 · Cited by 49
Organoids to model the endometrium: implantation and beyond
Rawlings, T. M., Makwana, K., Tryfonos, M., & Lucas, E. S. (2021) · Reproduction and Fertility · doi:10.1530/raf-21-0023 · Cited by 50
Non-Coding RNAs in Lung Tumor Initiation and Progression
Santos, R. M., Moreno, C., & Zhang, W. C. (2020) · International Journal of Molecular Sciences · doi:10.3390/ijms21082774 · Cited by 49
Organoid co‐culture models of the tumor microenvironment promote precision medicine
Gu, Z., Wu, Q., Shang, B., Zhang, K., & Zhang, W. (2024) · Cancer Innovation · doi:10.1002/cai2.101 · Cited by 47
Hu, C., Shen, M., Han, X., Chen, Q., Luo, L., Chen, S., Zhang, J., Gao, F., Wang, W., Wang, Y., et al. (2021) · Genes & Diseases · doi:10.1016/j.gendis.2021.05.006 · Cited by 47
Assays of CFTR Function In Vitro, Ex Vivo and In Vivo
Ramalho, A. S., Boon, M., Proesmans, M., Vermeulen, F. L., Carlon, M. S., & Boeck, K. D. (2022) · International Journal of Molecular Sciences · doi:10.3390/ijms23031437 · Cited by 51
SARS-CoV-2 Omicron efficiently infects human airway, but not alveolar epitheliumPreprint
Lamers, M. M., Mykytyn, A. Z., Breugem, T. I., Gröen, N., Knoops, K., Schipper, D., van Acker, R., van den Doel, P. B., Bestebroer, T. M., Koopman, C. D., et al. (2022) · bioRxiv (Cold Spring Harbor Laboratory) · doi:10.1101/2022.01.19.476898 · Cited by 47
Self-citationA suspension technique for efficient large-scale cancer organoid culturing and perturbation screens
Price, S., Bhosle, S. G., Gonçalves, E., Li, X., McClurg, D. P., Barthorpe, S., Beck, A., Hall, C., Lightfoot, H. W., Farrow, L., et al. (2022) · Scientific Reports · doi:10.1038/s41598-022-09508-y · Cited by 47
Ji, L., Moghal, N., Zou, X., Fang, Y., Hu, S., Wang, Y., & Tsao, M. (2022) · Cancer Medicine · doi:10.1002/cam4.5311 · Cited by 46
Single-Cell Resolution Three-Dimensional Imaging of Intact Organoids
van Ineveld, R. L., Ariese, H. C., Wehrens, E. J., Dekkers, J. F., & Rios, A. C. (2020) · Journal of Visualized Experiments · doi:10.3791/60709 · Cited by 48
Self-citationGarcia, A. L. C., Arlt, V. M., & Phillips, D. H. (2021) · Mutagenesis · doi:10.1093/mutage/geab023 · Cited by 47
Morishita, R., Suzuki, T., Mukherjee, P., El-Sadek, I. A., Lim, Y., Lichtenegger, A., Makita, S., Tomita, K., Yamamoto, Y., Nagamoto, T., et al. (2023) · Biomedical Optics Express · doi:10.1364/boe.488097 · Cited by 47
Lung organoids: advances in generation and 3D-visualization
Cunniff, B., Druso, J. E., & van der Velden, J. L. J. (2021) · Histochemistry and Cell Biology · doi:10.1007/s00418-020-01955-w · Cited by 45
Organoid models: assessing lung cell fate decisions and disease responses
Liberti, D. C., & Morrisey, E. E. (2021) · Trends in Molecular Medicine · doi:10.1016/j.molmed.2021.09.008 · Cited by 45
Engineering rotating apical-out airway organoid for assessing respiratory cilia motility
Wijesekara, P., Yadav, P., Perkins, L. A., Stolz, D. B., Franks, J. M., Watkins, S. C., Jacome, E. R., Brody, S. L., Horani, A., Xu, J., et al. (2022) · iScience · doi:10.1016/j.isci.2022.104730 · Cited by 44
Apical-Out Human Airway Organoids Modeling SARS-CoV-2 Infection
Chiu, M. C., Zhang, S., Li, C., Liu, X., Yu, Y., Huang, J., Wan, Z., Zhu, X., & Zhou, J. (2023) · Viruses · doi:10.3390/v15051166 · Cited by 44
Androgen receptor dynamics in prostate cancer: from disease progression to treatment resistance
Li, C., Cheng, D., & Li, P. (2025) · Frontiers in Oncology · doi:10.3389/fonc.2025.1542811 · Cited by 48
Pharmacological Modulation of Ion Channels for the Treatment of Cystic Fibrosis
Pinto, M. C., Silva, I. A. L., Figueira, M. F., Amaral, M. D., & Lopes‐Pacheco, M. (2021) · Journal of Experimental Pharmacology · doi:10.2147/jep.s255377 · Cited by 44
Studying SARS-CoV-2 infectivity and therapeutic responses with complex organoids
Chen, K. G., Park, K., & Spence, J. R. (2021) · Nature Cell Biology · doi:10.1038/s41556-021-00721-x · Cited by 45
Aihara, A., Iwawaki, T., Abe‐Fukasawa, N., Otsuka, K., Saruhashi, K., Mikashima, T., & Nishino, T. (2022) · Journal of Biological Chemistry · doi:10.1016/j.jbc.2022.101779 · Cited by 45
Wang, S., Chen, J., Jiang, Y., Lei, Z., Ruan, Y. C., Pan, Y., Yam, J. W. P., Wong, M. P., & Xiao, Z. (2023) · Advanced Science · doi:10.1002/advs.202205262 · Cited by 46
Human T cells efficiently control RSV infection
De, C., Pickles, R. J., Yao, W., Liao, B., Boone, A. C., Choi, M., Battaglia, D. M., Askin, F. B., Whitmire, J. K., Silvestri, G., et al. (2023) · JCI Insight · doi:10.1172/jci.insight.168110 · Cited by 43
Applications of lung cancer organoids in precision medicine: from bench to bedside
Li, H., Chen, Z., Chen, N., Fan, Y., Xu, Y., & Xu, X. (2023) · Cell Communication and Signaling · doi:10.1186/s12964-023-01332-9 · Cited by 48
Chatterjee, M., Huang, L. Z. X., Mykytyn, A. Z., Wang, C., Lamers, M. M., Westendorp, B., Wubbolts, R., van Putten, J. P. M., Bosch, B., Haagmans, B. L., et al. (2023) · PLoS Pathogens · doi:10.1371/journal.ppat.1011571 · Cited by 43
Recent advances in chemically defined and tunable hydrogel platforms for organoid culture
Agarwal, T., Celikkin, N., Costantini, M., Maiti, T. K., & Makvandi, P. (2021) · Bio-Design and Manufacturing · doi:10.1007/s42242-021-00126-7 · Cited by 44
Moreira, A., Müller, M., Costa, P. F., & Kohl, Y. (2021) · Advanced Biology · doi:10.1002/adbi.202101139 · Cited by 49
The application of patient-derived organoid in the research of lung cancer
Li, Y., Gao, X., Ni, C., Zhao, B. T., & Cheng, X. (2023) · Cellular Oncology · doi:10.1007/s13402-023-00771-3 · Cited by 41
Taha, T. Y., Suryawanshi, R. K., Chen, I. P., Correy, G. J., McCavitt-Malvido, M., O’Leary, P. C., Jogalekar, M. P., Diolaiti, M. E., Kimmerly, G. R., Tsou, C.-L., et al. (2023) · PLoS Pathogens · doi:10.1371/journal.ppat.1011614 · Cited by 41
Mahieu, L., Moll, L. V., Vooght, L. D., Delputte, P., & Cos, P. (2024) · FEMS Microbiology Reviews · doi:10.1093/femsre/fuae007 · Cited by 44
Vivarelli, S., Candido, S., Caruso, G., Falzone, L., & Libra, M. (2020) · Cancers · doi:10.3390/cancers12123636 · Cited by 41
In Vitro Lung Models and Their Application to Study SARS-CoV-2 Pathogenesis and Disease
Heinen, N., Klöhn, M., Steinmann, E., & Pfaender, S. (2021) · Viruses · doi:10.3390/v13050792 · Cited by 41
Patient-Derived Cancer Organoids for Precision Oncology Treatment
Pernik, M. N., Bird, C. E., Traylor, J. I., Shi, D. D., Richardson, T. E., McBrayer, S. K., & Abdullah, K. G. (2021) · Journal of Personalized Medicine · doi:10.3390/jpm11050423 · Cited by 46
SARS-CoV-2 N protein enhances the anti-apoptotic activity of MCL-1 to promote viral replication
Pan, P., Ge, W., Lei, Z., Luo, W. P., Liu, Y., Guan, Z., Chen, L., Yu, Z., Shen, M., Hu, D., et al. (2023) · Signal Transduction and Targeted Therapy · doi:10.1038/s41392-023-01459-8 · Cited by 41
Miao, M., Pan, M., Chen, X., Shen, J., Zhang, L., Feng, X., Chen, M., Cui, G., Zong, H., Zhang, W., et al. (2024) · Redox Biology · doi:10.1016/j.redox.2024.103100 · Cited by 40
Rijsbergen, L. C., Lamers, M. M., Comvalius, A. D., Koutstaal, R. W., Schipper, D., Duprex, W. P., Haagmans, B. L., de Vries, R. D., & de Swart, R. L. (2021) · mSphere · doi:10.1128/msphere.00237-21 · Cited by 40
Self-citationRen, W., Wang, L., Zhang, X., Feng, X., Zhuang, L., Jiang, N., Xu, R. C., Li, X., Wang, P., Sun, X., et al. (2020) · Theranostics · doi:10.7150/thno.46750 · Cited by 39
Patient-derived Tumour Organoids: A Bridge between Cancer Biology and Personalised Therapy
Wu, W., Li, X., & Yu, S. (2022) · Acta Biomaterialia · doi:10.1016/j.actbio.2022.04.050 · Cited by 40
Patient-Derived Organoid Models of Human Neuroendocrine Carcinoma
Dijkstra, K. K., van den Berg, J. G., Weeber, F., van de Haar, J., Velds, A., Kaing, S., Peters, D. D. G. C., Eskens, F. A. L. M., de Groot, D. J., Tesselaar, M. E. T., et al. (2021) · Frontiers in Endocrinology · doi:10.3389/fendo.2021.627819 · Cited by 42
Self-citationRecent Advancements in Regenerative Approaches for Thymus Rejuvenation
Sharma, H., & Moroni, L. (2021) · Advanced Science · doi:10.1002/advs.202100543 · Cited by 41
Carvalho, V. M., Bañobre‐López, M., Minas, G. M. H., Teixeira, S., Lima, R. A., & Rodrigues, R. O. (2022) · Bioprinting · doi:10.1016/j.bprint.2022.e00224 · Cited by 40
Lung cancer organoids, a promising model still with long way to go
Ma, H., Zhu, Y.-J., Zhou, R., Yu, Y., Xiao, Z., & Zhang, H.-B. (2022) · Critical Reviews in Oncology/Hematology · doi:10.1016/j.critrevonc.2022.103610 · Cited by 41
Jiang, Y., Lu, L., Du, C., Li, Y., Cheng, W., Bi, H., Guo, L., Zhuang, M., Ren, D., Wang, H., et al. (2023) · Frontiers in Bioengineering and Biotechnology · doi:10.3389/fbioe.2022.1105710 · Cited by 38
Magneto-acoustic protein nanostructures for non-invasive imaging of tissue mechanics in vivo
Kim, W.-S., Min, S., Kim, S. K., Kang, S., An, S., Criado-Hidalgo, E., Davis, H. C., Bar‐Zion, A., Malounda, D., Kim, Y. H., et al. (2023) · Nature Materials · doi:10.1038/s41563-023-01688-w · Cited by 39
Patient-Derived Cells to Guide Targeted Therapy for Advanced Lung Adenocarcinoma
Kim, S., Lee, J. Y., Kim, D., Joo, H. S., Yun, M. R., Jung, D., Yun, J., Heo, S. G., Ahn, B., Park, C. W., et al. (2019) · Scientific Reports · doi:10.1038/s41598-019-56356-4 · Cited by 40
Disease modeling following organoid-based expansion of airway epithelial cells
Eenjes, E., van Riet, S., Kroon, A. A., Slats, A. M., Khedoe, P. P. S. J., Munck, A. B., Kempen, M. B., Ninaber, D. K., Reiss, I. K. M., Clevers, H. C., et al. (2021) · American Journal of Physiology-Lung Cellular and Molecular Physiology · doi:10.1152/ajplung.00234.2020 · Cited by 38
Self-citationModeling mucus physiology and pathophysiology in human organs-on-chips
Izadifar, Z., Sontheimer-Phelps, A., Lubamba, B., Bai, H., Fadel, C. W., Stejskalová, A., Özkan, A., Dasgupta, Q., Bein, A., Junaid, A., et al. (2022) · Advanced Drug Delivery Reviews · doi:10.1016/j.addr.2022.114542 · Cited by 39
Lee, R. Y., Wu, Y., Goh, D. L. M., Tan, V., Ng, C. W., Lim, J. C. T., Lau, M. C., & Yeong, J. P.-S. (2023) · Advanced Healthcare Materials · doi:10.1002/adhm.202202457 · Cited by 39
Differences of the tumour cell glycocalyx affect binding of capsaicin-loaded chitosan nanocapsules
von Palubitzki, L., Wang, Y., Hoffmann, S. R. K., Vidal‐y‐Sy, S., Zobiak, B., Failla, A. V., Schmage, P., John, A., Osorio‐Madrazo, A., Bauer, A. T., et al. (2020) · Scientific Reports · doi:10.1038/s41598-020-79882-y · Cited by 37
Chen, X., Shen, J., Jiang, X., Pan, M., Chang, S., Li, J., Wang, L., Miao, M., Feng, X., Zhang, L., et al. (2024) · Theranostics · doi:10.7150/thno.102318 · Cited by 36
Regenerative Engineering: Current Applications and Future Perspectives
Goldenberg, D., McLaughlin, C., Koduru, S. V., & Ravnic, D. J. (2021) · Frontiers in Surgery · doi:10.3389/fsurg.2021.731031 · Cited by 37
Decellularized normal and cancer tissues as tools for cancer research
Gentilin, E., D’Angelo, E., Agostini, M., & Astolfi, L. (2021) · Cancer Gene Therapy · doi:10.1038/s41417-021-00398-2 · Cited by 37
Tran, B. M., Grimley, S. L., McAuley, J., Hachani, A., Earnest, L., Wong, S. L., Caly, L., Druce, J. D., Purcell, D. F. J., Jackson, D. C., et al. (2022) · International Journal of Molecular Sciences · doi:10.3390/ijms23020835 · Cited by 36
The role of macrophages in non-small cell lung cancer and advancements in 3D co-cultures
Balážová, K., Clevers, H. C., & Dost, A. F. M. (2023) · eLife · doi:10.7554/elife.82998 · Cited by 39
Self-citationCancer cell states and emergent properties of the dynamic tumor systemPreprint
Barkley, D., Rao, A. N., Pour, M., França, G. S., & Yanai, I. (2021) · Genome Research · doi:10.1101/gr.275308.121 · Cited by 39
Organoids in cancer research: a review for pathologist‐scientists
Wood, L. D., & Ewald, A. J. (2021) · The Journal of Pathology · doi:10.1002/path.5684 · Cited by 35
Ma, X., Yang, S., Jiang, H., Wang, Y., & Xiang, Z. (2021) · Journal of Translational Medicine · doi:10.1186/s12967-021-03043-6 · Cited by 35
Vazquez‐Armendariz, A. I., Barroso, M. M., Agha, E. E., & Herold, S. (2022) · Cells · doi:10.3390/cells11091526 · Cited by 37
Lung Organoids—The Ultimate Tool to Dissect Pulmonary Diseases?
Bosáková, V., Zuani, M. D., Sládková, L., Garlíková, Z., Jose, S. S., Zelante, T., Kohoutková, M. H., & Frič, J. (2022) · Frontiers in Cell and Developmental Biology · doi:10.3389/fcell.2022.899368 · Cited by 35
Silva, I. A. L., Laselva, O., & Lopes‐Pacheco, M. (2022) · Journal of Personalized Medicine · doi:10.3390/jpm12081321 · Cited by 36
Patient-derived cell models for personalized medicine approaches in cystic fibrosis
Ramalho, A. S., Amato, F., & Gentzsch, M. (2022) · Journal of Cystic Fibrosis · doi:10.1016/j.jcf.2022.11.007 · Cited by 37
The pro-inflammatory response to influenza A virus infection is fueled by endothelial cells
Bauer, L., Rijsbergen, L. C., Leijten, L. M. E., Benavides, F. F. W., Noack, D., Lamers, M. M., Haagmans, B. L., de Vries, R. D., de Swart, R. L., & van Riel, D. A. J. (2023) · Life Science Alliance · doi:10.26508/lsa.202201837 · Cited by 36
Self-citationZeng, X., Ma, Q., Li, X., You, L., Li, J., Fu, X., You, F., & Ren, Y. (2023) · Frontiers in Bioengineering and Biotechnology · doi:10.3389/fbioe.2023.1205157 · Cited by 36
Zhang, S., Zhang, S., Hou, Y., Huang, Y., Cai, J., Wang, G., Cao, Y., Chen, Z., Fang, X., & Bao, W. (2023) · Journal of Virology · doi:10.1128/jvi.00689-23 · Cited by 34
Alveolar Organoids in Lung Disease Modeling
Purev, E., Bahmed, K., & Kośmider, B. (2024) · Biomolecules · doi:10.3390/biom14010115 · Cited by 34
EZH2 Inhibition Promotes Tumor Immunogenicity in Lung Squamous Cell Carcinomas
DuCote, T. J., Song, X., Naughton, K. J., Chen, F., Plaugher, D. R., Childress, A. R., Edgin, A. R., Skaggs, E. M., Qu, X., Liu, J., et al. (2024) · Cancer Research Communications · doi:10.1158/2767-9764.crc-23-0399 · Cited by 36
Application status and optimization suggestions of tumor organoids and CAR-T cell co-culture models
Ning, R.-X., Liu, C.-Y., Wang, S., Li, W.-K., Kong, X., & He, Z. (2024) · Cancer Cell International · doi:10.1186/s12935-024-03272-x · Cited by 35
Raimondi, M. T., Donnaloja, F., Barzaghini, B., Bocconi, A., Conci, C., Parodi, V., Jacchetti, E., & Carelli, S. (2020) · Theranostics · doi:10.7150/thno.47406 · Cited by 34
Tzekaki, E. E., Geromichalos, G. D., Lavrentiadou, S. N., Tsantarliotou, M. P., Pantazaki, Α. A., & Papaspyropoulos, A. (2021) · Breast Cancer Research and Treatment · doi:10.1007/s10549-020-06054-x · Cited by 34
Self-citationBucher, M., Niebling, S., Han, Y., Molodenskiy, D., Hassani Nia, F., Kreienkamp, H.-J., Svergun, D., Kim, E., Kostyukova, A. S., Kreutz, M. R., et al. (2021) · eLife · doi:10.7554/elife.66165 · Cited by 33
Ernhofer, B., Spittler, A., Ferk, F., Mišík, M., Zylka, M. M., Glatt, L., Boettiger, K., Solta, A., Kirchhofer, D., Timelthaler, G., et al. (2025) · Journal of Hazardous Materials · doi:10.1016/j.jhazmat.2025.139129 · Cited by 35
Stem Cells and Organoids: A Paradigm Shift in Preclinical Models Toward Personalized Medicine
Luce, E., & Duclos‐Vallée, J. (2025) · Pharmaceuticals · doi:10.3390/ph18070992 · Cited by 34
Modeling Multi-organ Infection by SARS-CoV-2 Using Stem Cell Technology
Simoneau, C. R., & Ott, M. (2020) · Cell stem cell · doi:10.1016/j.stem.2020.11.012 · Cited by 36
Protocol for generation of lung adenocarcinoma organoids from clinical samples
Li, Z., Yu, L., Chen, D., Meng, Z., Chen, W., & Huang, W. (2020) · STAR Protocols · doi:10.1016/j.xpro.2020.100239 · Cited by 33
Organoids in modelling infectious diseases
Shpichka, A. I., Bikmulina, P., Peshkova, M., Heydari, Z., Kosheleva, N. V., Vosough, M., & Timashev, P. S. (2021) · Drug Discovery Today · doi:10.1016/j.drudis.2021.08.005 · Cited by 35
Advanced models for respiratory disease and drug studies
Shrestha, J., Paudel, K. R., Nazari, H., Dharwal, V., Bazaz, S. R., Johansen, M. D., Dua, K., Hansbro, P. M., & Warkiani, M. E. (2023) · Medicinal Research Reviews · doi:10.1002/med.21956 · Cited by 33
Kim, J., Koo, B., & Yoon, K. (2019) · Viruses · doi:10.3390/v11020124 · Cited by 32
Organoids of human airways to study infectivity and cytopathy of SARS-CoV-2
Elbadawi, M., & Efferth, T. (2020) · The Lancet Respiratory Medicine · doi:10.1016/s2213-2600(20)30238-1 · Cited by 32
Patient‐Derived Upper Tract Urothelial Carcinoma Organoids as a Platform for Drug Screening
Li, Z., Xu, H., Gong, Y., Chen, W., Zhan, Y., Yu, L., Sun, Y., Li, A., He, S., Guan, B., et al. (2021) · Advanced Science · doi:10.1002/advs.202103999 · Cited by 32
Boecking, C. A., Walentek, P., Zlock, L. T., Sun, D. I., Wolters, P. J., Ishikawa, H., Jin, B., Haggie, P. M., Marshall, W. F., Verkman, A. S., et al. (2022) · American Journal of Physiology-Lung Cellular and Molecular Physiology · doi:10.1152/ajplung.00536.2020 · Cited by 32
Salgueiro, L., Kummer, S., Sonntag-Buck, V., Weiß, A., Schneider, M. A., Kräusslich, H., & Sotillo, R. (2022) · Journal of Virology · doi:10.1128/jvi.00098-22 · Cited by 32
Chen, G., Qian, H., Chen, J., Wang, J., Guan, J.-T., & Chi, Z. (2021) · BMC Genomics · doi:10.1186/s12864-021-08078-z · Cited by 31
Opportunities and challenges to engineer 3D models of tumor-adaptive immune interactions
Visalakshan, R. M., Lowrey, M. K., Sousa, M. G. C., Helms, H. R., Samiea, A., Schutt, C. E., Moreau, J. M., & Bertassoni, L. E. (2023) · Frontiers in Immunology · doi:10.3389/fimmu.2023.1162905 · Cited by 32
Toward reproducible tumor organoid culture: focusing on primary liver cancer
Guo, L., Li, C., & Gong, W. (2024) · Frontiers in Immunology · doi:10.3389/fimmu.2024.1290504 · Cited by 34
Diverse bat organoids provide pathophysiological models for zoonotic viruses
Kim, H., Heo, S.-Y., Kim, Y., Park, D., Monford Paul Abishek, N., Hwang, S., Lee, Y.-K., Jang, H. B., Ahn, J., Ha, J., et al. (2025) · Science · doi:10.1126/science.adt1438 · Cited by 31
Lee, D. D. H., Cardinale, D., Nigro, E., Butler, C. R., Rutman, A., Fassad, M. R., Hirst, R. A., MOULDING, D. A., Agrotis, A., Forsythe, E., et al. (2021) · European Respiratory Journal · doi:10.1183/13993003.00455-2020 · Cited by 31
Bagayoko, S., Leon‐Icaza, S. A., Pinilla, M., Hessel, A., Santoni, K., Péricat, D., Bordignon, P., Moreau, F., Eren, E., Boyance, A., et al. (2021) · PLoS Pathogens · doi:10.1371/journal.ppat.1009927 · Cited by 35
Self-citation
Metadata
- Authors
- Sachs, N., Papaspyropoulos, A., Zomer‐van Ommen, D. D., Heo, I., Böttinger, L., Klay, D., Weeber, F., Huelsz‐Prince, G., Iakobachvili, N., Amatngalim, G. D., de Ligt, J., van Hoeck, A., Proost, N., Viveen, M. C., Lyubimova, A., Teeven, L., Derakhshan, S., Korving, J., Begthel, H., Dekkers, J. F., Kumawat, K., Ramos, E., van Oosterhout, M. F., Offerhaus, G. J., Wiener, D. J., Olimpio, E. P., Dijkstra, K. K., Smit, E. F., van der Linden, M., Jaksani, S., van de Ven, M., Jonkers, J., Rios, A. C., Voest, E. E., van Moorsel, C. H., van der Ent, C. K., Cuppen, E., van Oudenaarden, A., Coenjaerts, F. E., Meyaard, L., Bont, L. J., Peters, P. J., Tans, S. J., van Zon, J. S., Boj, S. F., Vries, R. G., Beekman, J. M., & Clevers, H.
- Affiliations
- University Medical Center Utrecht (NL)
- St. Antonius Ziekenhuis (NL)
- The Netherlands Cancer Institute (NL)
- Institute for Atomic and Molecular Physics (NL)
- Maastricht University (NL)
- Hubrecht Institute for Developmental Biology and Stem Cell Research (NL)
- Princess Máxima Center (NL)
- Royal Netherlands Academy of Arts and Sciences (NL)
- Corresponding author
- Clevers, Hans
- ORCID
- Sachs, Norman
- Papaspyropoulos, Angelos
- Klay, Dymph
- Weeber, Fleur
- Iakobachvili, Nino
- Amatngalim, Gimano D
- de Ligt, Joep
- van Hoeck, Arne
- Proost, Natalie
- Begthel, Harry
- Ramos, Emilio
- Offerhaus, G Johan
- Wiener, Dominique J
- Dijkstra, Krijn K
- Smit, Egbert F
- Jonkers, Jos
- Rios, Anne C
- Voest, Emile E
- Cuppen, Edwin
- Coenjaerts, Frank E
- Meyaard, Linde
- Bont, Louis J
- Peters, Peter J
- Tans, Sander J
- Boj, Sylvia F
- Vries, Robert G
- Beekman, Jeffrey M
- Clevers, Hans
- Venue
- The EMBO Journal
- Published
- 2019-01-14
- Volume
- 38
- Issue
- 4
- ISSN
- 0261-4189 (ISSN-L)
- 1460-2075
- PMC
- PMC6376275
- OpenAlex
- W2799736418
- Cited by
- 1,082
- References
- 82
- Citations by year
- 2026: 126 · 2025: 178 · 2024: 137 · 2023: 159 · 2022: 157 · 2021: 182 · 2020: 104 · 2019: 30
- FWCI
- 86.42
- Type
- journal article
- Language
- en
- Open access
- hybrid
- doi.org
- Licence
- Locations
- The EMBO Journal (publishedVersion, cc-by-nc-nd)
- bioRxiv (Cold Spring Harbor Laboratory) (acceptedVersion, cc-by-nc-nd)
- Europe PMC (PubMed Central) (publishedVersion, other-oa)
- PubMed Central (publishedVersion, cc-by-nc-nd)
- PubMed (publishedVersion)
- Research Publications (Maastricht University) (publishedVersion, cc-by-nc-nd)
- KNAW research portal (Royal Academy of Art and Sciences (KNAW)) (publishedVersion, other-oa)
- KNAW Research Portal (The Royal Netherlands Academy of Arts and Sciences) (publishedVersion, other-oa)
- AMOLF Institutional Repository (AMOLF) (submittedVersion, other-oa)
- Data Archiving and Networked Services (DANS) (submittedVersion, cc-by-nc-nd)
- Utrecht University Repository (Utrecht University) (submittedVersion, other-oa)
- Research Publications (Maastricht University) (submittedVersion, cc-by-nc-nd)
- Utrecht University Repository (Utrecht University) (submittedVersion, cc-by-nc-nd)
- Funders
- ZonMw (114021012, 40‐00812‐98‐14103, 91615182)
- Human Frontier Science Program (CDA00076/2014‐C)
- Prof. Dr. Jaap Swieringa Foundation (stAH‐CvM‐HI‐HC)
- Dutch Cystic Fibrosis Society (HIT‐CF)
- SU2C (SU2C‐AACR‐DT‐12‐14)
- KWF Kankerbestrijding (2014‐7006)
- Nederlandse Organisatie voor Wetenschappelijk Onderzoek (680‐47‐529, 834.11.002)
- Topics
- Health Sciences › Medicine › Pulmonary and Respiratory Medicine › Cystic Fibrosis Research Advances
- Health Sciences › Medicine › Pulmonary and Respiratory Medicine › Neonatal Respiratory Health Research
- Health Sciences › Medicine › Surgery › Tissue Engineering and Regenerative Medicine
- Keywords
- airway organoids, cystic fibrosis, CFTR function, lung cancer, metastasis, respiratory syncytial virus, NS2 protein, neutrophil recruitment, disease modeling, Clara cells, ciliated cells
- MeSH terms
- Animals, Carcinoma, Non-Small-Cell Lung, Cells, Cultured, Cystic Fibrosis, Disease Models, Animal, Drug Screening Assays, Antitumor, Epithelial Cells, Female, Humans, Lung Neoplasms, Male, Organ Culture Techniques, Organoids, Respiratory Syncytial Viruses, Respiratory System, Mice, SCID, Mice, Inbred NOD, Respiratory Syncytial Virus Infections, Cystic Fibrosis Transmembrane Conductance Regulator, Xenograft Model Antitumor Assays, Mice
About these checks
Registry, retraction, Cites and statistics results are computed, not judged, with one exception: a printed reference that no index lists is read once by a model before it counts as a citation error. Claims are extracted by a model and kept only when their quote appears verbatim in the text; each cited source is then checked, with a model’s help, for whether it says what the claim relies on. Those verdicts can be wrong — read the claim’s quote and the cited source before relying on one.
Statistics and arithmetic are recomputed, not judged.
Confidence bands are shown only for fields calibrated on our annotated test set. None is calibrated yet, so no band is shown.
What counts as a claim ›How we measure confidence ›How we check this ›
Are you an author, or do you see a problem with this page? Request a review
