Cited by 74

The DOI matches its Crossref record; 26 of the 26 references it cites were found in a registry or an index.

A microRNA signature that correlates with cognition and is a target against cognitive decline

Islam, Md Rezaul, Kaurani, Lalit, Berulava, Tea, Heilbronner, Urs, Budde, Monika, Centeno, Tonatiuh Pena, Elerdashvili, Vakthang, Zafieriou, Maria‐Patapia, Benito, Eva, Sertel, Sinem M, Goldberg, Maria, Senner, Fanny, Kalman, Janos L, Burkhardt, Susanne, Oepen, Anne Sophie, Sakib, Mohammad Sadman, Kerimoglu, Cemil, Wirths, Oliver, Bickeböller, Heike, Bartels, Claudia, Brosseron, Frederic, Buerger, Katharina, Cosma, Nicoleta‐Carmen, Fliessbach, Klaus, Heneka, Michael T., Janowitz, Daniel, Kilimann, Ingo, Kleinedam, Luca, Laske, Christoph, Metzger, Coraline D, Munk, Matthias H, Perneczky, Robert, Peters, Oliver, Priller, Josef, Rauchmann, Boris S., Roy, Nina, Schneider, Anja, Spottke, Annika, Spruth, Eike J, Teipel, Stefan, Tscheuschler, Maike, Wagner, Michael, Wiltfang, Jens, Düzel, Emrah, Jessen, Frank, Delcode Study Group, Rizzoli, Silvio O, Zimmermann, Wolfram‐Hubertus, Schulze, Thomas G, Falkai, Peter, Sananbenesi, Farahnaz, Fischer, Andre·2021·EMBO Molecular Medicine

Abstract

While some individuals age without pathological memory impairments, others develop age‐associated cognitive diseases. Since changes in cognitive function develop slowly over time in these patients, they are often diagnosed at an advanced stage of molecular pathology, a time point when causative treatments fail. Thus, there is great need for the identification of inexpensive and minimal invasive approaches that could be used for screening with the aim to identify individuals at risk for cognitive decline that can then undergo further diagnostics and eventually stratified therapies. In this study, we use an integrative approach combining the analysis of human data and mechanistic studies in model systems to identify a circulating 3‐microRNA signature that reflects key processes linked to neural homeostasis and inform about cognitive status. We furthermore provide evidence that expression changes in this signature represent multiple mechanisms deregulated in the aging and diseased brain and are a suitable target for RNA therapeutics.

Overview

The claims and statistics of this paper haven’t been checked yet.

Run the check — free, no account needed. It reads the open-access text and checks the sources it cites.

A few free checks a day · papers already verified open instantly · results are public

Integrity signals

Registry

Crossref · 10.15252/emmm.202013659

Cites

26 of 26 references verified0 citation errors · 0 not checkable

Statistics

Figures

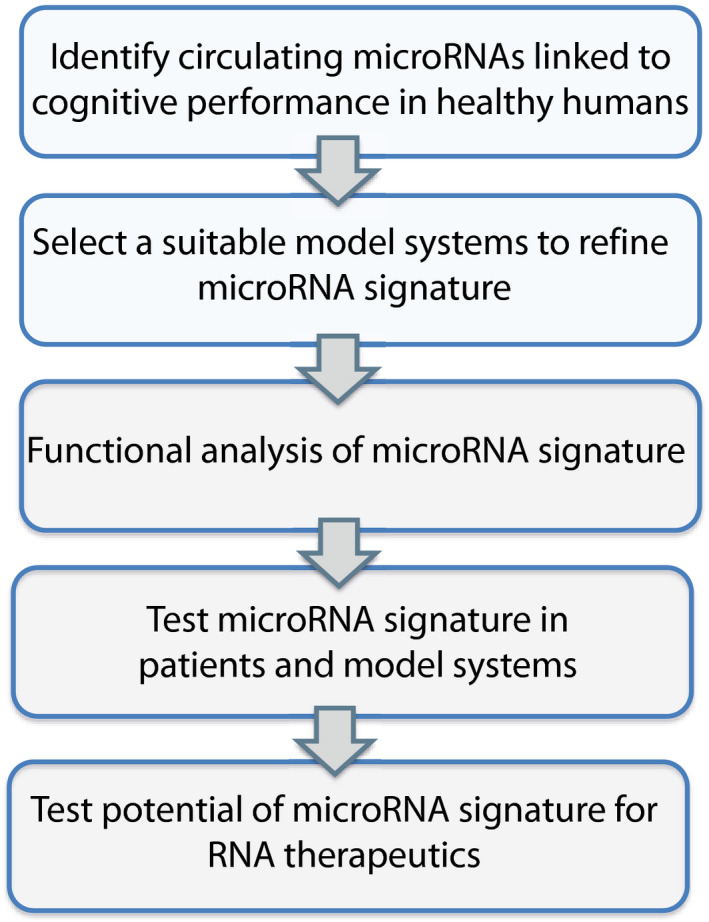
Figure EV1 Experimental approach The scheme displays our overall experimental approach and the various filtering steps to identify circulating microRNAs that informs about the cognitive reserve and would allow the early detection of patients at risk for developing cognitive decline. We hypothesized that a promising approach would be to first identify circulating microRNAs that correlate with memory performance in young and healthy humans. Based on the function of such microRNAs, we then thought to employ model systems to further refine these data and develop a microRNA signature that could then be analyzed at the functional level and be eventually tested in patients and disease models. We also planned to test the potential of such a microRNA signature for RNA therapeutics with the aim to ameliorate cognitive decline.
Figure EV1 Experimental approach The scheme displays our overall experimental approach and the various filtering steps to identify circulating microRNAs that informs about the cognitive reserve and would allow the early detection of patients at risk for developing cognitive decline. We hypothesized that a promising approach would be to first identify circulating microRNAs that correlate with memory performance in young and healthy humans. Based on the function of such microRNAs, we then thought to employ model systems to further refine these data and develop a microRNA signature that could then be analyzed at the functional level and be eventually tested in patients and disease models. We also planned to test the potential of such a microRNA signature for RNA therapeutics with the aim to ameliorate cognitive decline.CC BY · PubMed Central
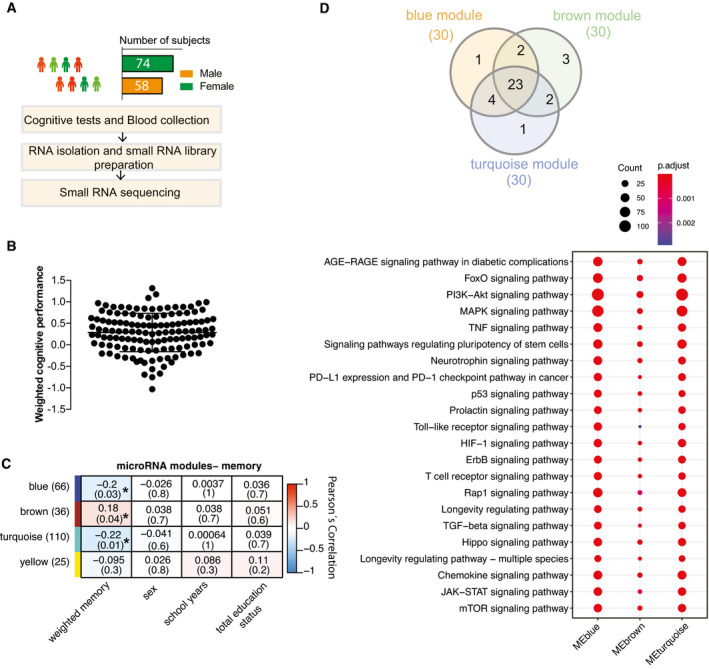
Figure 1 Circulating microRNA expression levels correlate with cognitive function in healthy humans Experimental approach for the detection of blood microRNAs that correlate with memory function in healthy humans. This cohort includes 132 healthy and young individuals (74 males and 58 females, age: 25.95 ± 5.1 years). Participants took part in cognitive tests and donated blood samples (PAXgene tubes).Weighted cognitive score of the 132 individuals shows the expected variability. Bar and error bars indicate mean ± SD.MicroRNAs having at least 5 reads in 50% of the samples were considered for downstream co‐expression analysis. Co‐expression analysis revealed 3 microRNA clusters that were significantly linked to weighted cognitive performance. Number of microRNAs in each module is given in parentheses next to module name. Co‐expression modules are represented in rows, while each column refers to a phenotypic trait. Each cell contains the corresponding correlation coefficient and P‐value (denoted inside parentheses). Color code represents Pearson’s correlation. Expressions of the modules are not correlated with sex, number of years at school, or status of total education.The analysis of the experimentally validated mRNA targets of the microRNAs belonging to 3 clusters identified in (C). Downstream analyses on those genes reveal that they control pathways related to aging and age‐related functions known to play a role in cognition. Venn diagram displays 23 of the top 30 significant pathways are common among three modules. Dot plot represents the top 23 common significant pathways across three modules. Size of the dot represents number of genes belonging to each pathway term while the color represents the statistical significance.
Figure 1 Circulating microRNA expression levels correlate with cognitive function in healthy humans Experimental approach for the detection of blood microRNAs that correlate with memory function in healthy humans. This cohort includes 132 healthy and young individuals (74 males and 58 females, age: 25.95 ± 5.1 years). Participants took part in cognitive tests and donated blood samples (PAXgene tubes).Weighted cognitive score of the 132 individuals shows the expected variability. Bar and error bars indicate mean ± SD.MicroRNAs having at least 5 reads in 50% of the samples were considered for downstream co‐expression analysis. Co‐expression analysis revealed 3 microRNA clusters that were significantly linked to weighted cognitive performance. Number of microRNAs in each module is given in parentheses next to module name. Co‐expression modules are represented in rows, while each column refers to a phenotypic trait. Each cell contains the corresponding correlation coefficient and P‐value (denoted inside parentheses). Color code represents Pearson’s correlation. Expressions of the modules are not correlated with sex, number of years at school, or status of total education.The analysis of the experimentally validated mRNA targets of the microRNAs belonging to 3 clusters identified in (C). Downstream analyses on those genes reveal that they control pathways related to aging and age‐related functions known to play a role in cognition. Venn diagram displays 23 of the top 30 significant pathways are common among three modules. Dot plot represents the top 23 common significant pathways across three modules. Size of the dot represents number of genes belonging to each pathway term while the color represents the statistical significance.CC BY · PubMed Central
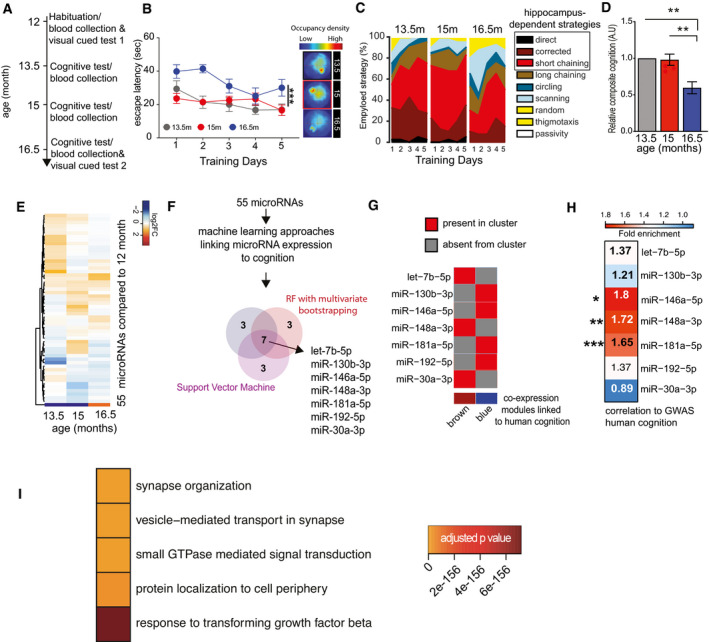
Figure 2 Identification of circulating microRNAs informative about memory decline in mice Experimental design of the water maze experiment. At 12 months of age, male mice were subjected to the water maze training protocol in order to habituate the animals to the procedure. Subsequently, mice were subjected to water maze training followed by a probe test at 13.5, 15, and 16.5 months of age. The platform position was altered during each training procedure. Blood was collected upon completion of each water maze procedure. A visual cued test was performed after the first and after the last blood collection when mice were 12 and 16.5 months of age, respectively.Escape latency during water maze training when mice were 13.5, 15, or 16.5 months of age (n = 10 each group). Two‐way ANOVA followed by Tukey´s multiple comparisons test revealed significant effects of training trials (P‐value < 0.0001) and age (***P‐value 0.0004) on the performance. On days 1 and 2, there was a significant (P‐value < 0.05) difference between mice at 13.5 versus 16.5 months and 15 versus 16.5 months of age (n = 10 each group). On the 5th day of training, there was a significant difference observed between 15 and 16.5 months of age. Density plot (Right) shows the occupancy pattern of mice at different time points of aging. Occupancy signal on the platform was the least at 16.5 months, suggesting mice at the given age failed to locate the platform.Analysis of the different search strategies during the water training sessions. Note that especially at 16.5 months of age mice adopt hippocampal independent search strategies indicative of impaired cognitive function.The cumulative cognitive score calculated for each day on the basis of hippocampal‐dependent strategies was significantly impaired when comparing mice at 16.5 months of age to their performance at 15 or 13.5 months of age. Data are normalized to 13.5‐month group (ordinary one‐way ANOVA, Tukey`s multiple comparison test). N = 10 mice/group, **P < 0.01.Heat map showing the expression pattern of 55 aging responsive microRNAs significantly deregulated during the course of aging. All data are shown in comparison with the expression level at 12 months of age. All microRNAs having at least 100 reads in 50% of the samples were filtered prior to differential expression analysis.Expressions of these 55 microRNAs and cognitive performances along aging were used to identify microRNA features linked to cognition. Three independent approaches [e.g., random forests (RF) with leave‐one‐out cross‐validation, RF with multivariate bootstrapping, and support vector machine (SVM)] find seven common microRNAs that explain cognitive variability assayed in the water maze test.Color map showing that the 7 microRNAs identified in (F) are present in the co‐expression modules significantly linked to cognition in healthy humans as described in Fig 1.Heat map showing the enrichment of mRNA targets of the 7 microRNAs shown in (G) with a gene set identified by GWAS studies linking genes to cognition in healthy humans (Davies & Harris, 2018). Note that target genes of miR‐181a‐5p, miR‐148a‐3p, and miR‐146a‐5p are significantly overlapped in a hypergeometric test (fold enrichment > 1.5 and FDR <0.05). *P = 0.02, **P = 0.0008, ***P = 2.267e‐05.Gene ontology analyses of miR‐181a‐5p, miR‐148a‐3p, and miR‐146a‐5p predicted targets reveal top significant processes linked to neuronal function and inflammation. Heatmap represents the top 5 significant biological processes. Color code represents adjusted P‐value. Data information: Bars and error bars indicate mean ± SEM.
Figure 2 Identification of circulating microRNAs informative about memory decline in mice Experimental design of the water maze experiment. At 12 months of age, male mice were subjected to the water maze training protocol in order to habituate the animals to the procedure. Subsequently, mice were subjected to water maze training followed by a probe test at 13.5, 15, and 16.5 months of age. The platform position was altered during each training procedure. Blood was collected upon completion of each water maze procedure. A visual cued test was performed after the first and after the last blood collection when mice were 12 and 16.5 months of age, respectively.Escape latency during water maze training when mice were 13.5, 15, or 16.5 months of age (n = 10 each group). Two‐way ANOVA followed by Tukey´s multiple comparisons test revealed significant effects of training trials (P‐value < 0.0001) and age (***P‐value 0.0004) on the performance. On days 1 and 2, there was a significant (P‐value < 0.05) difference between mice at 13.5 versus 16.5 months and 15 versus 16.5 months of age (n = 10 each group). On the 5th day of training, there was a significant difference observed between 15 and 16.5 months of age. Density plot (Right) shows the occupancy pattern of mice at different time points of aging. Occupancy signal on the platform was the least at 16.5 months, suggesting mice at the given age failed to locate the platform.Analysis of the different search strategies during the water training sessions. Note that especially at 16.5 months of age mice adopt hippocampal independent search strategies indicative of impaired cognitive function.The cumulative cognitive score calculated for each day on the basis of hippocampal‐dependent strategies was significantly impaired when comparing mice at 16.5 months of age to their performance at 15 or 13.5 months of age. Data are normalized to 13.5‐month group (ordinary one‐way ANOVA, Tukey`s multiple comparison test). N = 10 mice/group, **P < 0.01.Heat map showing the expression pattern of 55 aging responsive microRNAs significantly deregulated during the course of aging. All data are shown in comparison with the expression level at 12 months of age. All microRNAs having at least 100 reads in 50% of the samples were filtered prior to differential expression analysis.Expressions of these 55 microRNAs and cognitive performances along aging were used to identify microRNA features linked to cognition. Three independent approaches [e.g., random forests (RF) with leave‐one‐out cross‐validation, RF with multivariate bootstrapping, and support vector machine (SVM)] find seven common microRNAs that explain cognitive variability assayed in the water maze test.Color map showing that the 7 microRNAs identified in (F) are present in the co‐expression modules significantly linked to cognition in healthy humans as described in Fig 1.Heat map showing the enrichment of mRNA targets of the 7 microRNAs shown in (G) with a gene set identified by GWAS studies linking genes to cognition in healthy humans (Davies & Harris, 2018). Note that target genes of miR‐181a‐5p, miR‐148a‐3p, and miR‐146a‐5p are significantly overlapped in a hypergeometric test (fold enrichment > 1.5 and FDR <0.05). *P = 0.02, **P = 0.0008, ***P = 2.267e‐05.Gene ontology analyses of miR‐181a‐5p, miR‐148a‐3p, and miR‐146a‐5p predicted targets reveal top significant processes linked to neuronal function and inflammation. Heatmap represents the top 5 significant biological processes. Color code represents adjusted P‐value. Data information: Bars and error bars indicate mean ± SEM.CC BY · PubMed Central
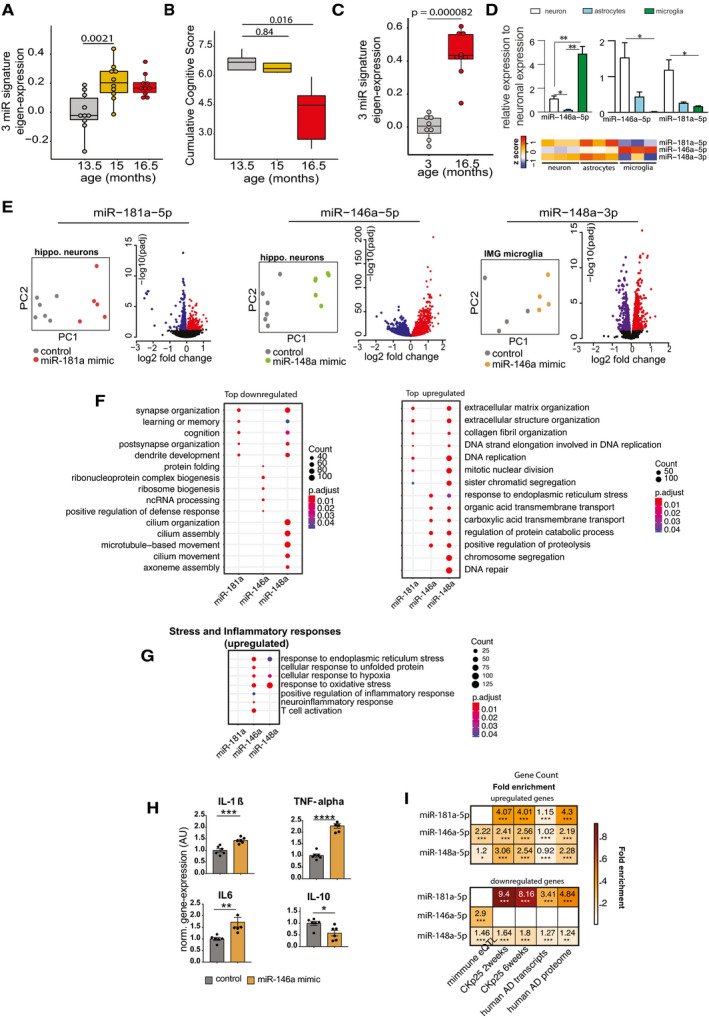
Figure 3 Expression changes in 3‐miR signature reflect aberrant neuronal and immune processes Eigenvalue of the 3‐microRNA signature measured in the mice that performed longitudinal water maze training. Note the significantly increased expression of the signature already at 15 months of age, suggesting that increased expression levels precede detectable cognitive impairment. Number of biological replicates = 10/group, unpaired two‐sided Wilcoxon rank test.Cognitive score measured in the same mice reveals cognitive decline between 15 and 16,5 months of age (P‐value 0.0079). Number of biological replicates = 10/group, unpaired two‐sided Wilcoxon rank test.Eigenvalue showing the expression of the 3‐microRNA signature in the hippocampus of 3 and cognitively impaired 16.5‐month‐old mice. Number of biological replicates (3 months = 8, 16.5 months = 9), unpaired two‐sided Wilcoxon rank test.(Top) Relative enrichment of the three microRNAs across different cell types. Quantitative expression of microRNAs in primary hippocampal neurons, primary astrocytes, and primary microglia. miR‐146a‐5p is significantly enriched in microglia, while miR‐148a‐3p and miR‐181a‐5p are significantly enriched in neurons. N = 5/group, Two‐way ANOVA, Tukey's multiple comparisons test, *P < 0.05, **P < 0.01. Bars and error bar indicate mean ± SEM. (Bottom) miRNA expression in different cell types of mouse brain stem. The data were retrieved from Hoye et al (2017).Overexpression of microRNAs in relevant cell types for 48 h followed by genome wide RNA‐seq analysis. miR‐181a‐5p was overexpressed in primary hippocampal neurons, while miR‐146a‐5p was overexpressed in microglia culture. Immortalized microglial cell line was used for this purpose. Given that miR‐148a‐3p was highly enriched in neurons (D), primary hippocampal neurons were treated with the corresponding miR‐148a‐3p mimic. PCA plot shows that the mimic‐ and control‐treated samples cluster distinguishingly separate from one another. Volcano plot displays the genes significantly deregulated in mimic‐treated samples compared with control samples (FDR < 0.05). Red color indicates the upregulated genes while the blue color represents the genes those were downregulated.Gene ontology analyses for up‐ and downregulated genes. Panel F summarizes top significant up‐ and down‐regulated biological processes corresponding to each microRNA and comparison among them. Overexpression of miR‐181a‐5p and miR‐148a‐3p led to downregulation of genes related to cognition and synaptic functions, while downregulated genes due to increased expression of miR‐146a‐5p represent ncRNA processing, defense response, and protein folding mechanisms. The upregulated genes due to overexpression of these microRNAs represent several processes including extracellular matrix, endoplasmic reticulum stress.Comparison of increased stress and inflammatory responses related significant biological processes among microRNAs. Interestingly, miR‐146a‐5p overexpression in microglia led to increased expression of inflammatory‐related genes. Overexpression of both miR‐146a‐5p and miR‐148a‐3p can increase stress‐related responses. Size of the dot represents the number of genes belonging to the given process, and the color represents the P‐value after multiple corrections.qPCR analysis confirms the overexpression of pro‐inflammation‐related genes (IL‐1β, IL‐6, TNF‐alpha) due to overexpression of miR‐146a‐5p. Expression of anti‐inflammatory gene, IL‐10 was downregulated in mimic‐treated cells compared with the controls. Unpaired t‐tests, two‐tailed, ****P < 0.0001, ***P < 0.001, **P < 0.01, *P < 0.05. Bars and error bar indicate mean ± SEM. Number of biological replicates: 5–6/group.Hypergeometric overlap of the up‐ and downregulated genes (E) with gene sets from different datasets. We calculated enrichment of the deregulated genes relative to those gene sets and used a Fisher's exact test P‐value after multiple adjustments to estimate the significance of the overlap. Immune‐related genes based on expression quantitative loci (eQTL) were retrieved from a previous study. RNA‐seq data from CK‐p25 mice at 2 and 6 weeks after induction were retrieved from GSE65159, and up‐ and downregulated genes compared with littermate controls were determined after differential expression (significant genes; adjusted P‐value<0.05). Up‐ and downregulated transcripts in human AD patients compared with control subjects were determined by analysis of the available data (GSE44770). Proteins those are over‐ and reduced‐expressed in AD patients compared with controls were retrieved from a previous study. Overlap analysis for the up‐ and downregulated genes due to overexpression of microRNAs was performed to those separately from the disease conditions. Human orthologs of the mouse deregulated genes were used to perform the overlap analysis in human datasets. Color code represents fold enrichment. *FDR < 0.05, **FDR < 0.01, ***FDR < 0.001. Data information: In the boxplots in (A, B, C), the centerline indicates the median, while the upper and lower lines represent the 75th and 25th percentiles, respectively. The whiskers represent the smallest and largest values in the 1.5× interquartile range.
Figure 3 Expression changes in 3‐miR signature reflect aberrant neuronal and immune processes Eigenvalue of the 3‐microRNA signature measured in the mice that performed longitudinal water maze training. Note the significantly increased expression of the signature already at 15 months of age, suggesting that increased expression levels precede detectable cognitive impairment. Number of biological replicates = 10/group, unpaired two‐sided Wilcoxon rank test.Cognitive score measured in the same mice reveals cognitive decline between 15 and 16,5 months of age (P‐value 0.0079). Number of biological replicates = 10/group, unpaired two‐sided Wilcoxon rank test.Eigenvalue showing the expression of the 3‐microRNA signature in the hippocampus of 3 and cognitively impaired 16.5‐month‐old mice. Number of biological replicates (3 months = 8, 16.5 months = 9), unpaired two‐sided Wilcoxon rank test.(Top) Relative enrichment of the three microRNAs across different cell types. Quantitative expression of microRNAs in primary hippocampal neurons, primary astrocytes, and primary microglia. miR‐146a‐5p is significantly enriched in microglia, while miR‐148a‐3p and miR‐181a‐5p are significantly enriched in neurons. N = 5/group, Two‐way ANOVA, Tukey's multiple comparisons test, *P < 0.05, **P < 0.01. Bars and error bar indicate mean ± SEM. (Bottom) miRNA expression in different cell types of mouse brain stem. The data were retrieved from Hoye et al (2017).Overexpression of microRNAs in relevant cell types for 48 h followed by genome wide RNA‐seq analysis. miR‐181a‐5p was overexpressed in primary hippocampal neurons, while miR‐146a‐5p was overexpressed in microglia culture. Immortalized microglial cell line was used for this purpose. Given that miR‐148a‐3p was highly enriched in neurons (D), primary hippocampal neurons were treated with the corresponding miR‐148a‐3p mimic. PCA plot shows that the mimic‐ and control‐treated samples cluster distinguishingly separate from one another. Volcano plot displays the genes significantly deregulated in mimic‐treated samples compared with control samples (FDR < 0.05). Red color indicates the upregulated genes while the blue color represents the genes those were downregulated.Gene ontology analyses for up‐ and downregulated genes. Panel F summarizes top significant up‐ and down‐regulated biological processes corresponding to each microRNA and comparison among them. Overexpression of miR‐181a‐5p and miR‐148a‐3p led to downregulation of genes related to cognition and synaptic functions, while downregulated genes due to increased expression of miR‐146a‐5p represent ncRNA processing, defense response, and protein folding mechanisms. The upregulated genes due to overexpression of these microRNAs represent several processes including extracellular matrix, endoplasmic reticulum stress.Comparison of increased stress and inflammatory responses related significant biological processes among microRNAs. Interestingly, miR‐146a‐5p overexpression in microglia led to increased expression of inflammatory‐related genes. Overexpression of both miR‐146a‐5p and miR‐148a‐3p can increase stress‐related responses. Size of the dot represents the number of genes belonging to the given process, and the color represents the P‐value after multiple corrections.qPCR analysis confirms the overexpression of pro‐inflammation‐related genes (IL‐1β, IL‐6, TNF‐alpha) due to overexpression of miR‐146a‐5p. Expression of anti‐inflammatory gene, IL‐10 was downregulated in mimic‐treated cells compared with the controls. Unpaired t‐tests, two‐tailed, ****P < 0.0001, ***P < 0.001, **P < 0.01, *P < 0.05. Bars and error bar indicate mean ± SEM. Number of biological replicates: 5–6/group.Hypergeometric overlap of the up‐ and downregulated genes (E) with gene sets from different datasets. We calculated enrichment of the deregulated genes relative to those gene sets and used a Fisher's exact test P‐value after multiple adjustments to estimate the significance of the overlap. Immune‐related genes based on expression quantitative loci (eQTL) were retrieved from a previous study. RNA‐seq data from CK‐p25 mice at 2 and 6 weeks after induction were retrieved from GSE65159, and up‐ and downregulated genes compared with littermate controls were determined after differential expression (significant genes; adjusted P‐value<0.05). Up‐ and downregulated transcripts in human AD patients compared with control subjects were determined by analysis of the available data (GSE44770). Proteins those are over‐ and reduced‐expressed in AD patients compared with controls were retrieved from a previous study. Overlap analysis for the up‐ and downregulated genes due to overexpression of microRNAs was performed to those separately from the disease conditions. Human orthologs of the mouse deregulated genes were used to perform the overlap analysis in human datasets. Color code represents fold enrichment. *FDR < 0.05, **FDR < 0.01, ***FDR < 0.001. Data information: In the boxplots in (A, B, C), the centerline indicates the median, while the upper and lower lines represent the 75th and 25th percentiles, respectively. The whiskers represent the smallest and largest values in the 1.5× interquartile range.CC BY · PubMed Central
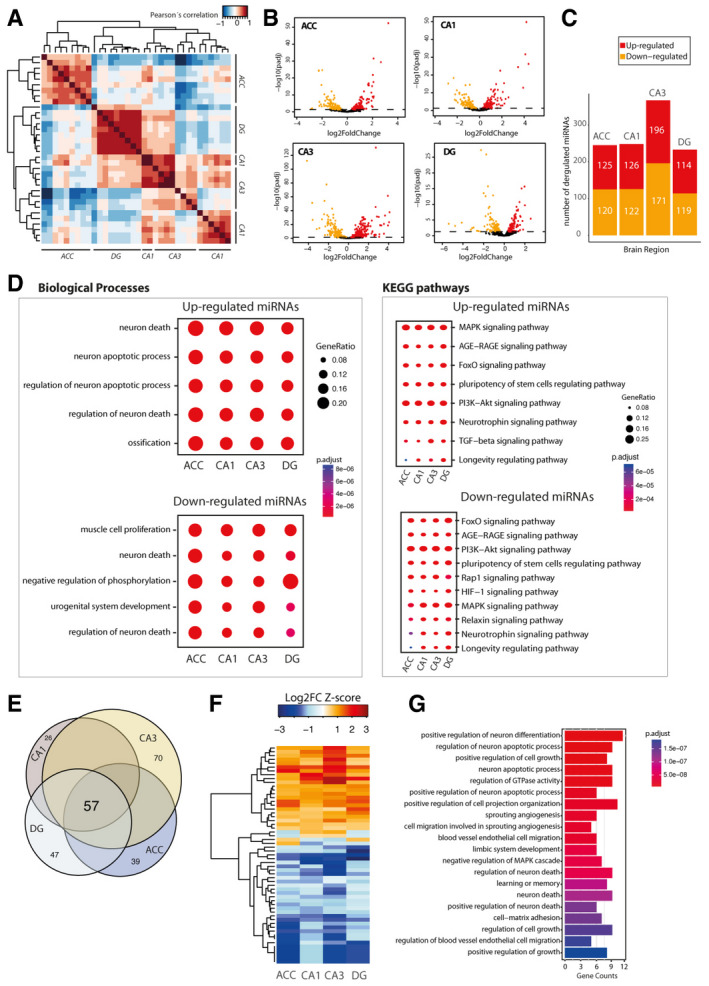
Figure EV2 The microRNAome of learning‐related brain regions in the aging mouse brain We performed small RNA sequencing of the hippocampal sub‐regions CA1, CA3, and dentate gyrus (DG) and the anterior cingulate cortex (ACC) isolated from young (3 months of age) and cognitively impaired old (16.5 months of age) mice. APearson’s coefficient‐based correlation followed by unsupervised clustering of all small RNA‐seq data from different brain regions (ACC; CA1; CA3; DG) in young mice reveals brain region‐specific expression of the microRNAs that were particularly obvious for the ACC versus the hippocampal sub‐regions and the DG versus CA1 and CA3. These region‐specific differences were, however, mainly attributed to different expression values since the majority of the microRNAs, namely 176 microRNAs, could be detected at reliable levels in all investigated brain regions.BVolcano plots showing differential expression of microRNAs in the different brain regions when comparing young versus old mice.CBar plots showing the number of up and downregulated microRNAs in the investigated brain regions.DComparison of gene ontology and functional pathways of experimentally confirmed target genes of the deregulated microRNAs in the investigated brain regions. Pathway is generally linked to neuronal death and longevity pathways.EVenn diagram showing that 57 microRNAs are commonly deregulated in the aging brain.FHeat map showing hierarchical clustering of the 57 commonly deregulated microRNAs based on Log2 fold change Z‐score.GTop 20 biological processes affected by the confirmed target genes of the 57 commonly deregulated microRNAs in the aging brain.
Figure EV2 The microRNAome of learning‐related brain regions in the aging mouse brain We performed small RNA sequencing of the hippocampal sub‐regions CA1, CA3, and dentate gyrus (DG) and the anterior cingulate cortex (ACC) isolated from young (3 months of age) and cognitively impaired old (16.5 months of age) mice. APearson’s coefficient‐based correlation followed by unsupervised clustering of all small RNA‐seq data from different brain regions (ACC; CA1; CA3; DG) in young mice reveals brain region‐specific expression of the microRNAs that were particularly obvious for the ACC versus the hippocampal sub‐regions and the DG versus CA1 and CA3. These region‐specific differences were, however, mainly attributed to different expression values since the majority of the microRNAs, namely 176 microRNAs, could be detected at reliable levels in all investigated brain regions.BVolcano plots showing differential expression of microRNAs in the different brain regions when comparing young versus old mice.CBar plots showing the number of up and downregulated microRNAs in the investigated brain regions.DComparison of gene ontology and functional pathways of experimentally confirmed target genes of the deregulated microRNAs in the investigated brain regions. Pathway is generally linked to neuronal death and longevity pathways.EVenn diagram showing that 57 microRNAs are commonly deregulated in the aging brain.FHeat map showing hierarchical clustering of the 57 commonly deregulated microRNAs based on Log2 fold change Z‐score.GTop 20 biological processes affected by the confirmed target genes of the 57 commonly deregulated microRNAs in the aging brain.CC BY · PubMed Central
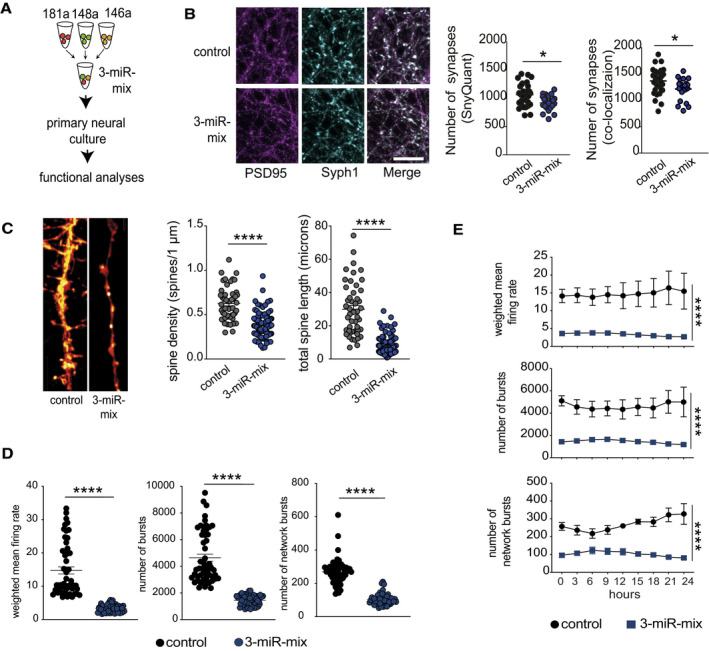
Figure 4 Increased expression of 3‐microRNA signature perturbs synaptic organization and neuronal activity Primary hippocampal neurons were treated with a mixture of 3‐miR mimic or control oligonucleotides, and follow‐up analyses (imaging, electrical recordings) were performed.Functional mature synapses were quantified via co‐localizations of pre‐ (synaptophysin 1) and the postsynaptic (PSD‐95) markers and compared between 3‐miR‐mix and control groups. Scale bar: 10 μm. Two independent methods (SynQuant and Colocalization) were used for quantification. 3‐miR‐mix reduced the number of functional synapses compared with controls (n = 24–30 images)Dendrite labeling and quantification. Dendritic spines were stained with Dil. Scale bar: 10 μm. Spine density and total spine length are substantially reduced in 3‐miR‐mix‐treated primary neurons compared to those treated with scrambled RNA (n = 49–97 images)Hippocampal neurons were cultured in a multielectrode array (MEA) plate equipped with sixteen electrodes. Spontaneous activity of the neurons was recorded at every 3 h (10 min/session) for 24 h. Weighted mean firing rate, number of bursts, and network bursts are significantly decreased in neurons treated with 3‐miR‐mix compared with control.The aberrant neuronal firing activity (weighted mean firing rate) and reduced number of bursts and network bursts were observed across the 24 h of time period. Data information: For panels B, C, D, E, following statistical test has been applied: Unpaired t‐tests, two‐tailed. Bars and error bars in these plots indicate mean ± SEM. *P < 0.05, ****P < 0.0001
Figure 4 Increased expression of 3‐microRNA signature perturbs synaptic organization and neuronal activity Primary hippocampal neurons were treated with a mixture of 3‐miR mimic or control oligonucleotides, and follow‐up analyses (imaging, electrical recordings) were performed.Functional mature synapses were quantified via co‐localizations of pre‐ (synaptophysin 1) and the postsynaptic (PSD‐95) markers and compared between 3‐miR‐mix and control groups. Scale bar: 10 μm. Two independent methods (SynQuant and Colocalization) were used for quantification. 3‐miR‐mix reduced the number of functional synapses compared with controls (n = 24–30 images)Dendrite labeling and quantification. Dendritic spines were stained with Dil. Scale bar: 10 μm. Spine density and total spine length are substantially reduced in 3‐miR‐mix‐treated primary neurons compared to those treated with scrambled RNA (n = 49–97 images)Hippocampal neurons were cultured in a multielectrode array (MEA) plate equipped with sixteen electrodes. Spontaneous activity of the neurons was recorded at every 3 h (10 min/session) for 24 h. Weighted mean firing rate, number of bursts, and network bursts are significantly decreased in neurons treated with 3‐miR‐mix compared with control.The aberrant neuronal firing activity (weighted mean firing rate) and reduced number of bursts and network bursts were observed across the 24 h of time period. Data information: For panels B, C, D, E, following statistical test has been applied: Unpaired t‐tests, two‐tailed. Bars and error bars in these plots indicate mean ± SEM. *P < 0.05, ****P < 0.0001CC BY · PubMed Central
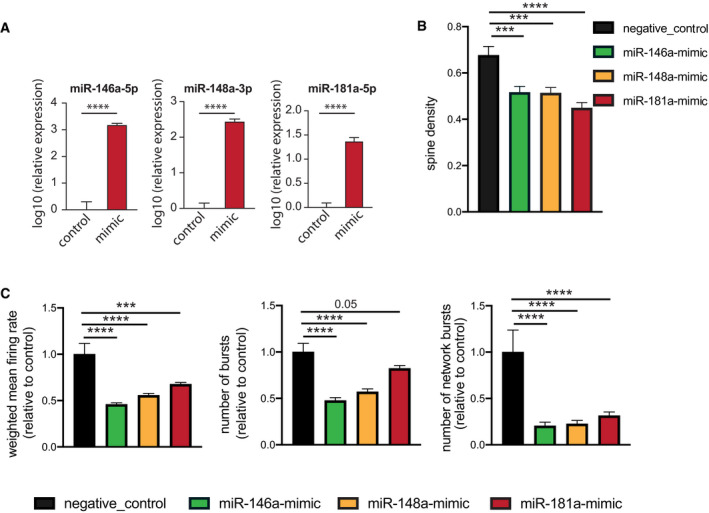
Figure EV3 Effect of individual microRNAs on neuronal functions 3‐miR‐mix containing (miR‐146a‐5p, miR‐181a‐5p, miR‐148a‐3p mimics) was applied on primary hippocampal neurons at DIV10, and its effect was compared to neurons treated with a scrambled control RNA. After 48 h, cells were prepared for RNA Isolation. qPCR data from isolated RNA reveal increased expression of miR‐146a‐5p (left), miR‐148a‐3p (middle), and miR‐181a‐5p (right). Unpaired t‐test, two‐tailed, n = 5/group. ****P < 0.0001. Data are normalized to control and log10 scaled. Error bar indicates mean ± SEM.Primary hippocampal neurons were transfected with scrambled/individual microRNA mimics at DIV7, and dendritic spines were stained with Dil at DIV10 for dendrite labeling and quantification. Spine density is substantially reduced for mimic‐treated primary neurons compared to those treated with scrambled RNA. Barplots showing spine density among groups. N = 20 dendritic segments/group, one‐way ANOVA, Dunnett's multiple comparisons test, ***P < 0.001, ****P < 0.0001.Hippocampal neurons were cultured in a multielectrode array (MEA) plate equipped with sixteen electrodes. Individual microRNA mimic was applied at DIV7, and a downstream neuronal activity was measured at DIV10 and compared to scrambled control‐treated neurons. Weighted mean firing rate, number of bursts, number of network bursts. 6 replicates/group recorded 8× in every 3 h, each record lasting for 10 min. N = 48, one‐way ANOVA, Dunnett's multiple comparisons test, ***P < 0.001, ****P < 0.0001. Error bars indicate mean ± SEM.
Figure EV3 Effect of individual microRNAs on neuronal functions 3‐miR‐mix containing (miR‐146a‐5p, miR‐181a‐5p, miR‐148a‐3p mimics) was applied on primary hippocampal neurons at DIV10, and its effect was compared to neurons treated with a scrambled control RNA. After 48 h, cells were prepared for RNA Isolation. qPCR data from isolated RNA reveal increased expression of miR‐146a‐5p (left), miR‐148a‐3p (middle), and miR‐181a‐5p (right). Unpaired t‐test, two‐tailed, n = 5/group. ****P < 0.0001. Data are normalized to control and log10 scaled. Error bar indicates mean ± SEM.Primary hippocampal neurons were transfected with scrambled/individual microRNA mimics at DIV7, and dendritic spines were stained with Dil at DIV10 for dendrite labeling and quantification. Spine density is substantially reduced for mimic‐treated primary neurons compared to those treated with scrambled RNA. Barplots showing spine density among groups. N = 20 dendritic segments/group, one‐way ANOVA, Dunnett's multiple comparisons test, ***P < 0.001, ****P < 0.0001.Hippocampal neurons were cultured in a multielectrode array (MEA) plate equipped with sixteen electrodes. Individual microRNA mimic was applied at DIV7, and a downstream neuronal activity was measured at DIV10 and compared to scrambled control‐treated neurons. Weighted mean firing rate, number of bursts, number of network bursts. 6 replicates/group recorded 8× in every 3 h, each record lasting for 10 min. N = 48, one‐way ANOVA, Dunnett's multiple comparisons test, ***P < 0.001, ****P < 0.0001. Error bars indicate mean ± SEM.CC BY · PubMed Central
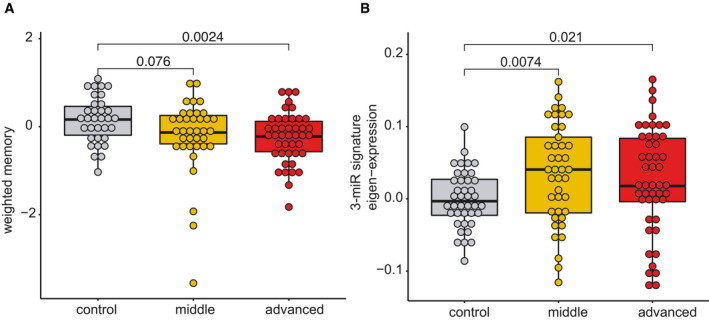
Figure EV4 The 3 microRNA signature changes in aging humans that exhibit cognitive decline Although care has to be taken when comparing data from mice to humans, previous work suggests that 12‐month‐old mice are comparable to 40‐year‐old humans and that 1.5 months in a mouse’s lifetime approximately reflect 5 years of lifetime in humans (Dutta, 2016). Thus, our longitudinal experiment in mice (see Figs 2 and 3A and B) could be compared best to humans from 40 to 55 years of age. This is in line with previous cross‐sectional and longitudinal studies in humans, reporting that impairments of certain cognitive abilities become evident from 40 years of age while after 54 years of age, most cognitive domains significantly decline (Schaie, 1993; Park et al, 2002; Hedden & Gabrieli, 2004; Park & Reuter‐Lorenz, 2009; Salthouse, 2009; Singh‐Manoux et al, 2012). Therefore, we recruited healthy individuals aged between 30 and 77 years of age that were subjected to blood collection and the same cognitive phenotyping as in our discovery cohort (See Fig 1). Based on previous data (Schaie, 1993; Park et al, 2002; Hedden & Gabrieli, 2004; Park & Reuter‐Lorenz, 2009; Salthouse, 2009; Singh‐Manoux et al, 2012), we divided the individuals into a “control group” that is expected to exhibit full cognitive functioning (30–40 years of age), a “middle‐age group” (41–53 years of age) that is expected to show very mild signs of cognitive decline, and an “advanced age group” (54–77 years of age) that are expected to display significant cognitive decline. Despite the fact that older individuals exhibit cognitive impairments, we like to reiterate that all of these individuals were healthy and none of them suffered from mild cognitive impairment or dementia. We confirmed a non‐significant trend for reduced cognition in the “middle‐age group” that became significant in the “advanced age group”.Next, we performed small RNA sequencing from all collected samples and analyzed the microRNA expression. Similar to the data obtained in mice, co‐expression of the 3‐miR signature was significantly increased already in the “middle‐age group” and plateaued in “advanced age group” when compared to individuals 30–40 years of age. Although these data are cross‐sectional, they are in line with our observation from the longitudinal study in mice and suggest that also in humans, expression of the 3‐microRNA signature might increase in blood prior to the detection of significant cognitive impairment, at least in the employed experimental design. Kruskal–Wallis test, n = 40–47 human subjects.
Figure EV4 The 3 microRNA signature changes in aging humans that exhibit cognitive decline Although care has to be taken when comparing data from mice to humans, previous work suggests that 12‐month‐old mice are comparable to 40‐year‐old humans and that 1.5 months in a mouse’s lifetime approximately reflect 5 years of lifetime in humans (Dutta, 2016). Thus, our longitudinal experiment in mice (see Figs 2 and 3A and B) could be compared best to humans from 40 to 55 years of age. This is in line with previous cross‐sectional and longitudinal studies in humans, reporting that impairments of certain cognitive abilities become evident from 40 years of age while after 54 years of age, most cognitive domains significantly decline (Schaie, 1993; Park et al, 2002; Hedden & Gabrieli, 2004; Park & Reuter‐Lorenz, 2009; Salthouse, 2009; Singh‐Manoux et al, 2012). Therefore, we recruited healthy individuals aged between 30 and 77 years of age that were subjected to blood collection and the same cognitive phenotyping as in our discovery cohort (See Fig 1). Based on previous data (Schaie, 1993; Park et al, 2002; Hedden & Gabrieli, 2004; Park & Reuter‐Lorenz, 2009; Salthouse, 2009; Singh‐Manoux et al, 2012), we divided the individuals into a “control group” that is expected to exhibit full cognitive functioning (30–40 years of age), a “middle‐age group” (41–53 years of age) that is expected to show very mild signs of cognitive decline, and an “advanced age group” (54–77 years of age) that are expected to display significant cognitive decline. Despite the fact that older individuals exhibit cognitive impairments, we like to reiterate that all of these individuals were healthy and none of them suffered from mild cognitive impairment or dementia. We confirmed a non‐significant trend for reduced cognition in the “middle‐age group” that became significant in the “advanced age group”.Next, we performed small RNA sequencing from all collected samples and analyzed the microRNA expression. Similar to the data obtained in mice, co‐expression of the 3‐miR signature was significantly increased already in the “middle‐age group” and plateaued in “advanced age group” when compared to individuals 30–40 years of age. Although these data are cross‐sectional, they are in line with our observation from the longitudinal study in mice and suggest that also in humans, expression of the 3‐microRNA signature might increase in blood prior to the detection of significant cognitive impairment, at least in the employed experimental design. Kruskal–Wallis test, n = 40–47 human subjects.CC BY · PubMed Central
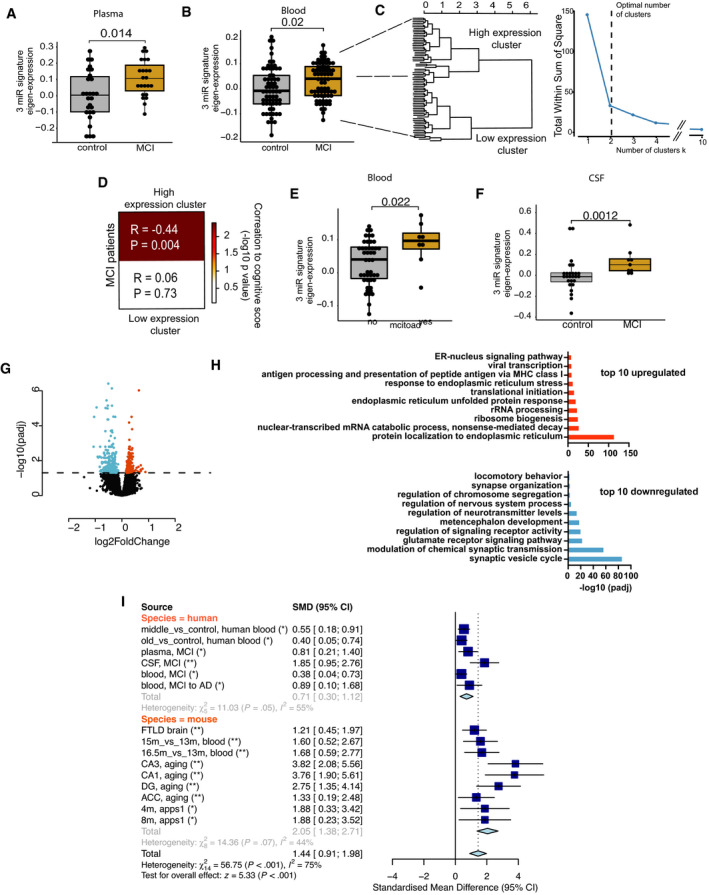
Figure 5 Expression of 3‐microRNA signature in human patients A–FAll data have been adjusted for age, gender, and other latent covariates for downstream eigenvalue calculation. (A) Eigenvalue showing the increased expression of the 3‐microRNA signature in blood plasma samples of age‐matched MCI (n = 23) patients compared with controls (n = 27). (B) Expression of 3‐microRNA signature is increased in PAXgene blood samples of MCI patients (n = 71) compared with controls (n = 65) from the DELCODE cohort. (C) Clustering of eigen expression identifies two expression clusters in MCI patients based on elbow method of detecting optimum number of clusters. (D) Patients representing the cluster with higher expression of 3‐miR eigenvalue show negative correlation with their weighted cognitive score (cor = 0.444, P = 0.004). In contrast, patients with low expression of 3‐miR signature did not show significant correlation with the cognitive score (P = 0.73). (E) Eigenvalue showing the expression of the 3‐microRNA signature in MCI patients for those the follow‐up diagnostic data assessed 2 years after was available. 15% of these MCI patients developed Alzheimer´s disease (AD), while the rest 85% patients remained with MCI (stable MCI). The boxplot depicts the increased expression levels of 3‐miR signature in patients who converted to AD (n = 8) compared with those that had stable MCI (n = 47). (F) Increased expression of 3‐microRNA signature in cerebrospinal fluid (CSF) of MCI patients (n = 9) compared with controls (n = 26). Wilcoxon rank test, P‐value is given on the corresponding panel. In the boxplots in (A, B, E, F), the centerline indicates the median, while the upper and lower lines represent the 75th and 25th percentiles, respectively. The whiskers represent the smallest and largest values in the 1.5× interquartile range.GHuman bioengineered neuronal organoids (BENOs) were treated at DIV 60 with the 3‐miR‐mix or corresponding controls for 24 h, and RNA‐seq was performed from prepared RNA. Volcano plot displays the significant deregulated genes in BENOs after over‐expressing the 3‐miR‐mix (FDR < 0.05).HGene ontology shows top 10 significant up‐ and downregulated processes based on the differentially expressed genes. X‐axis represents the ‐log10 of adjusted P‐value.IA meta‐analysis for 3‐microRNA signature was performed across different datasets. The upper part shows the human datasets, while the lower part shows the investigated mouse datasets. In addition to the datasets presented in our study, we also employed cortical small RNAome data (GSE8998) from a fronto‐temporal dementia (FTLD) mouse model at a presymptomatic state (Swarup et al, 2018). Standardized mean difference (SMD) of zero indicates no effect. Deviation from zero would indicate either an increase or a decrease in the eigen expression for the 3‐microRNA signature. Asterisks represent the adjusted P‐value across studies (length = 15). *P < 0.05, **P < 0.01. Standardized mean difference (SMD) of 3‐microRNA signature is given along with the corresponding lower and upper intervals. A large pooled standardized mean difference (1.44) for 3‐microRNA signature was observed across species, and the overall effect in both species (Z = 5.33) was highly significant (P < 0.001).
Figure 5 Expression of 3‐microRNA signature in human patients A–FAll data have been adjusted for age, gender, and other latent covariates for downstream eigenvalue calculation. (A) Eigenvalue showing the increased expression of the 3‐microRNA signature in blood plasma samples of age‐matched MCI (n = 23) patients compared with controls (n = 27). (B) Expression of 3‐microRNA signature is increased in PAXgene blood samples of MCI patients (n = 71) compared with controls (n = 65) from the DELCODE cohort. (C) Clustering of eigen expression identifies two expression clusters in MCI patients based on elbow method of detecting optimum number of clusters. (D) Patients representing the cluster with higher expression of 3‐miR eigenvalue show negative correlation with their weighted cognitive score (cor = 0.444, P = 0.004). In contrast, patients with low expression of 3‐miR signature did not show significant correlation with the cognitive score (P = 0.73). (E) Eigenvalue showing the expression of the 3‐microRNA signature in MCI patients for those the follow‐up diagnostic data assessed 2 years after was available. 15% of these MCI patients developed Alzheimer´s disease (AD), while the rest 85% patients remained with MCI (stable MCI). The boxplot depicts the increased expression levels of 3‐miR signature in patients who converted to AD (n = 8) compared with those that had stable MCI (n = 47). (F) Increased expression of 3‐microRNA signature in cerebrospinal fluid (CSF) of MCI patients (n = 9) compared with controls (n = 26). Wilcoxon rank test, P‐value is given on the corresponding panel. In the boxplots in (A, B, E, F), the centerline indicates the median, while the upper and lower lines represent the 75th and 25th percentiles, respectively. The whiskers represent the smallest and largest values in the 1.5× interquartile range.GHuman bioengineered neuronal organoids (BENOs) were treated at DIV 60 with the 3‐miR‐mix or corresponding controls for 24 h, and RNA‐seq was performed from prepared RNA. Volcano plot displays the significant deregulated genes in BENOs after over‐expressing the 3‐miR‐mix (FDR < 0.05).HGene ontology shows top 10 significant up‐ and downregulated processes based on the differentially expressed genes. X‐axis represents the ‐log10 of adjusted P‐value.IA meta‐analysis for 3‐microRNA signature was performed across different datasets. The upper part shows the human datasets, while the lower part shows the investigated mouse datasets. In addition to the datasets presented in our study, we also employed cortical small RNAome data (GSE8998) from a fronto‐temporal dementia (FTLD) mouse model at a presymptomatic state (Swarup et al, 2018). Standardized mean difference (SMD) of zero indicates no effect. Deviation from zero would indicate either an increase or a decrease in the eigen expression for the 3‐microRNA signature. Asterisks represent the adjusted P‐value across studies (length = 15). *P < 0.05, **P < 0.01. Standardized mean difference (SMD) of 3‐microRNA signature is given along with the corresponding lower and upper intervals. A large pooled standardized mean difference (1.44) for 3‐microRNA signature was observed across species, and the overall effect in both species (Z = 5.33) was highly significant (P < 0.001).CC BY · PubMed Central
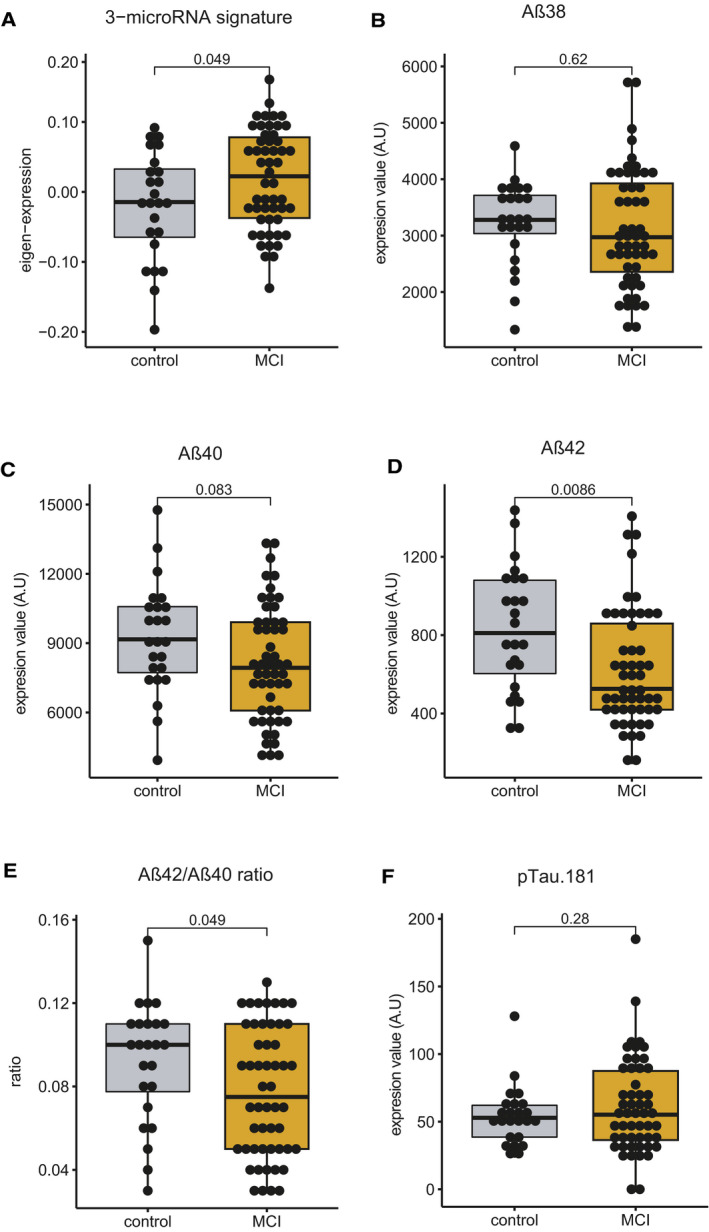
Figure EV5 Comparison of the 3‐microRNA signature in blood with established CSF AD biomarker within the same control and MCI patients Please note that expression data of the CSF biomarker were not available for all the samples used in Fig 5B. Therefore, the comparative analysis of the blood 3‐microRNA signature and the CSF biomarker was performed on control and MCI patients for which all datasets were available; control = 24, MCI = 52. A–EEigenvalue of 3‐microRNA signature in blood is significantly increased in MCI patients compared with controls. Levels of (B) Aβ38 and (C) Aβ40 did not change significantly between patients and control subjects. Both (D) Aβ42 alone and (E) Aβ42/40 ratio were significantly different between control and MCI patients.FThere was no statistically significant difference in the levels of phosphorylated Tau 181 when comparing MCI patient versus controls. Since Tau could be considered a marker for neurodegeneration, it is not unexpected that changes in Aβ precede changes in Tau pathology. Unpaired t‐tests, two‐tailed. These data suggest that the 3‐microRNA signature is comparable to more invasive established AD biomarker.
Figure EV5 Comparison of the 3‐microRNA signature in blood with established CSF AD biomarker within the same control and MCI patients Please note that expression data of the CSF biomarker were not available for all the samples used in Fig 5B. Therefore, the comparative analysis of the blood 3‐microRNA signature and the CSF biomarker was performed on control and MCI patients for which all datasets were available; control = 24, MCI = 52. A–EEigenvalue of 3‐microRNA signature in blood is significantly increased in MCI patients compared with controls. Levels of (B) Aβ38 and (C) Aβ40 did not change significantly between patients and control subjects. Both (D) Aβ42 alone and (E) Aβ42/40 ratio were significantly different between control and MCI patients.FThere was no statistically significant difference in the levels of phosphorylated Tau 181 when comparing MCI patient versus controls. Since Tau could be considered a marker for neurodegeneration, it is not unexpected that changes in Aβ precede changes in Tau pathology. Unpaired t‐tests, two‐tailed. These data suggest that the 3‐microRNA signature is comparable to more invasive established AD biomarker.CC BY · PubMed Central
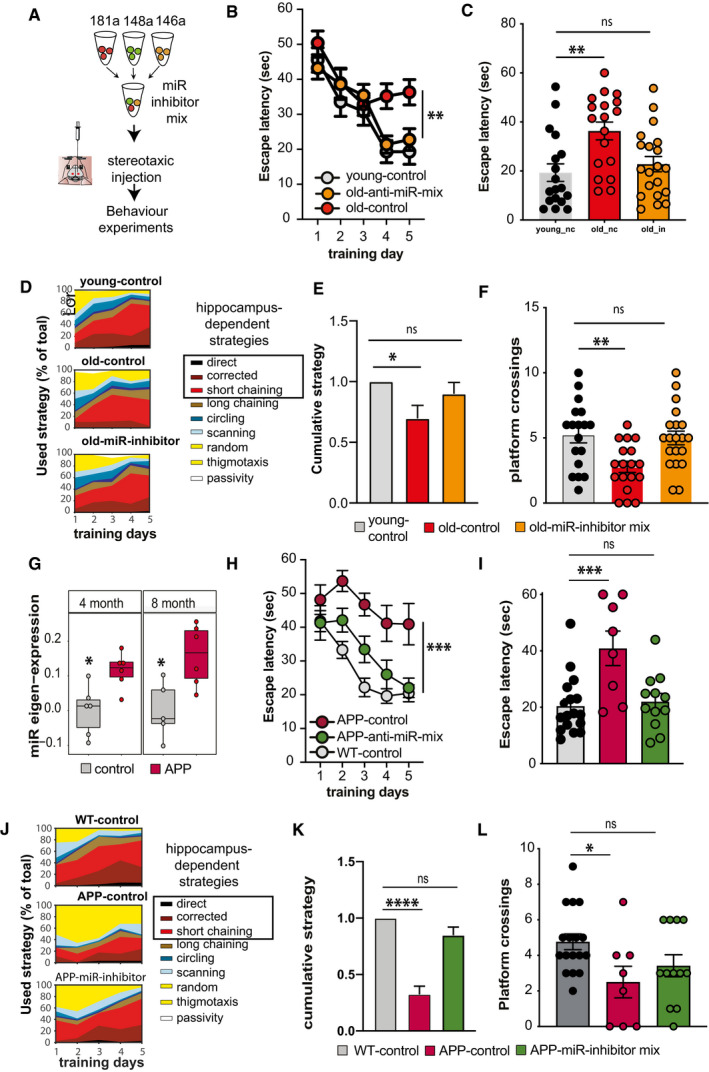
Figure 6 Targeting the 3‐microRNA signature reinstates cognitive function in mouse models for dementia Experimental design. Inhibitor mixture for 3 microRNAs (anti‐miR‐mix), namely miR‐181a‐5p, miR‐148‐3p, and miR‐146a‐5p was injected into the hippocampal CA of male wild‐type mice prior to behavioral testing. As control, scrambled siRNAs were injected as described above. Experiments were performed in two mouse models representing aging and Alzheimer´s disease (AD).Escape latency during the water maze training comparing 3‐month‐old (young‐control, n = 18) mice and 16,5‐month‐old (old‐control, n = 18) mice injected with scrambled control oligonucleotides and 16,5‐month‐old mice injected with microRNA inhibitors (old miR‐inhibitor mix, n = 20). Bars and error bars indicate mean ± SEM.Escape latency on final day of water maze training was impaired improved in old mice treated with the microRNA inhibitors mix. Young‐control (n = 18, 19.3 ± 15.23, mean ± SD); old‐control (n = 18, 36.31 ± 15.38, mean ± SD); old‐inhibitor (n = 20, 22.78 ± 13.85, mean ± SD).Depiction of the search strategies during the water maze training.The cumulative cognitive score calculated for each day on the basis of hippocampal‐dependent strategies was significantly impaired when comparing mice old‐control mice to young‐control mice. Data are normalized to young‐control group. Bars and error bars indicate mean ± SEM. Number of mice: young‐control, n = 18; old‐control, n = 18; old miR‐inhibitor mix, n = 20.Number of visits to the platform during the probe test. young‐control (5.2 ± 2.5, mean ± SD); old‐control (2.7 ± 1.83, mean ± SD); old‐inhibitor (5.0 ± 2.3, mean ± SD). All mice were male. Number of mice: young‐control, n = 18; old‐control, n = 18; old miR‐inhibitor mix, n = 20.Eigenvalue showing the expression of the 3‐microRNA signature in the hippocampus of 4‐ and 8‐month‐old APPPS1‐21 mice. The centerline indicates the median, while the upper and lower lines represent the 75th and 25th percentiles, respectively. The whiskers represent the smallest and largest values in the 1.5× interquartile range. Number of mice: 5–6/group.Escape latency during the water maze training comparing 7‐month‐old wild‐type mice (WT control, n = 17, male: 9, female: 8) and APPPS‐21 mice (APP‐control, n = 8, male: 6, female: 2) injected with scrambled control oligonucleotides and APPPS1‐21 mice injected with microRNA inhibitors (APP miR‐inhibitor mix, n = 12, male: 8, female: 4). Bars and error bars indicate mean ± SEM.Escape latency measured on the last day of water maze training was reduced in APP‐control mice. However, learning performance was rescued in APP miR‐inhibitor mix mice. WT control: 20.43 ± 10.33 (mean ± SD), APP‐control: 40.92 ± 17.33 (mean ± SD), and APP miR‐inhibitor mix: 22.04 ± 9.96 (mean ± SD). Sex did not affect the data. Number of mice: WT control, n = 17, male: 9, female: 8; APP‐control, n = 8, male: 6, female: 2; APP miR‐inhibitor mix, n = 12, male: 8, female: 4.Depiction of the search strategies during the water maze training in experimental groups.The cumulative cognitive score calculated for each day on the basis of hippocampal‐dependent strategies was significantly impaired when comparing WT control mice to APP‐control mice. Data are normalized to WT control group. Bars and error bars indicate mean ± SEM. Number of mice: WT control, n = 17, male: 9, female: 8; APP‐control, n = 8, male: 6, female: 2; APP miR‐inhibitor mix, n = 12, male: 8, female: 4.Comparison of the number of visits to the platform during probe test. WT control: 4.76 ± 1.82 (mean ± SD), APP‐control: 2.5 ± 2.5 (mean ± SD), and APP miR‐inhibitor mix: 3.41 ± 2.15 (mean ± SD). Bars and error bars indicate mean ± SEM. Number of mice: WT control, n = 17, male: 9, female: 8; APP‐control, n = 8, male: 6, female: 2; APP miR‐inhibitor mix, n = 12, male: 8, female: 4. Data information: (B, H) Mixed‐effects analysis followed by Tukey’s multiple comparison test. (C, E, F, I, K, L) One‐way ANOVA followed by Dunnett´s multiple comparisons test. (G) Unpaired t‐tests, two‐tailed. *P < 0.05, **P < 0.01, ***P < 0.001, ****P < 0.0001.
Figure 6 Targeting the 3‐microRNA signature reinstates cognitive function in mouse models for dementia Experimental design. Inhibitor mixture for 3 microRNAs (anti‐miR‐mix), namely miR‐181a‐5p, miR‐148‐3p, and miR‐146a‐5p was injected into the hippocampal CA of male wild‐type mice prior to behavioral testing. As control, scrambled siRNAs were injected as described above. Experiments were performed in two mouse models representing aging and Alzheimer´s disease (AD).Escape latency during the water maze training comparing 3‐month‐old (young‐control, n = 18) mice and 16,5‐month‐old (old‐control, n = 18) mice injected with scrambled control oligonucleotides and 16,5‐month‐old mice injected with microRNA inhibitors (old miR‐inhibitor mix, n = 20). Bars and error bars indicate mean ± SEM.Escape latency on final day of water maze training was impaired improved in old mice treated with the microRNA inhibitors mix. Young‐control (n = 18, 19.3 ± 15.23, mean ± SD); old‐control (n = 18, 36.31 ± 15.38, mean ± SD); old‐inhibitor (n = 20, 22.78 ± 13.85, mean ± SD).Depiction of the search strategies during the water maze training.The cumulative cognitive score calculated for each day on the basis of hippocampal‐dependent strategies was significantly impaired when comparing mice old‐control mice to young‐control mice. Data are normalized to young‐control group. Bars and error bars indicate mean ± SEM. Number of mice: young‐control, n = 18; old‐control, n = 18; old miR‐inhibitor mix, n = 20.Number of visits to the platform during the probe test. young‐control (5.2 ± 2.5, mean ± SD); old‐control (2.7 ± 1.83, mean ± SD); old‐inhibitor (5.0 ± 2.3, mean ± SD). All mice were male. Number of mice: young‐control, n = 18; old‐control, n = 18; old miR‐inhibitor mix, n = 20.Eigenvalue showing the expression of the 3‐microRNA signature in the hippocampus of 4‐ and 8‐month‐old APPPS1‐21 mice. The centerline indicates the median, while the upper and lower lines represent the 75th and 25th percentiles, respectively. The whiskers represent the smallest and largest values in the 1.5× interquartile range. Number of mice: 5–6/group.Escape latency during the water maze training comparing 7‐month‐old wild‐type mice (WT control, n = 17, male: 9, female: 8) and APPPS‐21 mice (APP‐control, n = 8, male: 6, female: 2) injected with scrambled control oligonucleotides and APPPS1‐21 mice injected with microRNA inhibitors (APP miR‐inhibitor mix, n = 12, male: 8, female: 4). Bars and error bars indicate mean ± SEM.Escape latency measured on the last day of water maze training was reduced in APP‐control mice. However, learning performance was rescued in APP miR‐inhibitor mix mice. WT control: 20.43 ± 10.33 (mean ± SD), APP‐control: 40.92 ± 17.33 (mean ± SD), and APP miR‐inhibitor mix: 22.04 ± 9.96 (mean ± SD). Sex did not affect the data. Number of mice: WT control, n = 17, male: 9, female: 8; APP‐control, n = 8, male: 6, female: 2; APP miR‐inhibitor mix, n = 12, male: 8, female: 4.Depiction of the search strategies during the water maze training in experimental groups.The cumulative cognitive score calculated for each day on the basis of hippocampal‐dependent strategies was significantly impaired when comparing WT control mice to APP‐control mice. Data are normalized to WT control group. Bars and error bars indicate mean ± SEM. Number of mice: WT control, n = 17, male: 9, female: 8; APP‐control, n = 8, male: 6, female: 2; APP miR‐inhibitor mix, n = 12, male: 8, female: 4.Comparison of the number of visits to the platform during probe test. WT control: 4.76 ± 1.82 (mean ± SD), APP‐control: 2.5 ± 2.5 (mean ± SD), and APP miR‐inhibitor mix: 3.41 ± 2.15 (mean ± SD). Bars and error bars indicate mean ± SEM. Number of mice: WT control, n = 17, male: 9, female: 8; APP‐control, n = 8, male: 6, female: 2; APP miR‐inhibitor mix, n = 12, male: 8, female: 4. Data information: (B, H) Mixed‐effects analysis followed by Tukey’s multiple comparison test. (C, E, F, I, K, L) One‐way ANOVA followed by Dunnett´s multiple comparisons test. (G) Unpaired t‐tests, two‐tailed. *P < 0.05, **P < 0.01, ***P < 0.001, ****P < 0.0001.CC BY · PubMed Central
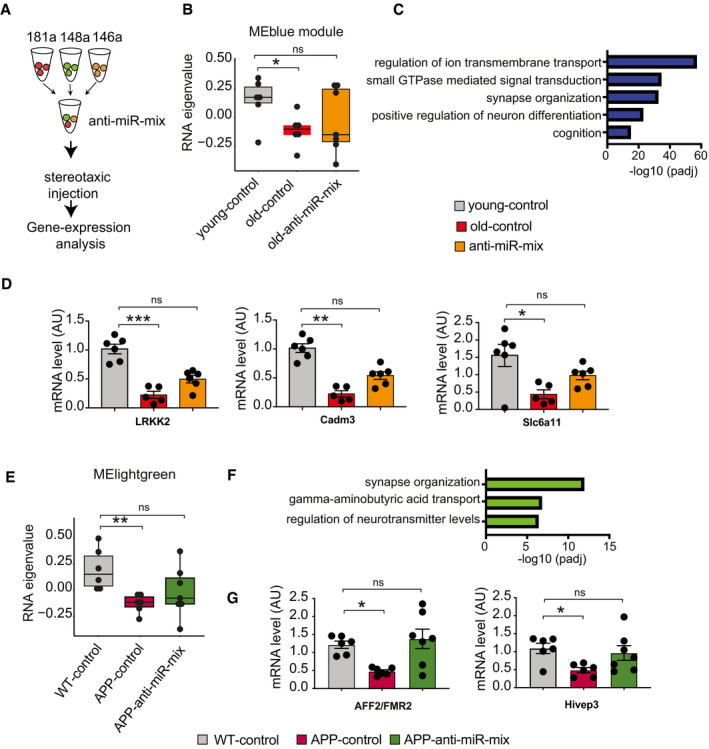
Figure 7 The 3‐microRNA signature is a target for RNA therapeutics to treat neuronal dysfunction Experimental outline. Anti‐miR‐mix of the 3 microRNAs was injected into the dorsal hippocampus of the mice as previously described. RNA‐seq data were generated from dorsal hippocampal tissues and compared to those treated with control scrambled oligonucleotides.Weighted gene co‐expression analysis of hippocampal RNA‐seq data identified the MEblue gene cluster that is decreased when comparing 3‐month‐old mice (young‐control) to cognitively impaired 16.5‐month‐old mice (old‐control) with a scramble control oligonucleotide injected. Treating old mice with the miR‐inhibitor mix (old miR‐inhibitor mix) reinstated gene expression of this cluster, at least in part (n = 6–7, Kruskal–Wallis test).Gene ontology reveals that the MEblue cluster is linked to cognition and synapse organization.qPCR assay for several synaptic genes (LRKK2, Cadm3, and Slc6a11) confirms reinstatement of gene expression with anti‐miR‐mix (n = 5–7, Kruskal–Wallis test).Weighted gene co‐expression analysis of hippocampal RNA‐seq data identified a MElightgreen gene cluster that is decreased when comparing wild‐type control (WT control) to APPPS1‐21 mice (APP‐control) and was reinstated in APPPS1‐21 mice‐treated miR‐inhibitor mix (n = 6–7, Kruskal–Wallis test).Gene ontology reveals that the MElightgreen cluster is linked to cognition and synapse organization.qPCR data show rescue of AFF2/FMR2 and Hivep3 expression in APP/PS1 mice treated with inhibitor cocktail (n = 6–7, Kruskal–Wallis test). Data information: *P < 0.05, **P < 0.01, ***P < 0.001. Bars and error bars indicate mean ± SEM. In boxplots (B, E), the centerline indicates the median, while the upper and lower lines represent the 75th and 25th percentiles, respectively. The whiskers represent the smallest and largest values in the 1.5× interquartile range.
Figure 7 The 3‐microRNA signature is a target for RNA therapeutics to treat neuronal dysfunction Experimental outline. Anti‐miR‐mix of the 3 microRNAs was injected into the dorsal hippocampus of the mice as previously described. RNA‐seq data were generated from dorsal hippocampal tissues and compared to those treated with control scrambled oligonucleotides.Weighted gene co‐expression analysis of hippocampal RNA‐seq data identified the MEblue gene cluster that is decreased when comparing 3‐month‐old mice (young‐control) to cognitively impaired 16.5‐month‐old mice (old‐control) with a scramble control oligonucleotide injected. Treating old mice with the miR‐inhibitor mix (old miR‐inhibitor mix) reinstated gene expression of this cluster, at least in part (n = 6–7, Kruskal–Wallis test).Gene ontology reveals that the MEblue cluster is linked to cognition and synapse organization.qPCR assay for several synaptic genes (LRKK2, Cadm3, and Slc6a11) confirms reinstatement of gene expression with anti‐miR‐mix (n = 5–7, Kruskal–Wallis test).Weighted gene co‐expression analysis of hippocampal RNA‐seq data identified a MElightgreen gene cluster that is decreased when comparing wild‐type control (WT control) to APPPS1‐21 mice (APP‐control) and was reinstated in APPPS1‐21 mice‐treated miR‐inhibitor mix (n = 6–7, Kruskal–Wallis test).Gene ontology reveals that the MElightgreen cluster is linked to cognition and synapse organization.qPCR data show rescue of AFF2/FMR2 and Hivep3 expression in APP/PS1 mice treated with inhibitor cocktail (n = 6–7, Kruskal–Wallis test). Data information: *P < 0.05, **P < 0.01, ***P < 0.001. Bars and error bars indicate mean ± SEM. In boxplots (B, E), the centerline indicates the median, while the upper and lower lines represent the 75th and 25th percentiles, respectively. The whiskers represent the smallest and largest values in the 1.5× interquartile range.CC BY · PubMed Central

Verification

Claims the paper makes

The claims and statistics of this paper haven’t been checked yet.

Run the check — free, no account needed. It reads the open-access text and checks the sources it cites.

A few free checks a day · papers already verified open instantly · results are public

Claims other papers make about this one

Each is checked against this paper’s own text: does it say what the citing paper says it does?

Self-check

Percentages, sums and reported differences re-computed from the paper’s own numbers.

The self-check needs the paper’s full text.

Citations

Cites

Show all 26 references

Research works printed but not linked: 93

  1. Abbott A, Dolgin E (2016) Leading Alzheimer’s theory survives drug failure. Nature 540: 15–16 · DOI
  2. Agís‐Balboa RC, Pinhero P, Rebola N, Kerimoglu C, Benito E, Gertig M, Bahari‐Javan S, Jain G, Burkhardt S, Delalle I et al (2017) Formin 2 links neuropsychiatric phenotypes at young age to an increased risk for dementia. EMBO J 36: 2815–2828 · DOI
  3. Aksoy‐Aksel A, Zampa F, Schratt G (2014) MicroRNAs and synaptic plasticity–a mutual relationship. Philos Trans R Soc Lond B Biol Sci 369: 20130515 · DOI
  4. Alter O, Brown PO, Botstein D (2000) Singular value decomposition for genome‐wide expression data processing and modeling. Proc Natl Acad Sci USA 97: 10101–10106 · DOI
  5. Ansari A, Maffioletti E, Milanesi E, Marizzoni M, Frisoni GB, Blin O, Richardson JC, Bordet R, Forloni G, Gennarelli M et al (2019) miR‐146a and miR‐181a are involved in the progression of mild cognitive impairment to Alzheimer's disease. Neurobiol Aging 82: 102–109 · DOI
  6. Banzhaf‐Strathmann J, Benito E, May S, Arzberger T, Tahirovic S, Kretzschmar H, Fischer A, Edbauer D (2014) MicroRNA‐125b induces tau hyperphosphorylation and cognitive deficits in Alzheimer's disease. EMBO J 33: 1667–1680 · DOI · Paper page
  7. Beason‐Held LL, Goh JO, An Y, Kraut MA, O'Brien RJ, Ferrucci L, Resnick SM (2013) Changes in brain function occur years before the onset of cognitive impairment. J Neurosci 33: 18008–18014 · DOI
  8. Blennow K (2017) A review of fluid biomarkers for Alzheimer's disease: moving from CSF to blood. Neurol Ther 6: 15–24 · DOI · Paper page
  9. Breiman L (2001) Random forests. Mach Learn 45: 5–32 · DOI · Paper page
  10. Budde M, Anderson‐Schmidt H, Gade K, Reich‐Erkelenz D, Adorjan K, Kalman JL, Senner F, Papiol S, Andlauer TFM, Comes AL et al (2018) A longitudinal approach to biological psychiatric research: the PsyCourse study. Am J Med Genet B Neuropsychiatr Genet 180: 89–102 · DOI
  11. Chen L, Dong R, Lu Y, Zhou Y, Li K, Zhang Z, Peng M (2019) microRNA‐146a protects against cognitive decline induced by surgical trauma by suppressing hippocampal neuroinflammation in mice. Brain Behav Immun 24: 188–201 · DOI
  12. Condrat CE, Thompson DC, Barbu MG, Bugnar OL, Boboc A, Cretoiu D, Suciu N, Cretoiu SM, Voinea SC (2020) miRNAs as biomarkers in disease: latest findings regarding their role in diagnosis and prognosis. Cells 9: 276 · DOI
  13. Davies G, Lam M, Harris SE, Trampush JW, Luciano M, Hill WD, Hagenaars SP, Ritchie SJ, Marioni RE, Fawns‐Ritchie C et al (2018) Study of 300,486 individuals identifies 148 independent genetic loci influencing general cognitive function. Nat Commun 1: 2098 · DOI
  14. Deary IJ, Corley J, Gow AJ, Harris SE, Houlihan LM, Marioni RE, Penke L, Rafnsson SB, Starr JM (2009) Age‐associated cognitive decline. Br Med Bull 92: 135–152 · DOI · Paper page
  15. Dicks E, Vermunt L, van der Flier WM, Visser PJ, Barkhof F, Scheltens P, Tijms BM (2019) Modeling grey matter atrophy as a function of time, aging or cognitive decline show different anatomical patterns in Alzheimer's disease. Neuroimage Clin 22: 101786 · DOI
  16. Dong H, Li J, Huang L, Chen XI, Li D, Wang T, Hu C, Xu J, Zhang C, Zen KE et al (2015) Serum microRNA profiles serve as novel biomarkers for the diagnosis of Alzheimer's disease. Dis Markers 2015: 1–11
  17. Dong W, Wang R, Ma L‐N, Xu B‐L, Zhang J‐S, Zhao Z‐W, Wang Y‐L, Zhang XU (2016) Influence of age‐related learning and memory capacity of mice: different effects of a high and low caloric diet. Aging Clin Exp Res 28: 303–311 · DOI
  18. Dutta S, Sengupta P (2016) Men and mice: relating their ages. Life Sci 1: 244–248 · DOI · Paper page
  19. Duzel E, van Praag H, Sendtner M (2016) Can physical exercise in old age improve memory and hippocampal function? Brain 139: 662–673 · DOI · Paper page
  20. Editorial (2019) Delivering the promise of RNA therapeutics. Nat Med 25: 1321 · DOI
  21. Fischer A (2014b) Targeting histone‐modifications in Alzheimer's disease. What is the evidence that this is a promising therapeutic avenue? Neuropsychopharmacology 80: 95–012
  22. Fjell AM, McEvoy L, Holland D, Dale AM, Walhovd KB, AsDN I (2014) What is normal in normal aging? Effects of aging, amyloid and Alzheimer's disease on the cerebral cortex and the hippocampus. Rog Neurobiol 117: 20–40 · DOI · Paper page
  23. Franklin SB, Gibson JD, Robertson PA, Pohlmann JT, Fralish JS (1995) Parallel analysis: a method for determining significant principal components. J Veg Sci 1: 102–123
  24. Frimat M, Daroux M, Litke R, Nevière R, Tessier FJ, Boulanger E (2017) Kidney, heart and brain: three organs targeted by ageing and glycation. Clin Sci 131: 1069–1092 · DOI · Paper page
  25. Gurtan AM, Sharp PA (2013) The role of miRNAs in regulating gene expression networks. J Mol Biol 425: 3582–3600 · DOI
  26. Hanna J, Hossain GS, Kocerha J (2019) The potential for microRNA therapeutics and clinical research. Front Genet 16: 478 · DOI
  27. Hassenstab J, Monsell SE, Mock C, Roe CM, Cairns NJ, Morris JC, Kukull W (2015) Neuropsychological markers of cognitive decline in persons with Alzheimer disease neuropathology. J Neuropathol Exp Neurol 74: 1086–1092 · DOI
  28. Havas D, Hutter‐Paier B, Ubhi K, Rockenstein E, Crailsheim K, Masliah E, Windisch M (2011) A longitudinal study of behavioral deficits in an AβPP transgenic mouse model of Alzheimer's disease. J Alzheimers Dis 25: 231–243 · DOI
  29. Hayden KM, Jones RN, Zimmer C, Plassman BL, Browndyke JN, Pieper C, Warren LH, Welsh‐Bohmer KA (2011) Factor structure of the National Alzheimer's Coordinating Centers uniform dataset neuropsychological battery: an evaluation of invariance between and within groups over time. Alzheimer Dis Assoc Disord 25: 128–137 · DOI
  30. Hébert SS, Horré K, Nicolaï L, Papadopoulou AS, Mandemakers W, Silahtaroglu AN, Kauppinen S, Delacourte A, De Strooper B (2008) Loss of microRNA cluster miR‐29a/b‐1 in sporadic Alzheimer's disease correlates with increased BACE1/beta‐secretase expression. Proc Natl Acad Sci USA 205: 6415–6420 · DOI · Paper page
  31. Heras‐Sandoval D, Aliva‐Munoz E, Arias C (2011) The phosphatidylinositol 3‐Kinase/mTor pathway as a therapeutic target for brain aging and neurodegeneration. Pharmaceuticals 4: 1070–1087 · DOI
  32. Herrera‐Espejo S, Santos‐Zorrozua B, Álvarez‐González P, Lopez‐Lopez E, Garcia‐Orad Á (2019) A systematic review of microRNA expression as biomarker of late‐onset Alzheimer's disease. Mol Neurobiol 56: 8376–8391 · DOI · Paper page
  33. Hill JM, Lukiw WJ (2016) MicroRNA (miRNA)‐mediated pathogenetic signaling in Alzheimer's disease (AD). Neurochem Res 41: 95–100
  34. Huentelman MJ, Piras IS, Siniard AL, De Both MD, Richholt RF, Balak CD, Jamshidi P, Bigio EH, Weintraub S, Loyer ET et al (2018) Associations of MAP2K3 gene variants with superior memory in SuperAgers. Front Aging Neurosci 10: 155 · DOI
  35. Illouz T, Madar R, Louzon Y, Griffioen KJ, Okun E (2016) Unraveling cognitive traits using the Morris water maze unbiased strategy classification (MUST‐C) algorithm. Brain Behav Immun 52: 132–144 · DOI
  36. Jaber VR, Zhao Y, Sharfman NM, Li W, Lukiw WJ (2019) Addressing Alzheimer's disease (AD) neuropathology using anti‐microRNA (AM) strategies. Mol Neurobiol 56: 8101–8108 · DOI
  37. Jain G, Stuendl A, Rao P, Berulava T, Pena Centeno T, Kaurani L, Burkhardt S, Delalle I, Kornhuber J, Hüll M et al (2019) A combined miRNA‐piRNA signature to detect Alzheimer's disease. Transl Psychiat 9: 250 · DOI · Paper page
  38. Jessen F, Spottke A, Boecker H, Brosseron F, Buerger K, Catak C, Fliessbach K, Franke C, Fuentes M, Heneka MT et al (2018) Design and first baseline data of the DZNE multicenter observational study on predementia Alzheimer's disease (DELCODE). Alzheimers Res Ther 10: 15 · DOI
  39. Kayano M, Higaki S, Satoh JI, Matsumoto K, Matsubara E, Takikawa O, Niida S (2016) Plasma microRNA biomarker detection for mild cognitive impairment using differential correlation analysis. Biomarker Res 4: 22 · DOI
  40. Khanna A, Muthusamy S, Liang R, Sarojini H, Wang E (2011) Gain of survival signaling by down‐regulation of three key miRNAs in brain of calorie‐restricted mice. Aging 3: 223–236 · DOI
  41. Koopmans F, van Nierop P, Andres‐Alonso M, Byrnes A, Cijsouw T, Coba MP, Cornelisse LN, Farrell RJ, Goldschmidt HL, Howrigan DP et al (2019) SynGO: an evidence‐based, expert‐curated knowledge base for the synapse. Neuron 103: 217–234 · DOI · Paper page
  42. Kumar S, Vijayan M, Bhatti JS, Reddy PH (2017) MicroRNAs as peripheral biomarkers in aging and age‐related diseases. Prog Mol Biol Transl Sci 146: 47–94 · DOI
  43. Laczó J, Andel R, Nedelska Z, Vyhnalek M, Vlcek K, Crutch S, Harrison J, Hort J (2017) Exploring the contribution of spatial navigation to cognitive functioning in older adults. Neurobiol Aging 51: 67–70 · DOI
  44. Langfelder P, Horvath S (2008) WGCNA: an R package for weighted correlation network analysis. BMC Bioinformatics 29: eCollection 2018 · DOI · Paper page
  45. Lee JS, Park YH, Park S, Yoon U, Choe Y, Cheon BK, Hahn A, Cho SH, Kim SJ, Kim JP et al (2019) Distinct brain regions in physiological and pathological brain aging. Front Aging Neurosci 11: 147 · DOI
  46. Leidinger P, Backes C, Deutscher S, Schmitt K, Mueller SC, Frese K, Haas J, Ruprecht K, Paul F, Stähler C et al (2013) A blood based 12‐miRNA signature of Alzheimer disease patients. Genome Biol 14: R78 · DOI
  47. Lepko T, Pusch M, Müller T, Schulte D, Ehses J, Kiebler M, Hasler J, Huttner HB, Vandenbroucke RE, Vandendriessche C et al (2018) Choroid plexus‐derived miR‐204 regulates the number of quiescent neural stem cells in the adult brain. EMBO J 38: e100481
  48. Li D, Mielke MM (2019) An update on blood‐based markers of Alzheimer's disease using the SiMoA platform. Neurol Ther 8: 73–82 · DOI · Paper page
  49. Liang H, Huang L, Cao J, Zen KE, Chen XI, Zhang C‐Y (2012) Regulation of mammalian gene expression by exogenous microRNAs. Wiley Interdiscip Rev RNA 3: 733–742 · DOI
  50. Lindbergh CA, Casaletto KB, Staffaroni AM, Elahi F, Walters SM, You M, Neuhaus J, Rivera Contreras W, Wang P, Karydas A et al (2020) Systemic tumor necrosis factor‐alpha trajectories relate to brain health in typically aging older adults. J Gerontol A Biol Sci Med Sci 75: 1558–1565 · DOI
  51. Livak KJ, Schmittgen TD (2001) Analysis of relative gene expression data using real‐time quantitative PCR and the 2−ΔΔCT method. Methods 25: 402–408 · DOI · Paper page
  52. Love MI, Huber W, Anders S (2014) Moderated estimation of fold change and dispersion for RNA‐seq data with DESeq2. Genome Biol 15: 550 · DOI · Paper page
  53. Maffioletti E, Milanesi E, Ansari A, Zanetti O, Galluzzi S, Geroldi C, Gennarelli M, Bocchio‐Chiavetto L (2020) miR‐146a plasma levels are not altered in Alzheimer's disease but correlate with age and illness severity. Front Aging Neurosci 17: 366 · DOI
  54. Martinez‐Hernandez A, Urbanke H, Gillman AL, Lee J, Ryazanov S, Agbemenyah HY, Benito E, Jain G, Kaurani L, Grigorian G et al (2017) The diphenylpyrazole compound anle138b blocks Aβ channels and rescues disease phenotypes in a mouse model for amyloid pathology. EMBO Mol Med 10: 32–47 · DOI
  55. Maschmeyer P, Petkau G, Siracusa F, Zimmermann J, Zügel F, Kühl AA, Lehmann K, Schimmelpfennig S, Weber M, Haftmann C et al (2018) elective targeting of pro‐inflammatory Th1 cells by microRNA‐148a‐specific antagomirs in vivo. J Autoimmun 89: 41–52 · DOI
  56. Means LW, Higgins JL, Fernandez TJ (1993) Mid‐life onset of dietary restriction extends life and prolongs cognitive functioning. Physiol Behav 54: 503–508 · DOI
  57. Men Y, Yelick J, Jin S, Tian Y, Chiang MSR, Higashimori H, Brown E, Jarvis R, Yang Y (2019) Exosome reporter mice reveal the involvement of exosomes in mediating neuron to Astroglia communication in the CNS. Nat Commun 10: 4136 · DOI · Paper page
  58. Mitchell PS, Parkin RK, Kroh EM, Fritz BR, Wyman SK, Pogosova‐Agadjanyan EL, Peterson A, Noteboom J, O'Briant KC, Allen A et al (2008) Circulating microRNAs as stable blood‐based markers for cancer detection. Proc Natl Acad Sci USA 105: 0513–10518
  59. Mitjans M, Seidel J, Begemann M, Bockhop F, Moya‐Higueras J, Bansal V, Wesolowski J, Seelbach A, Ibáñez MI, Kovacevic F et al (2018) Violent aggression predicted by multiple pre‐adult environmental hits. Mol Psychiatry 24: 1549–1564 · DOI · Paper page
  60. Molinuevo JL, Ayton S, Batrla R, Bednar MM, Bittner T, Cummings J, Fagan AM, Hampel H, Mielke MM, Mikulskis A et al (2018) Current state of Alzheimer's fluid biomarkers. Acta Neuropathol 136: 821–853 · DOI · Paper page
  61. Moon JM, Xu L, Giffard RG (2013) Inhibition of microRNA‐181 reduces forebrain ischemia‐induced neuronal loss. J Cereb Blood Flow Metab 33: 1976–1982 · DOI
  62. Nagaraj S, Laskowska‐Kaszub K, Dębski KJ, Wojsiat J, Dąbrowski M, Gabryelewicz T, Kuźnicki J, Wojda U (2017) Profile of 6 microRNA in blood plasma distinguish early stage Alzheimer's disease patients from non‐demented subjects. Oncotarget 8: 16122–16143 · DOI
  63. Oh J, Lee YD, Wagers AJ (2014) Stem cell aging: mechanisms, regulators and therapeutic opportunities. Nat Med 20: 870–880 · DOI · Paper page
  64. Olsson B, Lautner R, Andreasson U, Öhrfelt A, Portelius E, Bjerke M, Hölttä M, Rosén C, Olsson C, Strobel G et al (2016) CSF and blood biomarkers for the diagnosis of Alzheimer's disease: a systematic review and meta‐analysis. Lancet Neurol 15: 673–684 · DOI · Paper page
  65. Ouyang YB, Lu Y, Yue S, Xu LJ, Xiong XX, White RE, Sun X, Giffard RG (2012) miR‐181 regulates GRP78 and influences outcome from cerebral ischemia in vitro and in vivo. Neurobiol Dis 45: 555–563 · DOI
  66. Park DC, Lautenschlager G, Hedden T, Davidson NS, Smith AD, Smith PK (2002) Models of visuospatial and verbal memory across the adult life span. Psychol Aging 17: 299–320 · DOI
  67. Ping L, Duong DM, Yin L, Gearing M, Lah JJ, Levey AI, Seyfried NT (2018) Global quantitative analysis of the human brain proteome in Alzheimer's and Parkinson's disease. Sci Data 5: 180036 · DOI · Paper page
  68. Plaisier SBTR, Wong JA, Graeber TG (2010) aRnk‐rank hypergeometric overlap: identification of statistically significant overlap between gene‐expression signatures. Nucleic Acids Res 38: e169 · DOI · Paper page
  69. Preische O, Schultz SA, Apel A, Kuhle J, Kaeser SA, Barro C, Gräber S, Kuder‐Buletta E, LaFougere C, Laske C et al (2019) Dominantly inherited Alzheimer network. Serum neurofilament dynamics predicts neurodegeneration and clinical progression in presymptomatic Alzheimer's disease. Nat Med 25: 277–283 · DOI · Paper page
  70. Rao MS, Van Vleet TR, Ciurlionis R, Buck WR, Mittelstadt SW, Blomme EAG, Liguori MJ (2019) Comparison of RNA‐Seq and microarray gene expression platforms for the toxicogenomic evaluation of liver from short‐term rat toxicity studies. Front Genet 9: 636 · DOI
  71. Rao P, Benito E, Fischer A (2013) MicroRNAs as biomarkers for CNS disease. Front Mol Neurosci 6: 39
  72. Rodriguez‐Ortiz CJ, Baglietto‐Vargas D, Martinez‐Coria H, LaFerla FM, Kitazawa M (2014) Upregulation of miR‐181 decreases c‐Fos and SIRT‐1 in the hippocampus of 3xTg‐AD mice. J Alzheimers Dis 42: 1229–1238 · DOI
  73. Roovers J, De Jonghe P, Weckhuysen S (2018) The therapeutic potential of RNA regulation in neurological disorders. Expert Opin Ther Target 22: 1017–1028 · DOI
  74. Roy B, Yoshino Y, Allen L, Prall K, Schell G, Dwivedi Y (2020) Exploiting circulating microRNAs as biomarkers in psychiatric disorders. Mol Diagn Ther 24: 279–298 · DOI
  75. Saba R, Sorensen DL, Booth SA (2014) MicroRNA‐146a: a dominant, negative regulator of the innate immune response. Front Immunol 21: eCollection 2014 · DOI · Paper page
  76. Saba R, Störchel PH, Aksoy‐Aksel A, Kepura F, Lippi G, Plant TD, Schratt GM (2012) Dopamine‐regulated microRNA MiR‐181a controls GluA2 surface expression in hippocampal neurons. Mol Cell Biol 32: 619–632 · DOI · Paper page
  77. Salta E, De Strooper B (2017) Noncoding RNAs in neurodegeneration. Nat Rev Neurosci 18: 627–640 · DOI · Paper page
  78. Salthouse TA (2009) When does age‐related cognitive decline begin? Neurobiol Aging 30: 507–514 · DOI · Paper page
  79. Sambandan S, Akbalik G, Kochen L, Rinne J, Kahlstatt J, Glock C, Tushev G, Alvarez‐Castelao B, Heckel A, Schuman EM (2017) Activity‐dependent spatially localized miRNA maturation in neuronal dendrites. Science 355: 634–637 · DOI
  80. Schaie KW (1993) The Seattle Longitudinal Study: a thirty‐five‐year inquiry of adult intellectual development. Z Gerontol 26: 129–137
  81. Schneider LS, Mangialasche F, Andreasen N, Feldman H, Giacobini E, Jones R, Mantua V, Mecocci P, Pani L, Winblad B et al (2014) Clinical trials and late‐stage drug development for Alzheimer's disease: an appraisal from 1984 to 2014. J Intern Med 275: 151–283
  82. Stepniak B, Kästner A, Poggi G, Mitjans M, Begemann M, Hartmann A, Van der Auwera S, Sananbenesi F, Krueger‐Burg D, Matuszko G et al (2015) Accumulated common variants in the broader fragile X gene family modulate autistic phenotypes. EMBO Mol Med 7: 1565–1579 · DOI
  83. Stilling RM, Benito E, Gertig M, Barth J, Capece V, Burkhardt S, Bonn S, Fischer A (2014) De‐regulation of gene expression and alternative splicing affects distinct cellular pathways in the aging hippocampus. Front Cell Neurosci 8: 373 · DOI
  84. Swarbrick S, Wragg N, Ghosh S, Stolzing A (2019) Systematic review of miRNA as biomarkers in Alzheimer's disease. Mol Neurobiol 56: 6156–6167 · DOI
  85. Vliegenthart ADB, Berends C, Potter CMJ, Kersaudy‐Kerhoas M, Dear JW (2017) MicroRNA‐122 can be measured in capillary blood which facilitates point‐of‐care testing for drug‐induced liver injury. Br J Clin Pharmacol 83: 2027–2033 · DOI
  86. Wang G, Huang Y, Wang L‐L, Zhang Y‐F, Xu J, Zhou YI, Lourenco GF, Zhang B, Wang Y, Ren R‐J et al (2016) MicroRNA‐146a suppresses ROCK1 allowing hyperphosphorylation of tau in Alzheimer's disease. Sci Rep 25: 26697 · DOI
  87. Witwer KW (2015) Circulating microRNA biomarker studies: pitfalls and potential solutions. Clin Chem 61: 56–63 · DOI · Paper page
  88. Wolf H, Grunwald M, Kruggel F, Riedel‐Heller SG, Angerhöfer S, Hojjatoleslami A, Hensel A, Arendt T, Gertz H (2001) Hippocampal volume discriminates between normal cognition; questionable and mild dementia in the elderly. Neurobiol Aging 22: 177–186 · DOI
  89. Xu LJ, Ouyang YB, Xiong X, Stary CM, Giffard RG (2015) Post‐stroke treatment with miR‐181 antagomir reduces injury and improves long‐term behavioral recovery in mice after focal cerebral ischemia. Exp Neurol 26: 1–7
  90. Zafeiriou MP, Bao G, Hudson J, Halder R, Blenkle A, Schreiber MK, Fischer A, Schild D, Zimmermann WH (2020) Developmental GABA polarity switch and neuronal plasticity in bioengineered neuronal organoids. Nat Commun 11: 3791 · DOI
  91. Zampetaki A, Willeit P, Drozdov I, Kiechl S, Mayr M (2012) Profiling of circulating microRNAs: from single biomarkers to re‐wired networks. Cardiovasc Res 93: 555–562 · DOI
  92. Zheng W, Yao L, Teng J, Yan C, Qin P, Liu G, Chen W (2018) Lateral flow test for visual detection of multiple microRNAs. Sens Actuators B Chem 1: 320–326 · DOI
  93. Zovoilis A, Agbemenyah HY, Agis‐Balboa RC, Stilling RM, Edbauer D, Rao P, Farinelli L, Delalle I, Schmitt A, Falkai P et al (2011) microRNA‐34c is a novel target to treat dementias. EMBO J 30: 4299–4308 · DOI · Paper page

Cited by

Sorted by citations

Metadata

Authors
Islam, M. R., Kaurani, L., Berulava, T., Heilbronner, U., Budde, M., Centeno, T. P., Elerdashvili, V., Zafieriou, M., Benito, E., Sertel, S. M., Goldberg, M., Senner, F., Kalman, J. L., Burkhardt, S., Oepen, A. S., Sakib, M. S., Kerimoglu, C., Wirths, O., Bickeböller, H., Bartels, C., Brosseron, F., Buerger, K., Cosma, N., Fliessbach, K., Heneka, M. T., Janowitz, D., Kilimann, I., Kleinedam, L., Laske, C., Metzger, C. D., Munk, M. H., Perneczky, R., Peters, O., Priller, J., Rauchmann, B. S., Roy, N., Schneider, A., Spottke, A., Spruth, E. J., Teipel, S., Tscheuschler, M., Wagner, M., Wiltfang, J., Düzel, E., Jessen, F., Delcode Study Group, Rizzoli, S. O., Zimmermann, W., Schulze, T. G., Falkai, P., Sananbenesi, F., & Fischer, A.
Venue
EMBO Molecular Medicine
Published
2021-10-11
Volume
13
Issue
11
ISSN
  • 1757-4676
  • 1757-4684
Cited by
74
References
26
Language
en
Funders
  • H2020 European Research Council (DEPICODE 648898)
  • Deutsche Forschungsgemeinschaft (SPP1738, SCHU1603/4‐1 5‐1 71, KFO241/PsyCourse FA241/16‐1, SA1005/2, EXC 2067/1 390729940, SFB1286, KFO241/PsyCourse,FI981‐4,11‐1, FI981‐4,15‐1)
  • Bundesministerium für Bildung und Forschung (Integrament,01ZX1314D, 01EE1404H, 01ZX1614K, ENERGI,01GQ1421A)
  • Common Fund (GMP LiPSC‐GR1.1)

About these checks

Registry, retraction, Cites and statistics results are computed, not judged, with one exception: a printed reference that no index lists is read once by a model before it counts as a citation error. Claims are extracted by a model and kept only when their quote appears verbatim in the text; each cited source is then checked, with a model’s help, for whether it says what the claim relies on. Those verdicts can be wrong — read the claim’s quote and the cited source before relying on one.

Statistics and arithmetic are recomputed, not judged.

Confidence bands are shown only for fields calibrated on our annotated test set. None is calibrated yet, so no band is shown.

What counts as a claim ›How we measure confidence ›How we check this ›

Are you an author, or do you see a problem with this page? Request a review