

Adipose Tissue Macrophages Function As Antigen-Presenting Cells and Regulate Adipose Tissue CD4+ T Cells in Mice
Open accessThe DOI matches its Crossref record; 48 of the 48 references it cites were found in a registry or an index.
Abstract
The proinflammatory activation of leukocytes in adipose tissue contributes to metabolic disease. How crosstalk between immune cells initiates and sustains adipose tissue inflammation remains an unresolved question. We have examined the hypothesis that adipose tissue macrophages (ATMs) interact with and regulate the function of T cells. Dietary obesity was shown to activate the proliferation of effector memory CD4+ T cells in adipose tissue. Our studies further demonstrate that ATMs are functional antigen-presenting cells that promote the proliferation of interferon-γ–producing CD4+ T cells in adipose tissue. ATMs from lean and obese visceral fat process and present major histocompatibility complex (MHC) class II–restricted antigens. ATMs were sufficient to promote proliferation and interferon-γ production from antigen-specific CD4+ T cells in vitro and in vivo. Diet-induced obesity increased the expression of MHC II and T-cell costimulatory molecules on ATMs in visceral fat, which correlated with an induction of T-cell proliferation in that depot. Collectively, these data indicate that ATMs provide a functional link between the innate and adaptive immune systems within visceral fat in mice.
Overview
The claims and statistics of this paper haven’t been checked yet.
Free: it reads the open-access text and checks the first 5 claims that cite a source we can check. Create a free account to check every claim.
Integrity signals
Registry
Cites
Statistics
Figures
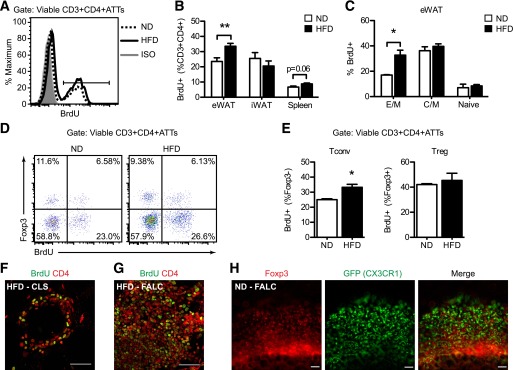

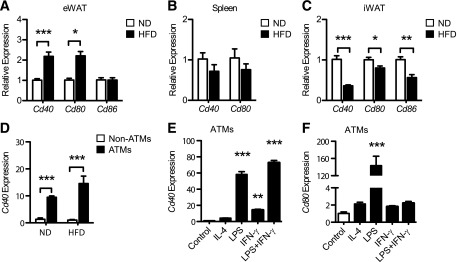

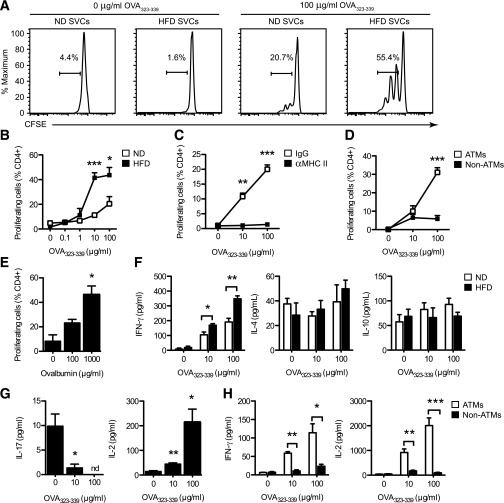

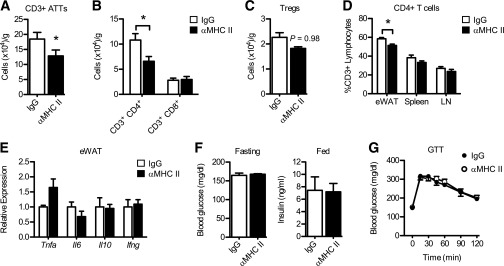
Verification
Claims the paper makes
The claims and statistics of this paper haven’t been checked yet.
Free: it reads the open-access text and checks the first 5 claims that cite a source we can check. Create a free account to check every claim.
Claims other papers make about this one
Each is checked against this paper’s own text: does it say what the citing paper says it does?
In the citing paper
“The infiltrated macrophages in muscle tissue present adipocyte-derived antigens and activate antigen-specific CD4+ T cells [39].”
From Sarcopenic obesity, insulin resistance, and their implications in cardiovascular and metabolic consequences (2020) · cites this paper as [39]
Self-check
Percentages, sums and reported differences re-computed from the paper’s own numbers.
The self-check needs the paper’s full text.
Citations
Cites
Obesity is associated with macrophage accumulation in adipose tissue
Weisberg, S. P., McCann, D., Desai, M., Rosenbaum, M., Leibel, R. L., & Ferrante, A. W. (2003) · Journal of Clinical Investigation · doi:10.1172/jci200319246 · Cited by 10,041 · cited 1×
“ATMs that co-express the dendritic cell (DC) marker CD11c and pro-inflammatory genes typical of ‘classically activated’ or M1 polarized macrophages (11-13).”
Xu, H., Barnes, G. T., Yang, Q., Tan, G., Yang, D., Chou, C. J., Sole, J., Nichols, A., Ross, J. S., Tartaglia, L. A., et al. (2003) · Journal of Clinical Investigation · doi:10.1172/jci200319451 · Cited by 6,760
Obesity induces a phenotypic switch in adipose tissue macrophage polarization
Lumeng, C. N., Bodzin, J. L., & Saltiel, A. R. (2007) · Journal of Clinical Investigation · doi:10.1172/jci29881 · Cited by 4,664 · cited 1×
“Current models suggest that obesity promotes metainflammation in part by altering the balance between type 2 and type 1 ATMs in visceral fat (13,18).”
BackgroundSelf-citationAdipokines in inflammation and metabolic disease
Ouchi, N., Parker, J. L., Lugus, J. J., & Walsh, K. (2011) · Nature Reviews Immunology · doi:10.1038/nri2921 · Cited by 4,625 · cited 2×
“Classically, APCs (specifically macrophages and dendritic cells (DCs)) shape CD4 + T cell activation by three signals: (1) presentation of peptide antigens on Major histocompatibility complex (MHC) Class II molecules (signal 1), (2) expression of T cell costimulatory molecules (e.”
Inflammation, stress, and diabetes
Wellen, K. E., & Hotamisligil, G. S. (2005) · Journal of Clinical Investigation · doi:10.1172/jci25102 · Cited by 4,143
Cinti, S., Mitchell, G., Barbatelli, G., Murano, I., Ceresi, E., Faloia, E., Wang, S., Fortier, M., Greenberg, A. S., & Obin, M. S. (2005) · Journal of Lipid Research · doi:10.1194/jlr.m500294-jlr200 · Cited by 2,529 · cited 1×
“M1 ATMs form multicellular lipidladen clusters, known as crown-like structures (CLS), around dead adipocytes in obese fat (6,14,15) and produce inflammatory cytokines (e.”
BackgroundInflammatory links between obesity and metabolic disease
Lumeng, C. N., & Saltiel, A. R. (2011) · Journal of Clinical Investigation · doi:10.1172/jci57132 · Cited by 2,319 · cited 1×
“Accumulation of activated leukocytes in metabolic tissues is a driving force for obesity-associated metabolic inflammation (metainflammation) and insulin resistance (3,4).”
BackgroundSelf-citationNishimura, S., Manabe, I., Nagasaki, M., Eto, K., Yamashita, H., Ohsugi, M., Otsu, M., Hara, K., Ueki, K., Sugiura, S., et al. (2009) · Nature Medicine · doi:10.1038/nm.1964 · Cited by 2,230 · cited 1×
“In contrast, T helper 1 (Th1) CD4 T cells and CD8 adipose tissue T cells (ATTs) accumulate in fat during obesity, promoting IFN-g and TNF-a production and insulin resistance (20,21,27).”
Feuerer, M., Herrero, L., Cipolletta, D., Naaz, A., Wong, J., Nayer, A., Lee, J., Goldfine, A. B., Benoist, C., Shoelson, S., et al. (2009) · Nature Medicine · doi:10.1038/nm.2002 · Cited by 2,145
Macrophage-specific PPARγ controls alternative activation and improves insulin resistance
Odegaard, J. I., Ricardo-Gonzalez, R. R., Goforth, M. H., Morel, C. R., Subramanian, V., Mukundan, L., Eagle, A. R., Vats, D., Brombacher, F., Ferrante, A. W., et al. (2007) · Nature · doi:10.1038/nature05894 · Cited by 2,107 · cited 1×
“Disruption of macrophage M2 polarization increases the susceptibility to high fat diet (HFD)-induced insulin resistance (8-10).”
Innate production of TH2 cytokines by adipose tissue-associated c-Kit+Sca-1+ lymphoid cells
Moro, K., Yamada, T., Tanabe, M., Takeuchi, T., Ikawa, T., Kawamoto, H., Furusawa, J.-I., Ohtani, M., Fujii, H., & Koyasu, S. (2010) · Nature · doi:10.1038/nature08636 · Cited by 1,992 · cited 1×
“These structures resembled “fat associated lymphoid clusters” (FALCs) or milky spots in mesenteric and omental fat depots that contain macrophages and lymphoid cells (42; 43).”
Normalization of obesity-associated insulin resistance through immunotherapy
Winer, S., Chan, Y., Paltser, G., Truong, D., Tsui, H., Bahrami, J., Dorfman, R., Wang, Y., Zielenski, J., Mastronardi, F., et al. (2009) · Nature Medicine · doi:10.1038/nm.2001 · Cited by 1,370 · cited 5×
“In this manuscript, we have chosen to focus on MHC Class II restricted CD4 + T cell activation based on the current evidence that CD4 + T cells have a restricted T cell receptor repertoire (19; 21; 28).”
InfluentialMacrophage-mediated inflammation in metabolic disease
Chawla, A., Nguyen, K. D., & Goh, Y. P. S. (2011) · Nature reviews. Immunology · doi:10.1038/nri3071 · Cited by 1,314 · cited 1×
“Current models suggest that obesity promotes metainflammation in part by altering the balance between type 2 and type 1 ATMs in visceral fat (13,18).”
BackgroundTumor necrosis factor alpha inhibits signaling from the insulin receptor.
Hotamisligil, G. S., Murray, D. L., Choy, L. N., & Spiegelman, B. M. (1994) · Proceedings of the National Academy of Sciences · doi:10.1073/pnas.91.11.4854 · Cited by 1,199 · cited 1×
“, interleukin [IL]-1b, IL-6, and tumor necrosis factor-a [TNF-a]) that can impair insulin action in adipocytes (16,17).”
BackgroundDendritic cells in a mature age
Reis e Sousa, C. (2006) · Nature Reviews Immunology · doi:10.1038/nri1845 · Cited by 1,195
Rotter, V., Nagaev, I., & Smith, U. (2003) · Journal of Biological Chemistry · doi:10.1074/jbc.m301977200 · Cited by 1,062 · cited 1×
“IL-1β, IL-6 and TNF-α) that can impair insulin action in adipocytes (16; 17).”
Winer, D. A., Winer, S., Shen, L., Wadia, P. P., Yantha, J., Paltser, G., Tsui, H., Wu, P., Davidson, M. G., Alonso, M. N., et al. (2011) · Nature Medicine · doi:10.1038/nm.2353 · Cited by 1,050 · cited 3×
“5 The APCs that interact with ATTs in fat have not been well characterized, but could include ATMs, adipose tissue DCs, adipose tissue B cells, mast cells, and neutrophils (24; 30-34).”
Lumeng, C. N., DeYoung, S. M., Bodzin, J. L., & Saltiel, A. R. (2007) · Diabetes · doi:10.2337/db06-1076 · Cited by 1,016 · cited 3×
“Resident (Type 2) ATMs are distributed between adipocytes in healthy adipose tissue throughout development, express anti-inflammatory markers typical of “alternatively activated” or M2 polarized macrophages, and promote tissue homeostasis (6; 7).”
InfluentialSelf-citationAdipocyte Death, Adipose Tissue Remodeling, and Obesity Complications
Strissel, K. J., Stancheva, Z., Miyoshi, H., Perfield, J. W., DeFuria, J., Jick, Z., Greenberg, A. S., & Obin, M. S. (2007) · Diabetes · doi:10.2337/db07-0767 · Cited by 1,007 · cited 1×
“M1 ATMs form multicellular lipidladen clusters, known as crown-like structures (CLS), around dead adipocytes in obese fat (6,14,15) and produce inflammatory cytokines (e.”
BackgroundNeutrophils mediate insulin resistance in mice fed a high-fat diet through secreted elastase
Talukdar, S., Oh, D. Y., Bandyopadhyay, G., Li, D., Xu, J., McNelis, J., Lu, M., Li, P., Yan, Q., Zhu, Y., et al. (2012) · Nature Medicine · doi:10.1038/nm.2885 · Cited by 960
Lumeng, C. N., DelProposto, J. B., Westcott, D. J., & Saltiel, A. R. (2008) · Diabetes · doi:10.2337/db08-0872 · Cited by 917 · cited 1×
“Fat samples and cultured cells were prepared for immunofluorescence microscopy as described (6,39).”
MethodSelf-citationAlternative M2 Activation of Kupffer Cells by PPARδ Ameliorates Obesity-Induced Insulin Resistance
Odegaard, J. I., Ricardo-Gonzalez, R. R., Red Eagle, A., Vats, D., Morel, C. R., Goforth, M. H., Subramanian, V., Mukundan, L., Ferrante, A. W., & Chawla, A. (2008) · Cell Metabolism · doi:10.1016/j.cmet.2008.04.003 · Cited by 847 · cited 1×
“Disruption of macrophage M2 polarization increases the susceptibility to high fat diet (HFD)-induced insulin resistance (8-10).”
Kang, K., Reilly, S. M., Karabacak, V., Gangl, M. R., Fitzgerald, K., Hatano, B., & Lee, C.-H. (2008) · Cell Metabolism · doi:10.1016/j.cmet.2008.04.002 · Cited by 699 · cited 1×
“Disruption of macrophage M2 polarization increases the susceptibility to high fat diet (HFD)-induced insulin resistance (8-10).”
Innate and acquired immunity in atherogenesis
Binder, C. J., Chang, M.-K., Shaw, P. X., Miller, Y. I., Hartvigsen, K., Dewan, A., & Witztum, J. L. (2002) · Nature Medicine · doi:10.1038/nm1102-1218 · Cited by 642 · cited 1×
“These challenges also exist in the atherosclerosis field, where T cells have been implicated for over a decade, but only a few causal antigens have been identified (48).”
BackgroundQuah, B. J. C., Warren, H. S., & Parish, C. R. (2007) · Nature Protocols · doi:10.1038/nprot.2007.296 · Cited by 624 · cited 1×
“dilution was examined in viable (Live/DeadViolet ) CD3 + CD4 + lymphocytes (41).”
Zeyda, M., Farmer, D., Todoric, J., Aszmann, O., Speiser, M., Györi, G., Zlabinger, G. J., & Stulnig, T. M. (2007) · International Journal of Obesity · doi:10.1038/sj.ijo.0803632 · Cited by 558
Unravelling mononuclear phagocyte heterogeneity
Geissmann, F., Gordon, S., Hume, D. A., Mowat, A. M., & Randolph, G. J. (2010) · Nature Reviews Immunology · doi:10.1038/nri2784 · Cited by 529 · cited 1×
“The difficulty in distinguishing between tissue macrophages and DCs is not new to the immunology field and many have questioned if a distinction between tissue macrophages and DCs is appropriate (44).”
Neutrophils transiently infiltrate intra-abdominal fat early in the course of high-fat feeding
Elgazar-Carmon, V., Rudich, A., Hadad, N., & Levy, R. (2008) · Journal of Lipid Research · doi:10.1194/jlr.m800132-jlr200 · Cited by 487
Yang, H., Youm, Y.-H., Vandanmagsar, B., Ravussin, A., Gimble, J. M., Greenway, F., Stephens, J. M., Mynatt, R. L., & Dixit, V. D. (2010) · The Journal of Immunology · doi:10.4049/jimmunol.1000021 · Cited by 440 · cited 5×
“CD4 ATTs have an activated phenotype in obesity (19,21,28), but direct evidence of T-cell proliferation in fat is lacking.”
BackgroundMethodResultInfluentialEndoplasmic Reticulum Stress and Inflammation in Obesity and Diabetes
Hummasti, S., & Hotamisligil, G. S. (2010) · Circulation Research · doi:10.1161/circresaha.110.225698 · Cited by 436
Bertola, A., Ciucci, T., Rousseau, D., Bourlier, V., Duffaut, C., Bonnafous, S., Blin-Wakkach, C., Anty, R., Iannelli, A., Gugenheim, J., et al. (2012) · Diabetes · doi:10.2337/db11-1274 · Cited by 399 · cited 1×
“5 The APCs that interact with ATTs in fat have not been well characterized, but could include ATMs, adipose tissue DCs, adipose tissue B cells, mast cells, and neutrophils (24; 30-34).”
Lumeng, C. N., Liu, J., Geletka, L., Delaney, C., Delproposto, J., Desai, A., Oatmen, K., Martinez-Santibanez, G., Julius, A., Garg, S., et al. (2011) · The Journal of Immunology · doi:10.4049/jimmunol.1102188 · Cited by 328 · cited 1×
“In contrast, T helper 1 (Th1) CD4 T cells and CD8 adipose tissue T cells (ATTs) accumulate in fat during obesity, promoting IFN-g and TNF-a production and insulin resistance (20,21,27).”
Self-citationIlan, Y., Maron, R., Tukpah, A.-M., Maioli, T. U., Murugaiyan, G., Yang, K., Wu, H. Y., & Weiner, H. L. (2010) · Proceedings of the National Academy of Sciences · doi:10.1073/pnas.0908771107 · Cited by 327 · cited 1×
“Treg content in visceral fat is inversely correlated with measures of insulin resistance and inflammation (19,25,26), suggesting that Tregs are antiinflammatory.”
BackgroundDeiuliis, J., Shah, Z., Shah, N., Needleman, B., Mikami, D., Narula, V., Perry, K., Hazey, J., Kampfrath, T., Kollengode, M., et al. (2011) · PLoS ONE · doi:10.1371/journal.pone.0016376 · Cited by 314 · cited 1×
“Treg content in visceral fat is inversely correlated with measures of insulin resistance and inflammation (19,25,26), suggesting that Tregs are antiinflammatory.”
BackgroundSelf-citationRangel-Moreno, J., Moyron-Quiroz, J. E., Carragher, D. M., Kusser, K., Hartson, L., Moquin, A., & Randall, T. D. (2009) · Immunity · doi:10.1016/j.immuni.2009.03.014 · Cited by 277 · cited 1×
“These structures resembled FALCs or milky spots in mesenteric and omental fat depots that contain macrophages and lymphoid cells (42,43).”
BackgroundAdipose tissue macrophages: phenotypic plasticity and diversity in lean and obese states
Morris, D. L., Singer, K., & Lumeng, C. N. (2011) · Current Opinion in Clinical Nutrition and Metabolic Care · doi:10.1097/mco.0b013e328347970b · Cited by 260 · cited 1×
“In humans and rodent models, F4/80 + adipose tissue macrophages (ATMs) are the predominant leukocyte found in metabolically healthy and insulin resistant fat (5).”
Self-citationStefanovic-Racic, M., Yang, X., Turner, M. S., Mantell, B. S., Stolz, D. B., Sumpter, T. L., Sipula, I. J., Dedousis, N., Scott, D. K., Morel, P. A., et al. (2012) · Diabetes · doi:10.2337/db11-1523 · Cited by 228
Ohmura, K., Ishimori, N., Ohmura, Y., Tokuhara, S., Nozawa, A., Horii, S., Andoh, Y., Fujii, S., Iwabuchi, K., Onoé, K., et al. (2010) · Arteriosclerosis, Thrombosis, and Vascular Biology · doi:10.1161/atvbaha.109.198614 · Cited by 215 · cited 1×
“natural killer T cells (NKT), conventional CD4 + T cells (Tconv), regulatory CD4 + T cells (Tregs), cytotoxic CD8 + T cells, and B cells) that are also regulated by metabolic status (19-24).”
Daro, E., Pulendran, B., Brasel, K., Teepe, M., Pettit, D., Lynch, D. H., Vremec, D., Robb, L., Shortman, K., McKenna, H. J., et al. (2000) · The Journal of Immunology · doi:10.4049/jimmunol.165.1.49 · Cited by 212
Altintas, M. M., Azad, A., Nayer, B., Contreras, G., Zaias, J., Faul, C., Reiser, J., & Nayer, A. (2011) · Journal of Lipid Research · doi:10.1194/jlr.m011338 · Cited by 198
Zeyda, M., Huber, J., Prager, G., & Stulnig, T. M. (2011) · Obesity · doi:10.1038/oby.2010.123 · Cited by 143 · cited 1×
“natural killer T cells (NKT), conventional CD4 + T cells (Tconv), regulatory CD4 + T cells (Tregs), cytotoxic CD8 + T cells, and B cells) that are also regulated by metabolic status (19-24).”
CD11c Expression in Adipose Tissue and Blood and Its Role in Diet-Induced Obesity
Wu, H., Perrard, X. D., Wang, Q., Perrard, J. L., Polsani, V. R., Jones, P. H., Smith, C. W., & Ballantyne, C. M. (2010) · Arteriosclerosis, Thrombosis, and Vascular Biology · doi:10.1161/atvbaha.109.198044 · Cited by 138 · cited 1×
“Since ATMs are the predominant leukocyte population in lean and obese fat, and because ATMs from obese mice and humans express MHC class II molecules (35-37),, we tested the hypothesis that ATMs (CD11b + F4/80 + ) are capable of functioning as APCs to regulate CD4 + ATT activation and proliferation.”
Westcott, D. J., DelProposto, J. B., Geletka, L. M., Wang, T., Singer, K., Saltiel, A. R., & Lumeng, C. N. (2009) · Journal of Experimental Medicine · doi:10.1084/jem.20091333 · Cited by 115 · cited 1×
“Resident (type 2) ATMs are distributed between adipocytes in healthy adipose tissue throughout development, express anti-inflammatory markers typical of “alternatively activated” or M2 polarized macrophages, and promote tissue homeostasis (6,7).”
BackgroundSelf-citationBassaganya-Riera, J., Misyak, S., Guri, A. J., & Hontecillas, R. (2009) · Cellular Immunology · doi:10.1016/j.cellimm.2009.04.003 · Cited by 100 · cited 1×
“Since ATMs are the predominant leukocyte population in lean and obese fat, and because ATMs from obese mice and humans express MHC class II molecules (35-37),, we tested the hypothesis that ATMs (CD11b + F4/80 + ) are capable of functioning as APCs to regulate CD4 + ATT activation and proliferation.”
Morris, D. L., Oatmen, K. E., Wang, T., DelProposto, J. L., & Lumeng, C. N. (2012) · Obesity · doi:10.1038/oby.2012.7 · Cited by 66 · cited 3×
“Cells were stained for flow cytometry as described (38).”
BackgroundMethodInfluentialSelf-citationTanaka, Y., Taneichi, M., Kasai, M., Kakiuchi, T., & Uchida, T. (2010) · PLoS ONE · doi:10.1371/journal.pone.0015225 · Cited by 56
Sultan, A., Strodthoff, D., Robertson, A.-K., Paulsson-Berne, G., Fauconnier, J., Parini, P., Rydén, M., Thierry-Mieg, N., Johansson, M. E., Chibalin, A. V., et al. (2009) · Circulation Research · doi:10.1161/circresaha.108.190280 · Cited by 50
Wolf, D., Jehle, F., Rodríguez, A. O., Dufner, B., Hoppe, N., Colberg, C., Lozhkin, A. P., Bassler, N., Rupprecht, B., Wiedemann, A., et al. (2012) · PLoS ONE · doi:10.1371/journal.pone.0033026 · Cited by 45 · cited 1×
“Mice deficient for CD40 L demonstrated a significant decrease in ATTs, without any improvement in metabolic measures with obesity (47).”
Background
Cited by
What we talk about when we talk about fat
Rosen, E. D., & Spiegelman, B. M. (2014) · Cell · doi:10.1016/j.cell.2013.12.012 · Cited by 2,373
“, 2013), though others suggest that adipose tissuemacrophages are the relevant APCs (Morris et al., 2013).”
Metabolic Inflammation and Insulin Resistance in Obesity
Wu, H., & Ballantyne, C. M. (2020) · Circulation Research · doi:10.1161/circresaha.119.315896 · Cited by 1,059
Kalinkovich, A., & Livshits, G. (2017) · Ageing Research Reviews · doi:10.1016/j.arr.2016.09.008 · Cited by 882
Wu, T.-R., Lin, C.-S., Chang, C.-J., Lin, T.-L., Martel, J., Ko, Y.-F., Ojcius, D. M., Lu, C.-C., Young, J. D., & Lai, H.-C. (2019) · Gut · doi:10.1136/gutjnl-2017-315458 · Cited by 758
Macrophages, Immunity, and Metabolic Disease
McNelis, J. C., & Olefsky, J. M. (2014) · Immunity · doi:10.1016/j.immuni.2014.05.010 · Cited by 720
“stimulate T cells was greater when theywere isolated fromobese compared to lean mice, possibly because of the higher amount of MHCII expression by these cells (Deng et al., 2013; Morris et al., 2013).”
BackgroundInfluential
Metadata
- Authors
- Morris, D. L., Cho, K. W., DelProposto, J. L., Oatmen, K. E., Geletka, L. M., Martinez-Santibanez, G., Singer, K., & Lumeng, C. N.
- Affiliations
- Michigan Medicine (US)
- University of Michigan (US)
- Cellular and Molecular Biology Graduate Program, University of Michigan Medical School, Ann Arbor, Michigan
- Corresponding author
- Lumeng, Carey N.
- Venue
- Diabetes
- Publisher
- American Diabetes Association
- Published
- 2013-07-17
- Volume
- 62
- Issue
- 8
- Pages
- 2762-2772
- ISSN
- 0012-1797 (ISSN-L)
- 1939-327X
- PMC
- PMC3717880
- OpenAlex
- W2130657795
- Cited by
- 217
- References
- 48
- Citations by year
- 2026: 6 · 2025: 8 · 2024: 6 · 2023: 13 · 2022: 17 · 2021: 11 · 2020: 23 · 2019: 17 · 2018: 20 · 2017: 18 · 2016: 20 · 2015: 24 · 2014: 21 · 2013: 13
- FWCI
- 18.98
- Type
- journal article
- Language
- en
- Open access
- hybrid
- doi.org
- Licence
- Locations
- Diabetes (publishedVersion, cc-by-nc-nd)
- PubMed Central (publishedVersion, cc-by-nc-nd)
- PubMed (publishedVersion)
- Funders
- National Institute of General Medical Sciences (T32GM007315, T32GM008322)
- National Institute of Diabetes and Digestive and Kidney Diseases (DK-078851, DK-087999, P60DK020572, R21DK092873, F32DK091976, DK089503, R01DK090262, DK-091976, DK092873, DK090262, K08DK078851, R03DK087999, P30DK020572, P30DK089503)
- Eunice Kennedy Shriver National Institute of Child Health and Human Development (F32HD008513, T32-HD-008513, K12HD028820)
- Topics
- Health Sciences › Medicine › Endocrinology, Diabetes and Metabolism › Adipokines, Inflammation, and Metabolic Diseases
- Health Sciences › Medicine › Physiology (medical) › Adipose Tissue and Metabolism
- Health Sciences › Medicine › Cardiology and Cardiovascular Medicine › Cardiovascular Disease and Adiposity
- Keywords
- adipose tissue macrophages, antigen presentation, CD4+ T cells, diet-induced obesity, visceral fat, interferon-gamma, MHC class II, T cell costimulatory molecules, T cell proliferation, adipose tissue inflammation, innate-adaptive immune crosstalk, metabolic disorders
- MeSH terms
- Adipose Tissue, Animals, Antigen-Presenting Cells, Diet, Glucose Tolerance Test, Inflammation, Insulin, Insulin Resistance, Lymphocyte Activation, Macrophages, Obesity, Phagocytosis, CD4-Positive T-Lymphocytes, Mice
About these checks
Registry, retraction, Cites and statistics results are computed, not judged, with one exception: a printed reference that no index lists is read once by a model before it counts as a citation error. Claims are extracted by a model and kept only when their quote appears verbatim in the text; each cited source is then checked, with a model’s help, for whether it says what the claim relies on. Those verdicts can be wrong — read the claim’s quote and the cited source before relying on one.
Statistics and arithmetic are recomputed, not judged.
Confidence bands are shown only for fields calibrated on our annotated test set. None is calibrated yet, so no band is shown.
What counts as a claim ›How we measure confidence ›How we check this ›
Are you an author, or do you see a problem with this page? Request a review
Data sources
Bibliographic data: Semantic Scholar, OpenAlex, Crossref.
Contains information from the Semantic Scholar Academic Graph Datasets, made available under the ODC Attribution License (ODC-BY 1.0).
Semantic Scholar’s data is described in: Kinney, R., et al. (2023). The Semantic Scholar Open Data Platform. arXiv:2301.10140.
