

The DOI matches its Crossref record; 49 of the 49 references it cites were found in a registry or an index.
Erythrocyte survival is controlled by microRNA-142
Abstract
Hematopoietic-specific microRNA-142 is a critical regulator of various blood cell lineages, but its role in erythrocytes is unexplored. Herein, we characterize the impact of microRNA-142 on erythrocyte physiology and molecular cell biology, using a mouse loss-of-function allele. We report that microRNA-142 is required for maintaining the typical erythrocyte biconcave shape and structural resilience, for the normal metabolism of reactive oxygen species, and for overall lifespan. microRNA-142 further controls ACTIN filament homeostasis and membrane skeleton organization. The analyses presented reveal previously unappreciated functions of microRNA-142 and contribute to an emerging view of small RNAs as key players in erythropoiesis. Finally, the work herein demonstrates how a housekeeping network of cytoskeletal regulators can be reshaped by a single micro-RNA denominator in a cell type specific manner.
Overview
The claims and statistics of this paper haven’t been checked yet.
Run the check — free, no account needed. It reads the open-access text and checks the sources it cites.
Integrity signals
Registry
Cites
Statistics
Figures
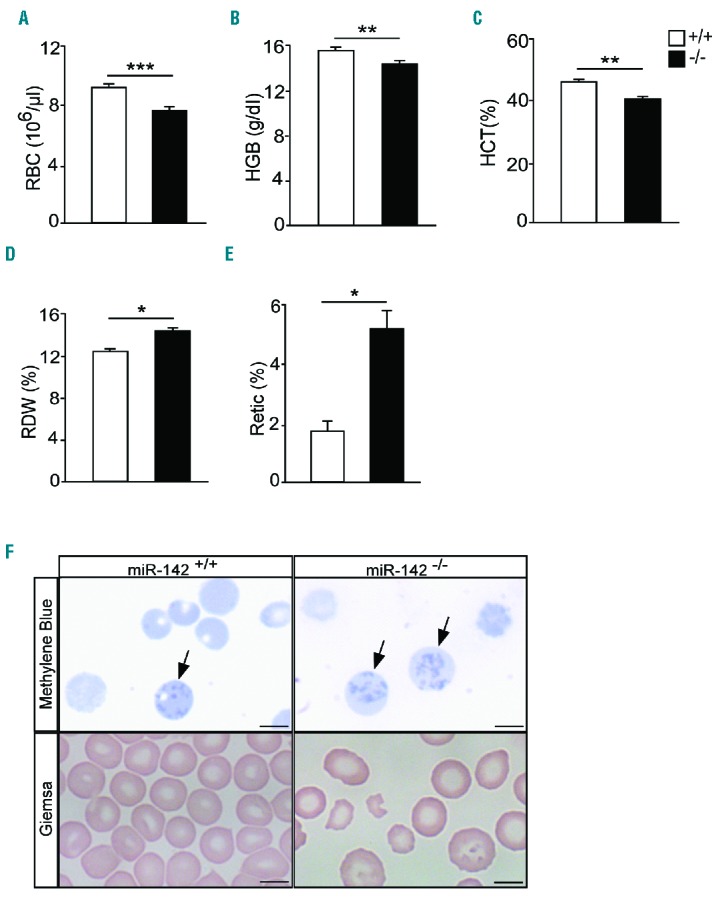
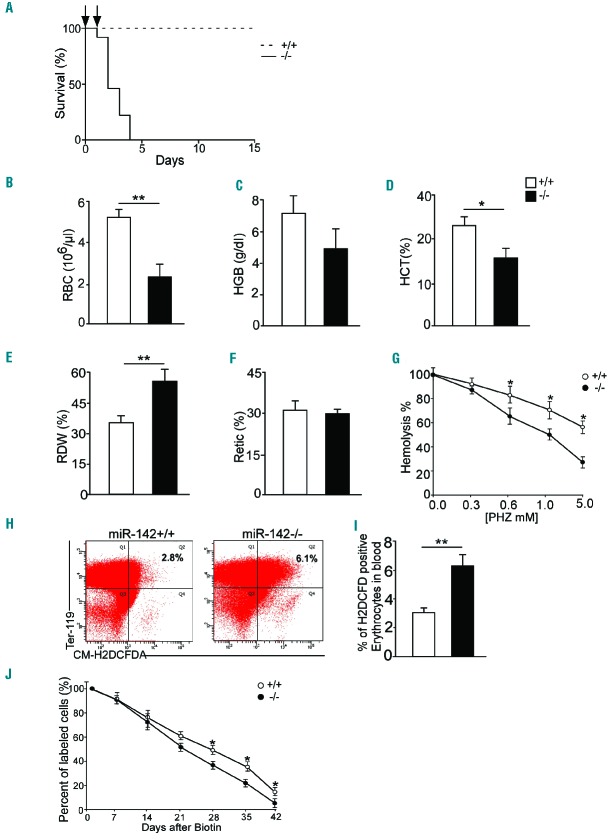
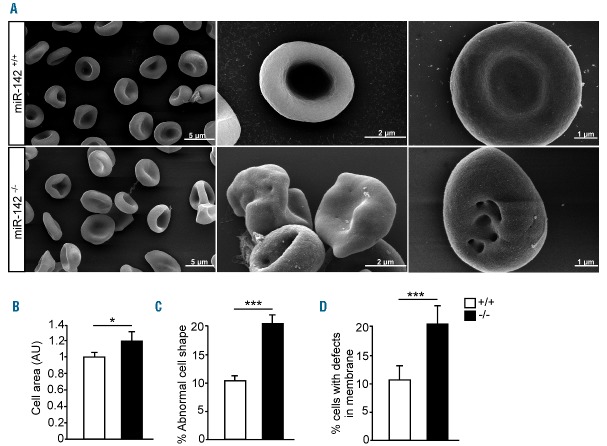
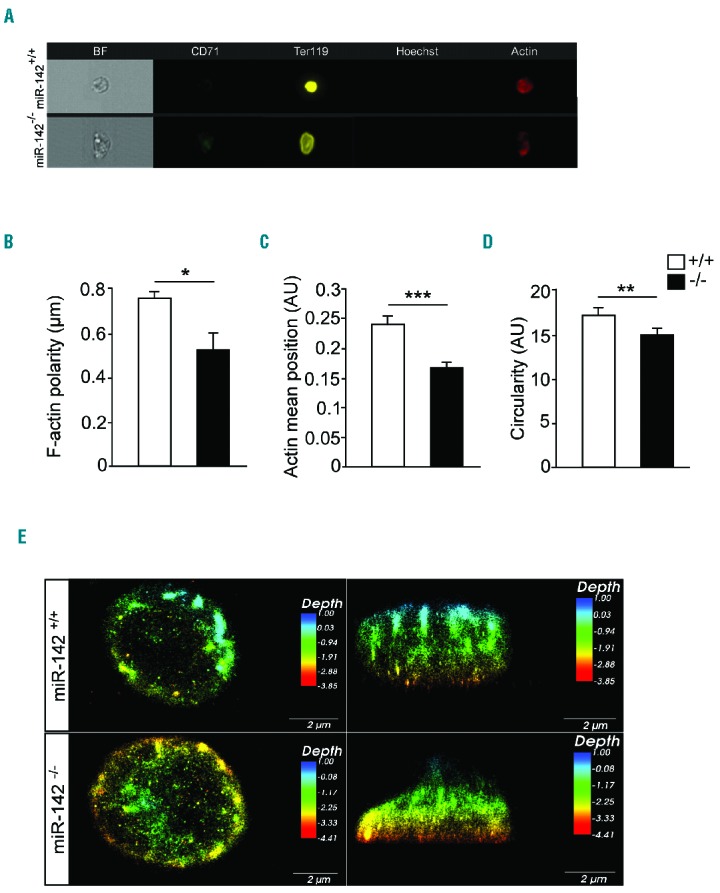
Verification
Claims the paper makes
The claims and statistics of this paper haven’t been checked yet.
Run the check — free, no account needed. It reads the open-access text and checks the sources it cites.
Claims other papers make about this one
Each is checked against this paper’s own text: does it say what the citing paper says it does?
In the citing paper
“miR-142 has been shown to regulate RBC survival in vivo”
From Red Blood Cells as Potential Repositories of MicroRNAs in the Circulatory System (2020) · cites this paper as Rivkin et al., 2017
Self-check
Percentages, sums and reported differences re-computed from the paper’s own numbers.
The self-check needs the paper’s full text.
Citations
Cites
MicroRNAs Modulate Hematopoietic Lineage Differentiation
Chen, C.-Z., Li, L., Lodish, H. F., & Bartel, D. P. (2004) · Science · doi:10.1126/science.1091903 · Cited by 3,257
Human chronic myelogenous leukemia cell-line with positive Philadelphia chromosome
Lozzio, C., & Lozzio, B. (1975) · Blood · doi:10.1182/blood.v45.3.321.321 · Cited by 2,995
A dicer-independent miRNA biogenesis pathway that requires Ago catalysis
Cheloufi, S., Dos Santos, C. O., Chong, M. M. W., & Hannon, G. J. (2010) · Nature · doi:10.1038/nature09092 · Cited by 1,149
Interaction of cytoskeletal proteins on the human erythrocyte membrane
Branton, D. (1981) · Cell · doi:10.1016/0092-8674(81)90497-9 · Cited by 601
Red blood cell oxidative stress impairs oxygen delivery and induces red blood cell aging
Mohanty, J. G., Nagababu, E., & Rifkind, J. M. (2014) · Frontiers in Physiology · doi:10.3389/fphys.2014.00084 · Cited by 595 · cited 1×
“Accordingly, oxidative damage inflicts cytoskeletal reorganization and shortens erythrocyte life span, which is ~40 days in Mus musculus, when adequate antioxidant response is manifested.(19) miRNAs, and the effector protein cofactor ARGONAUTE,(20) play important roles in erythropoiesis.”
BackgroundCanalization of development by microRNAs
Hornstein, E., & Shomron, N. (2006) · Nature Genetics · doi:10.1038/ng1803 · Cited by 578
Self-citationMohandas, N., & Evans, E. (1994) · Annual Review of Biophysics and Biomolecular Structure · doi:10.1146/annurev.bb.23.060194.004035 · Cited by 560
K562 human leukaemic cells synthesise embryonic haemoglobin in response to haemin
RUTHERFORD, T. R., CLEGG, J. B., & WEATHERALL, D. J. (1979) · Nature · doi:10.1038/280164a0 · Cited by 519
Free radical metabolism in human erythrocytes
Çimen, M. Y. B. (2008) · Clinica Chimica Acta · doi:10.1016/j.cca.2007.12.025 · Cited by 509
Visualization of the protein associations in the erythrocyte membrane skeleton.
Byers, T. J., & Branton, D. (1985) · Proceedings of the National Academy of Sciences · doi:10.1073/pnas.82.18.6153 · Cited by 395
Analysis of factors regulating erythrocyte deformability.
Mohandas, N., Clark, M. R., Jacobs, M. S., & Shohet, S. B. (1980) · Journal of Clinical Investigation · doi:10.1172/jci109888 · Cited by 384
A GATA-1-regulated microRNA locus essential for erythropoiesis
Dore, L. C., Amigo, J. D., dos Santos, C. O., Zhang, Z., Gai, X., Tobias, J. W., Yu, D., Klein, A. M., Dorman, C., Wu, W., et al. (2008) · Proceedings of the National Academy of Sciences · doi:10.1073/pnas.0712312105 · Cited by 347
A Slicer-independent role for Argonaute 2 in hematopoiesis and the microRNA pathway
O’Carroll, D., Mecklenbrauker, I., Das, P. P., Santana, A., Koenig, U., Enright, A. J., Miska, E. A., & Tarakhovsky, A. (2007) · Genes & Development · doi:10.1101/gad.1565607 · Cited by 343
Disorders of red cell membrane
An, X., & Mohandas, N. (2008) · British Journal of Haematology · doi:10.1111/j.1365-2141.2008.07091.x · Cited by 338
The miR-144/451 locus is required for erythroid homeostasis
Rasmussen, K. D., Simmini, S., Abreu-Goodger, C., Bartonicek, N., Di Giacomo, M., Bilbao-Cortes, D., Horos, R., Von Lindern, M., Enright, A. J., & O’Carroll, D. (2010) · Journal of Experimental Medicine · doi:10.1084/jem.20100458 · Cited by 330
The Role of Oxidative Stress in Hemolytic Anemia
Fibach, E., & Rachmilewitz, E. (2008) · Current Molecular Medicine · doi:10.2174/156652408786241384 · Cited by 299
The glucocorticoid receptor is required for stress erythropoiesis
Bauer, A., Tronche, F., Wessely, O., Kellendonk, C., Reichardt, H. M., Steinlein, P., Schutz, G., & Beug, H. (1999) · Genes & Development · doi:10.1101/gad.13.22.2996 · Cited by 296
Snyder, L. M., Fortier, N. L., Trainor, J., Jacobs, J., Leb, L., Lubin, B., Chiu, D., Shohet, S., & Mohandas, N. (1985) · Journal of Clinical Investigation · doi:10.1172/jci112196 · Cited by 273
George, T. C., Fanning, S. L., Fitzgerald-Bocarsly, P. A., Medeiros, R. B., Highfill, S., Shimizu, Y., Hall, B. E., Frost, K., Basiji, D. A., Ortyn, W. E., et al. (2006) · Journal of Immunological Methods · doi:10.1016/j.jim.2006.01.018 · Cited by 253
miR-451 protects against erythroid oxidant stress by repressing 14-3-3ζPreprint
Yu, D., dos Santos, C. O., Zhao, G., Jiang, J., Amigo, J. D., Khandros, E., Doré, L. C., Yao, Y., D'Souza, J., Zhang, Z., et al. (2010) · Genes & Development · doi:10.1101/gad.1942110 · Cited by 242
Blood banking–induced alteration of red blood cell flow properties
Relevy, H., Koshkaryev, A., Manny, N., Yedgar, S., & Barshtein, G. (2007) · Transfusion · doi:10.1111/j.1537-2995.2007.01491.x · Cited by 203
Self-citationmiR-451 regulates zebrafish erythroid maturation in vivo via its target gata2
Pase, L. B., Layton, J. E., Kloosterman, W. P., Carradice, D., Waterhouse, P. M., & Lieschke, G. J. (2008) · Blood · doi:10.1182/blood-2008-05-155812 · Cited by 202
Defective erythroid differentiation in miR-451 mutant mice mediated by 14-3-3ζPreprint
Patrick, D. M., Zhang, C. C., Tao, Y., Yao, H., Qi, X., Schwartz, R. J., Huang, L. J.-S., & Olson, E. N. (2010) · Genes & Development · doi:10.1101/gad.1942810 · Cited by 178
Oxidation-induced changes in microrheologic properties of the red blood cell membrane
Hebbel, R., Leung, A., & Mohandas, N. (1990) · Blood · doi:10.1182/blood.v76.5.1015.bloodjournal7651015 · Cited by 153
miR-142-3p Prevents Macrophage Differentiation during Cancer-Induced Myelopoiesis
Sonda, N., Simonato, F., Peranzoni, E., Calì, B., Bortoluzzi, S., Bisognin, A., Wang, E., Marincola, F. M., Naldini, L., Gentner, B., et al. (2013) · Immunity · doi:10.1016/j.immuni.2013.06.004 · Cited by 141
Broudy, V., Lin, N., Priestley, G. V., Nocka, K. H., & Wolf, N. (1996) · Blood · doi:10.1182/blood.v88.1.75.75 · Cited by 138
Activation of MYC in a masked t(8;17) translocation results in an aggressive B-cell leukemia.
Gauwerky, C. E., Huebner, K., Isobe, M., Nowell, P. C., & Croce, C. M. (1989) · Proceedings of the National Academy of Sciences · doi:10.1073/pnas.86.22.8867 · Cited by 125
miR-191 regulates mouse erythroblast enucleation by down-regulating Riok3 and Mxi1Preprint
Zhang, L., Flygare, J., Wong, P., Lim, B., & Lodish, H. F. (2010) · Genes & Development · doi:10.1101/gad.1998711 · Cited by 123
miRNAs at the interface of cellular stress and disease
Emde, A., & Hornstein, E. (2014) · The EMBO Journal · doi:10.15252/embj.201488142 · Cited by 118
Self-citationGutiérrez, L., Tsukamoto, S., Suzuki, M., Yamamoto‐Mukai, H., Yamamoto, M. P., Philipsen, S., & Ohneda, K. (2008) · Blood · doi:10.1182/blood-2007-09-115121 · Cited by 116
Altered lymphopoiesis and immunodeficiency in miR-142 null mice
Kramer, N. J., Wang, W.-L., Reyes, E. Y., Kumar, B., Chen, C., Ramakrishna, C., Cantin, E. M., Vonderfecht, S. L., Taganov, K. D., Chau, N., et al. (2015) · Blood · doi:10.1182/blood-2014-10-603951 · Cited by 113
Mildner, A., Chapnik, E., Manor, O., Yona, S., Kim, K.-W., Aychek, T., Varol, D., Beck, G., Barnett‐Itzhaki, Z., Feldmesser, E., et al. (2012) · Blood · doi:10.1182/blood-2012-07-445999 · Cited by 112
Self-citationThe osmotic fragility of erythrocytes after prolonged liquid storage and after reinfusion
Beutler, E., Kühl, W., & West, C. (1982) · Blood · doi:10.1182/blood.v59.6.1141.1141 · Cited by 103
Sinha, A., Chu, T. T. T., Dao, M., & Chandramohanadas, R. (2015) · Scientific Reports · doi:10.1038/srep09768 · Cited by 100
AMPKα1 Deletion Shortens Erythrocyte Life Span in Mice
Wang, S., Dale, G. L., Song, P., Viollet, B., & Zou, M. (2010) · Journal of Biological Chemistry · doi:10.1074/jbc.m110.102467 · Cited by 96
miR-142-3p regulates the formation and differentiation of hematopoietic stem cells in vertebrates
Lu, X., Li, X., He, Q., Gao, J., Gao, Y., Liu, B., & Liu, F. (2013) · Cell Research · doi:10.1038/cr.2013.145 · Cited by 95
Mature T cell responses are controlled by microRNA-142
Sun, Y., Oravecz-Wilson, K. I., Mathewson, N. D., Wang, Y., McEachin, R. C., Liu, C., Toubai, T., Wu, J. J., Rossi, C., Braun, T. W., et al. (2015) · Journal of Clinical Investigation · doi:10.1172/jci78753 · Cited by 86
miR-142 orchestrates a network of actin cytoskeleton regulators during megakaryopoiesis
Chapnik, E., Rivkin, N., Mildner, A., Beck, G., Pasvolsky, R., Metzl-Raz, E., Birger, Y., Amir, G., Tirosh, I., Porat, Z., et al. (2014) · eLife · doi:10.7554/elife.01964 · Cited by 83
Self-citationBiogenesis of the Red Blood Cell Membrane-Skeleton and the Control of Erythroid Morphogenesis
Lazarides, E., & Woods, C. (1989) · Annual Review of Cell Biology · doi:10.1146/annurev.cb.05.110189.002235 · Cited by 78
miR-142-3p Controls the Specification of Definitive Hemangioblasts during Ontogeny
Nimmo, R. A., Ciau‐Uitz, A., Ruiz‐Herguido, C., Soneji, S., Bigas, A., Patient, R. K., & Enver, T. (2013) · Developmental Cell · doi:10.1016/j.devcel.2013.06.023 · Cited by 69
miR-142-3p acts as an essential modulator of neutrophil development in zebrafish
Fan, H.-B., Liu, Y., Wang, L., Du, T., Dong, M., Gao, L., Meng, Z.-Z., Jin, Y., Chen, Y., Deng, M., et al. (2014) · Blood · doi:10.1182/blood-2013-12-545012 · Cited by 62
Barshtein, G., Gural, A., Manny, N., Zelig, O., Yedgar, S., & Arbell, D. (2014) · Transfusion Medicine and Hemotherapy · doi:10.1159/000357986 · Cited by 59
Self-citationMIR 144 and MIR 451 regulate human erythropoiesis via RAB 14
Kim, M., Tan, Y. S., Cheng, W., Kingsbury, T. J., Heimfeld, S., & Civin, C. I. (2014) · British Journal of Haematology · doi:10.1111/bjh.13164 · Cited by 59
Zhou, Q., Haupt, S., Prots, I., Thümmler, K., Kremmer, E., Lipsky, P. E., Schulze‐Koops, H., & Skapenko, A. (2013) · The Journal of Immunology · doi:10.4049/jimmunol.1202993 · Cited by 59
Lagrange, B., Martin, R. Z., Droin, N. M., Aucagne, R., Paggetti, J., Largeot, A., Itzykson, R., Solary, É., Delva, L., & Bastie, J.-N. (2013) · Biochimica et Biophysica Acta (BBA) - Molecular Cell Research · doi:10.1016/j.bbamcr.2013.04.007 · Cited by 54
Disorders of the Red Cell Membrane
Delaunay, J., & Stewart, G. W. (2007) · Humana Press eBooks · doi:10.1007/978-1-59259-963-9_85 · Cited by 31
Generation and Validation of miR-142 Knock Out Mice
Shrestha, A., Carraro, G., Agha, E. E., Талгатовна, М. Р., Chao, C., Rizvanov, A. A., Barreto, G., & Bellusci, S. (2015) · PLoS ONE · doi:10.1371/journal.pone.0136913 · Cited by 29
Kondo, M., Itoh, S., Kusaka, T., Imai, T., Isobe, K., & Onishi, S. (2002) · Early Human Development · doi:10.1016/s0378-3782(01)00234-1 · Cited by 20
Biogenesis Of The Red Blood Cell Membrane-Skeleton And The Control Of Erythroid Morphogenesis
Lazarides, E. (1989) · Annual Review of Cell and Developmental Biology · doi:10.1146/annurev.cellbio.5.1.427 · Cited by 4
Research works printed but not linked: 1
- [22]Kim M Tan YS Cheng WC Kingsbury TJ Heimfeld S Civin CI MIR144 and MIR451 regulate human erythropoiesis via RAB14. Br J Haematol. 2015; 168(4): 583– 597. 25312678 PMC4314389
Cited by
Bartel, D. P. (2018) · Cell · doi:10.1016/j.cell.2018.03.006 · Cited by 3,751
Therapeutic advances of miRNAs: A preclinical and clinical update
Chakraborty, C., Sharma, A. R., Sharma, G., & Lee, S.-S. (2021) · Journal of Advanced Research · doi:10.1016/j.jare.2020.08.012 · Cited by 402
Red Blood Cells as Potential Repositories of MicroRNAs in the Circulatory System
Sun, L., Yu, Y., Niu, B., & Wang, D. (2020) · Frontiers in Genetics · doi:10.3389/fgene.2020.00442 · Cited by 83
Metadata
- Authors
- Rivkin, N., Chapnik, E., Mildner, A., Barshtein, G., Porat, Z., Kartvelishvily, E., Dadosh, T., Birger, Y., Amir, G., Yedgar, S., Izraeli, S., Jung, S., & Hornstein, E.
- Venue
- Haematologica
- Published
- 2016-12-01
- Volume
- 102
- Issue
- 4
- Pages
- 676-685
- ISSN
- 0390-6078
- 1592-8721
- PMC
- PMC5395108
- Cited by
- 31
- References
- 49
- Language
- en
About these checks
Registry, retraction, Cites and statistics results are computed, not judged, with one exception: a printed reference that no index lists is read once by a model before it counts as a citation error. Claims are extracted by a model and kept only when their quote appears verbatim in the text; each cited source is then checked, with a model’s help, for whether it says what the claim relies on. Those verdicts can be wrong — read the claim’s quote and the cited source before relying on one.
Statistics and arithmetic are recomputed, not judged.
Confidence bands are shown only for fields calibrated on our annotated test set. None is calibrated yet, so no band is shown.
What counts as a claim ›How we measure confidence ›How we check this ›
Are you an author, or do you see a problem with this page? Request a review
Data sources
Bibliographic data: Semantic Scholar, OpenAlex, Crossref.
Contains information from the Semantic Scholar Academic Graph Datasets, made available under the ODC Attribution License (ODC-BY 1.0).
Semantic Scholar’s data is described in: Kinney, R., et al. (2023). The Semantic Scholar Open Data Platform. arXiv:2301.10140.
