

The DOI matches its Crossref record; 74 of the 74 references it cites were found in a registry or an index.
Changes in the Transcriptome of Human Astrocytes Accompanying Oxidative Stress-Induced Senescence
Open accessAbstract
Aging is a major risk factor for many neurodegenerative disorders. A key feature of aging biology that may underlie these diseases is cellular senescence. Senescent cells accumulate in tissues with age, undergo widespread changes in gene expression, and typically demonstrate altered, pro-inflammatory profiles. Astrocyte senescence has been implicated in neurodegenerative disease, and to better understand senescence-associated changes in astrocytes, we investigated changes in their transcriptome using RNA sequencing. Senescence was induced in human fetal astrocytes by transient oxidative stress. Brain-expressed genes, including those involved in neuronal development and differentiation, were downregulated in senescent astrocytes. Remarkably, several genes indicative of astrocytic responses to injury were also downregulated, including glial fibrillary acidic protein and genes involved in the processing and presentation of antigens by major histocompatibility complex class II proteins, while pro-inflammatory genes were upregulated. Overall, our findings suggest that senescence-related changes in the function of astrocytes may impact the pathogenesis of age-related brain disorders.
Overview
The claims and statistics of this paper haven’t been checked yet.
Run the check — free, no account needed. It reads the open-access text and checks the sources it cites.
Integrity signals
Registry
Cites
Statistics
Figures
Verification
Claims the paper makes
The claims and statistics of this paper haven’t been checked yet.
Run the check — free, no account needed. It reads the open-access text and checks the sources it cites.
Claims other papers make about this one
Each is checked against this paper’s own text: does it say what the citing paper says it does?
In the citing paper
“This is a hallmark of senescence in astrocytes, suggesting that these cells have taken on a secretive function [25].”
From DNA repair deficiency and senescence in concussed professional athletes involved in contact sports (2019) · cites this paper as [25]
Self-check
Percentages, sums and reported differences re-computed from the paper’s own numbers.
The self-check needs the paper’s full text.
Citations
Cites
Systematic and integrative analysis of large gene lists using DAVID bioinformatics resources
Huang, D. W., Sherman, B. T., & Lempicki, R. A. (2009) · Nature Protocols · doi:10.1038/nprot.2008.211 · Cited by 35,890
Astrocyte-endothelial interactions at the blood-brain barrier
Abbott, N. J., Rönnbäck, L., & Hansson, E. (2006) · Nature Reviews Neuroscience · doi:10.1038/nrn1824 · Cited by 5,595
Zhang, Y., Chen, K., Sloan, S. A., Bennett, M. L., Scholze, A. R., O'Keeffe, S., Phatnani, H. P., Guarnieri, P., Caneda, C., Ruderisch, N., et al. (2014) · The Journal of Neuroscience · doi:10.1523/jneurosci.1860-14.2014 · Cited by 4,875
Meta-Analysis of 74,046 Individuals Identifies 11 New Susceptibility Loci for Alzheimer’s Disease
(EADI), E. A. D. I., Lambert, J.-C., (GERAD), G. A. E. R. I. A. D., Alzheimer's Disease Genetic Consortium (ADGC), (CHARGE), C. F. H. A. A. R. I. G. E., Ibrahim-Verbaas, C. A., Harold, D., Naj, A. C., Sims, R., Bellenguez, C., et al. (2013) · Nature Genetics · doi:10.1038/ng.2802 · Cited by 4,336
Self-citationClearance of p16Ink4a-positive senescent cells delays ageing-associated disorders
Baker, D. J., Wijshake, T., Tchkonia, T., LeBrasseur, N. K., Childs, B. G., van de Sluis, B., Kirkland, J. L., & van Deursen, J. M. (2011) · Nature · doi:10.1038/nature10600 · Cited by 3,670 · cited 2×
“Frontiers in Aging Neuroscience | www.frontiersin.org 7 August 2016 | Volume 8 | Article 208”
BackgroundCahoy, J. D., Emery, B., Kaushal, A., Foo, L. C., Zamanian, J. L., Christopherson, K. S., Xing, Y., Lubischer, J. L., Krieg, P. A., Krupenko, S. A., et al. (2008) · The Journal of Neuroscience · doi:10.1523/jneurosci.4178-07.2008 · Cited by 3,129
Naturally occurring p16Ink4a-positive cells shorten healthy lifespan
Baker, D. J., Childs, B. G., Durik, M., Wijers, M. E., Sieben, C. J., Zhong, J., A. Saltness, R., Jeganathan, K. B., Verzosa, G. C., Pezeshki, A., et al. (2016) · Nature · doi:10.1038/nature16932 · Cited by 2,876
Molecular dissection of reactive astrogliosis and glial scar formation
Sofroniew, M. V. (2009) · Trends in Neurosciences · doi:10.1016/j.tins.2009.08.002 · Cited by 2,594
Hendzel, M. J., Wei, Y., Mancini, M. A., Hooser, A. A. V., Ranalli, T. A., Brinkley, B. R., Bazett‐Jones, D. P., & Allis, C. D. (1997) · Chromosoma · doi:10.1007/s004120050256 · Cited by 1,860
Tripartite synapses: astrocytes process and control synaptic information
Perea, G., Navarrete, M., & Araque, A. (2009) · Trends in Neurosciences · doi:10.1016/j.tins.2009.05.001 · Cited by 1,820
Cited by
Sorted by citations
Lin, Y.-T., Seo, J., Gao, F., Feldman, H. M., Wen, H.-L., Penney, J., Cam, H. P., Gjoneska, E., Raja, W. K., Cheng, J., et al. (2018) · Neuron · doi:10.1016/j.neuron.2018.05.008 · Cited by 1,125
Unmasking Transcriptional Heterogeneity in Senescent Cells
Hernandez-Segura, A., de Jong, T. V., Melov, S., Guryev, V., Campisi, J., & Demaria, M. (2017) · Current Biology · doi:10.1016/j.cub.2017.07.033 · Cited by 972
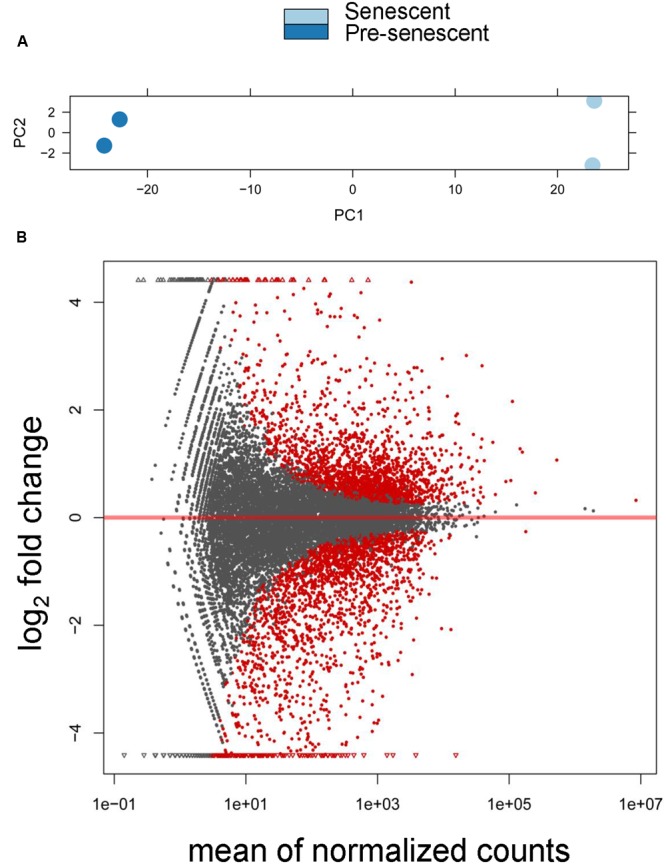
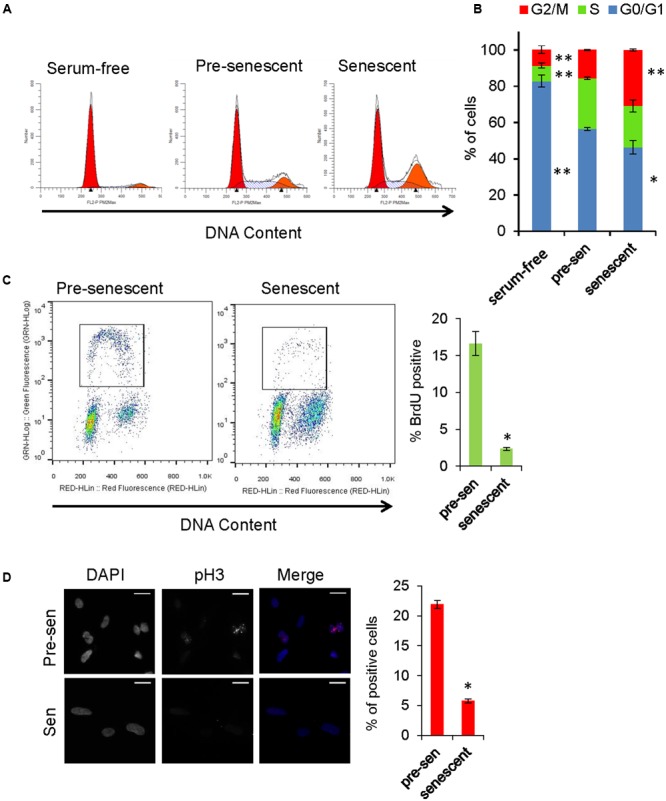
“The dataset from astrocytes was publicly available, and senescence was induced by oxidative stress [25] (Figure 2A).”
MethodCellular senescence in brain aging and neurodegenerative diseases: evidence and perspectives
Baker, D. J., & Petersen, R. C. (2018) · Journal of Clinical Investigation · doi:10.1172/jci95145 · Cited by 514
Ageing, Cellular Senescence and Neurodegenerative Disease
Kritsilis, M., V. Rizou, S., Koutsoudaki, P. N., Evangelou, K., Gorgoulis, V. G., & Papadopoulos, D. (2018) · International Journal of Molecular Sciences · doi:10.3390/ijms19102937 · Cited by 448
Astrocyte senescence: Evidence and significance
Cohen, J., & Torres, C. (2019) · Aging Cell · doi:10.1111/acel.12937 · Cited by 281
Self-citation
Metadata
- Authors
- Crowe, E. P., Tuzer, F., Gregory, B. D., Donahue, G., Gosai, S. J., Cohen, J., Leung, Y. Y., Yetkin, E., Nativio, R., Wang, L.-S., Sell, C., Bonini, N. M., Berger, S. L., Johnson, F. B., & Torres, C.
- Affiliations
- Drexel University (US)
- University of Pennsylvania (US)
- Corresponding author
- Torres, Claudio
- ORCID
- Venue
- Frontiers in Aging Neuroscience
- Publisher
- Frontiers Media SA
- Published
- 2016-08-31
- Volume
- 8
- Pages
- 208-208
- ISSN
- 1663-4365 (ISSN-L)
- PMC
- PMC5005348
- OpenAlex
- W2508551815
- Cited by
- 110
- References
- 74
- Citations by year
- 2026: 8 · 2025: 15 · 2024: 13 · 2023: 14 · 2022: 15 · 2021: 10 · 2020: 13 · 2019: 8 · 2018: 8 · 2017: 6
- FWCI
- 5.86
- Type
- journal article
- Language
- en
- Open access
- gold
- doi.org
- Licence
- cc-by
- Locations
- Frontiers in Aging Neuroscience (publishedVersion, cc-by)
- Europe PMC (PubMed Central) (publishedVersion, cc-by)
- PubMed Central (publishedVersion, cc-by)
- PubMed (publishedVersion)
- ScholarlyCommons (University of Pennsylvania) (submittedVersion, cc-by)
- DOAJ (DOAJ: Directory of Open Access Journals) (submittedVersion)
- Funders
- National Institute of Neurological Disorders and Stroke (RO1NS078283)
- National Institute on Aging (R21AG046943, F30AG043307)
- Topics
- Life Sciences › Biochemistry, Genetics and Molecular Biology › Cell Biology › Telomeres, Telomerase, and Senescence
- Life Sciences › Biochemistry, Genetics and Molecular Biology › Aging › Genetics, Aging, and Longevity in Model Organisms
- Life Sciences › Neuroscience › Neurology › Neuroinflammation and Neurodegeneration Mechanisms
- Keywords
- astrocyte senescence, oxidative stress, transcriptome, cellular senescence, neurodegenerative diseases, aging, pro-inflammatory genes, glial fibrillary acidic protein, MHC class II antigen presentation
About these checks
Registry, retraction, Cites and statistics results are computed, not judged, with one exception: a printed reference that no index lists is read once by a model before it counts as a citation error. Claims are extracted by a model and kept only when their quote appears verbatim in the text; each cited source is then checked, with a model’s help, for whether it says what the claim relies on. Those verdicts can be wrong — read the claim’s quote and the cited source before relying on one.
Statistics and arithmetic are recomputed, not judged.
Confidence bands are shown only for fields calibrated on our annotated test set. None is calibrated yet, so no band is shown.
What counts as a claim ›How we measure confidence ›How we check this ›
Are you an author, or do you see a problem with this page? Request a review
