Cited by 93

The DOI matches its Crossref record; 3 of the 3 references it cites were found in a registry or an index.

Probiotics and Prebiotics as a Therapeutic Strategy to Improve Memory in a Model of Middle-Aged Rats

Romo-Araiza, Alejandra, Gutiérrez-Salmeán, Gabriela, Galván, Emilio J., Hernández-Frausto, Melissa, Herrera-López, Gabriel, Romo-Parra, Hector, García-Contreras, Valentina, Fernández-Presas, Ana María, Jasso-Chávez, Ricardo, Borlongan, Cesar V., Ibarra, Antonio·2018·Frontiers in Aging Neuroscience

Overview

The claims and statistics of this paper haven’t been checked yet.

Run the check — free, no account needed. It reads the open-access text and checks the sources it cites.

A few free checks a day · papers already verified open instantly · results are public

Integrity signals

Registry

Crossref · 10.3389/fnagi.2018.00416

Cites

3 of 3 references verified0 citation errors · 0 not checkable

Statistics

Figures

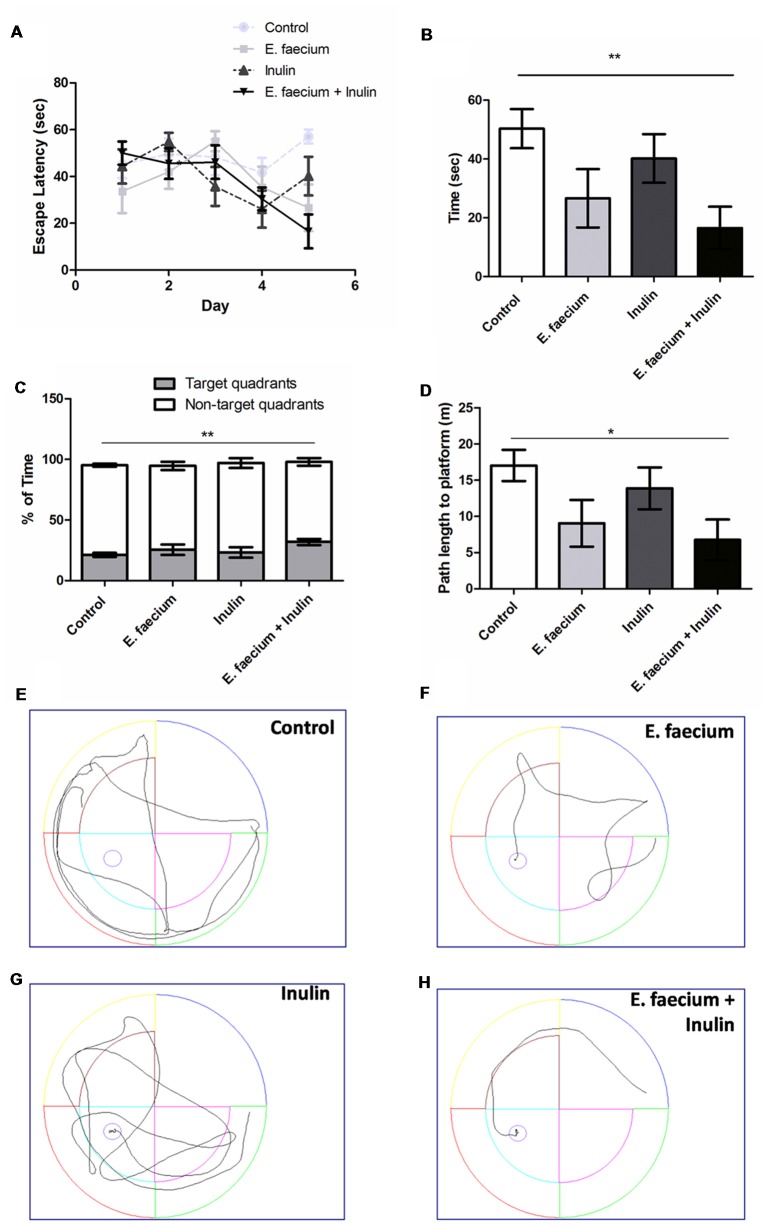
Figure 1 Results from the Morris Water Maze (MWM) test. (A) Escape latency time (seconds) from starting point in the North quadrant and platform in Southwest (SW) quadrant shows a decrease in time in all the supplemented groups. Two-way ANOVA for repeated measures followed by post hoc Bonferroni, F(12,116) = 1.96; p = 0.03; (B) In day 5 of the acquisition phase, symbiotic group shows a significantly lower escape time vs. control group. Mean ± SEM, n = 8, Mann-Whitney U **p < 0.01; (C) Time spent (percentage) in the target quadrant compared to the non-target quadrants. Mean ± SEM, n = 8. Mann-Whitney U test; **p < 0.01; (D) Path length to platform (m) measured during the last day (5th) of the acquisition test. Mean ± SEM, n = 8, Mann-Whitney U; *p < 0.05; (E–H) Illustrative images of rats trajectories in MWM during last days’ trials of study groups: control (E), probiotic (E. faecium; F), prebiotic (agave inulin; G) and symbiotic (E. faecium + agave inulin; H). This experiment is one of two in which the same effect was observed.
Figure 1 Results from the Morris Water Maze (MWM) test. (A) Escape latency time (seconds) from starting point in the North quadrant and platform in Southwest (SW) quadrant shows a decrease in time in all the supplemented groups. Two-way ANOVA for repeated measures followed by post hoc Bonferroni, F(12,116) = 1.96; p = 0.03; (B) In day 5 of the acquisition phase, symbiotic group shows a significantly lower escape time vs. control group. Mean ± SEM, n = 8, Mann-Whitney U **p < 0.01; (C) Time spent (percentage) in the target quadrant compared to the non-target quadrants. Mean ± SEM, n = 8. Mann-Whitney U test; **p < 0.01; (D) Path length to platform (m) measured during the last day (5th) of the acquisition test. Mean ± SEM, n = 8, Mann-Whitney U; *p < 0.05; (E–H) Illustrative images of rats trajectories in MWM during last days’ trials of study groups: control (E), probiotic (E. faecium; F), prebiotic (agave inulin; G) and symbiotic (E. faecium + agave inulin; H). This experiment is one of two in which the same effect was observed.CC BY · PubMed Central
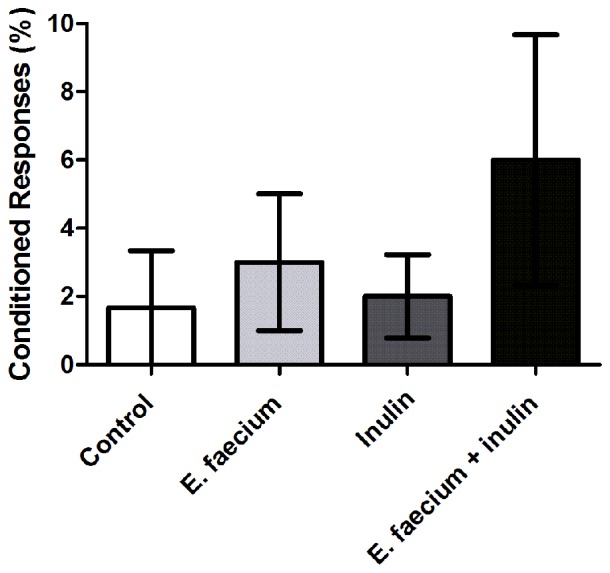
Figure 2 Results from Pavlovian autoshaping test. Conditioned responses (CRs) at 24 h after a training session. Results are presented as Mean ± SEM; n = 5; Kruskal-Wallis test (ns). This experiment is one of two in which the same effect was observed.
Figure 2 Results from Pavlovian autoshaping test. Conditioned responses (CRs) at 24 h after a training session. Results are presented as Mean ± SEM; n = 5; Kruskal-Wallis test (ns). This experiment is one of two in which the same effect was observed.CC BY · PubMed Central
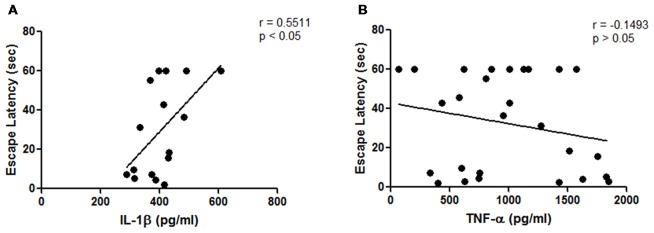
Figure 3 Results from hippocampal cytokines concentrations of middle-aged rats. (A) Correlation analysis between hippocampal interleukin-1β (IL-1β) concentrations and escape latency time on the last day of the acquisition phase (p < 0.05; Pearson’s correlation, n = 3 animals for E. faecium group, four animals for each control, inulin and symbiotic groups); (B) Correlation analysis between hippocampal tumor necrosis factor-α (TNF-α) concentrations and escape latency time on the last day of the acquisition phase (p = 0.2066, Spearman’s correlation, n = 8 animals per group).
Figure 3 Results from hippocampal cytokines concentrations of middle-aged rats. (A) Correlation analysis between hippocampal interleukin-1β (IL-1β) concentrations and escape latency time on the last day of the acquisition phase (p < 0.05; Pearson’s correlation, n = 3 animals for E. faecium group, four animals for each control, inulin and symbiotic groups); (B) Correlation analysis between hippocampal tumor necrosis factor-α (TNF-α) concentrations and escape latency time on the last day of the acquisition phase (p = 0.2066, Spearman’s correlation, n = 8 animals per group).CC BY · PubMed Central
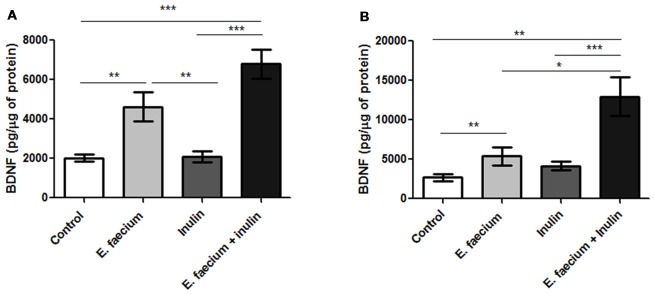
Figure 4 Results from hippocampal brain-derived neurotrophic factor (BDNF) concentrations of middle-aged rats. (A) Rats who underwent to MWM task. BDNF concentrations were significantly higher on the hippocampus of the symbiotic group as compared to the control one. Mean ± SEM, n = 8 for each group, Mann-Whitney U, **p < 0.01, ***p < 0.0001; (B) Rats who underwent the Autoshaping task. Mean ± SEM, n = 5 for each group, Mann-Whitney U, *p < 0.05, **p < 0.01, ***p < 0.0001. This experiment is one of three in which the same effect was observed.
Figure 4 Results from hippocampal brain-derived neurotrophic factor (BDNF) concentrations of middle-aged rats. (A) Rats who underwent to MWM task. BDNF concentrations were significantly higher on the hippocampus of the symbiotic group as compared to the control one. Mean ± SEM, n = 8 for each group, Mann-Whitney U, **p < 0.01, ***p < 0.0001; (B) Rats who underwent the Autoshaping task. Mean ± SEM, n = 5 for each group, Mann-Whitney U, *p < 0.05, **p < 0.01, ***p < 0.0001. This experiment is one of three in which the same effect was observed.CC BY · PubMed Central
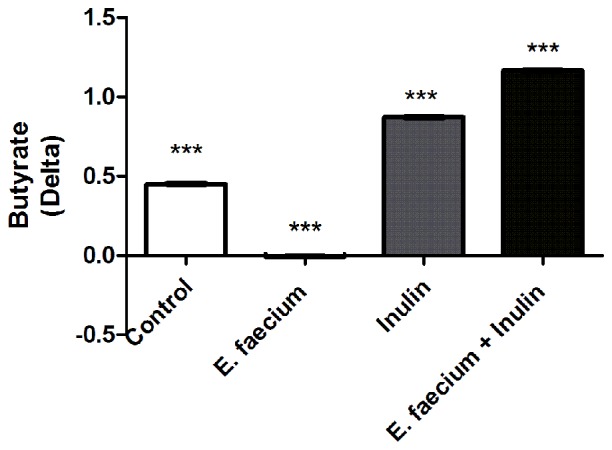
Figure 5 Butyrate in fecal samples of studied rats. Delta of concentration in each experimental groups. One-way ANOVA followed by Tukey’s post hoc, F(3,12) = 902.6, ***p < 0.0001 between all groups. This experiment is one of two in which the same effect was observed.
Figure 5 Butyrate in fecal samples of studied rats. Delta of concentration in each experimental groups. One-way ANOVA followed by Tukey’s post hoc, F(3,12) = 902.6, ***p < 0.0001 between all groups. This experiment is one of two in which the same effect was observed.CC BY · PubMed Central
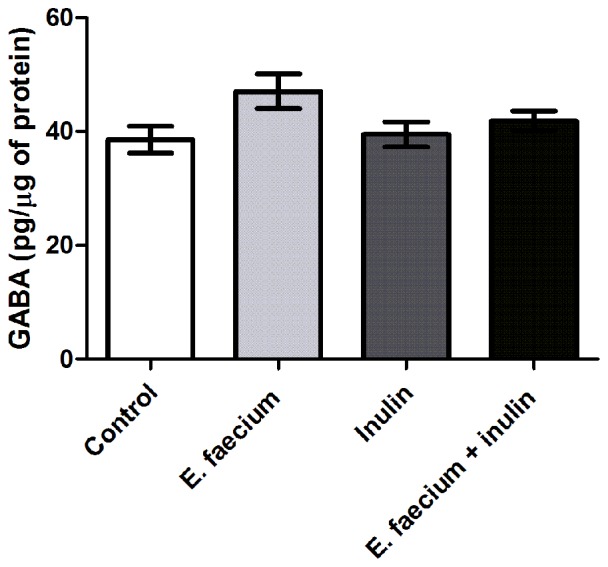
Figure 6 Results from hippocampal γ-aminobutyric acid (GABA) concentrations of middle-aged rats. GABA concentrations show no difference between groups. Mean ± SEM, n = 8 for each group, Kruskal-Wallis.
Figure 6 Results from hippocampal γ-aminobutyric acid (GABA) concentrations of middle-aged rats. GABA concentrations show no difference between groups. Mean ± SEM, n = 8 for each group, Kruskal-Wallis.CC BY · PubMed Central
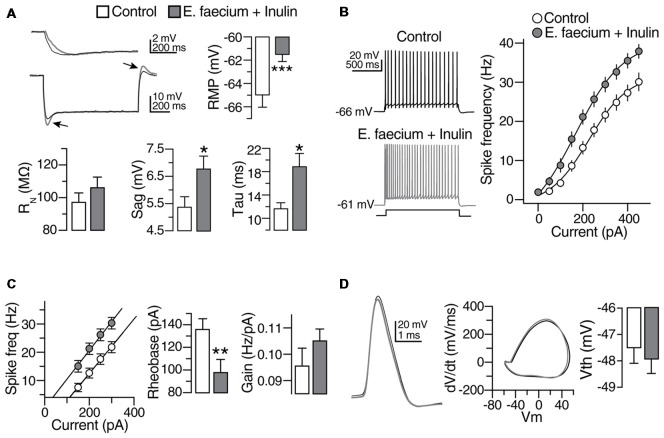
Figure 7 Subthreshold modulation of membrane properties of CA1 pyramidal cells (PCs) following E. faecium + Inulin supplementation. (A) Upper panels. Bar graphs depicting changes in resting membrane potential (RMP), Input resistance (RN) and membrane time constant (ms) in control (empty bars) and from treated animals (gray bars). Bottom panels compared to control, treated animals exhibited increased “sag” conductance (see arrowheads). Right panel, examples of changes in the membrane time constant and sag conductance in the CA1 PCs from treated animals (gray traces; measurements were performed in 43 cells/8 animals for control condition and 45 cells/8 animals for the symbiotic group). (B) Scatter plot and representative voltage traces summarizing the changes in the action potential frequency obtained with different current injections in control and CA1 PCs from treated animals (n = 21 cells/8 animals for control condition and 23 cells/8 animals for the symbiotic group). (C) Bar graph depicting the reduction in the rheobase current required to elicit action potentials after the symbiotic supplementation. Right panel summarizes the increase in the gain of CA1 PCs of E. faecium + Inulin treated animals (n = 21 cells/8 animals for control condition and 23 cells/8 animals for the symbiotic group). (D) Superimposed action potential waveforms (left panel), action potentials phase plots (middle panel) and bar graphs of the action potential threshold (right panel) showing that the supplementation with symbiotics does not alter the action potential kinetics. Gray traces and bars belongs to CA1 PCs from treated animals. *p < 0.05, **p < 0.01, ***p < 0.001 or higher statistical significance.
Figure 7 Subthreshold modulation of membrane properties of CA1 pyramidal cells (PCs) following E. faecium + Inulin supplementation. (A) Upper panels. Bar graphs depicting changes in resting membrane potential (RMP), Input resistance (RN) and membrane time constant (ms) in control (empty bars) and from treated animals (gray bars). Bottom panels compared to control, treated animals exhibited increased “sag” conductance (see arrowheads). Right panel, examples of changes in the membrane time constant and sag conductance in the CA1 PCs from treated animals (gray traces; measurements were performed in 43 cells/8 animals for control condition and 45 cells/8 animals for the symbiotic group). (B) Scatter plot and representative voltage traces summarizing the changes in the action potential frequency obtained with different current injections in control and CA1 PCs from treated animals (n = 21 cells/8 animals for control condition and 23 cells/8 animals for the symbiotic group). (C) Bar graph depicting the reduction in the rheobase current required to elicit action potentials after the symbiotic supplementation. Right panel summarizes the increase in the gain of CA1 PCs of E. faecium + Inulin treated animals (n = 21 cells/8 animals for control condition and 23 cells/8 animals for the symbiotic group). (D) Superimposed action potential waveforms (left panel), action potentials phase plots (middle panel) and bar graphs of the action potential threshold (right panel) showing that the supplementation with symbiotics does not alter the action potential kinetics. Gray traces and bars belongs to CA1 PCs from treated animals. *p < 0.05, **p < 0.01, ***p < 0.001 or higher statistical significance.CC BY · PubMed Central
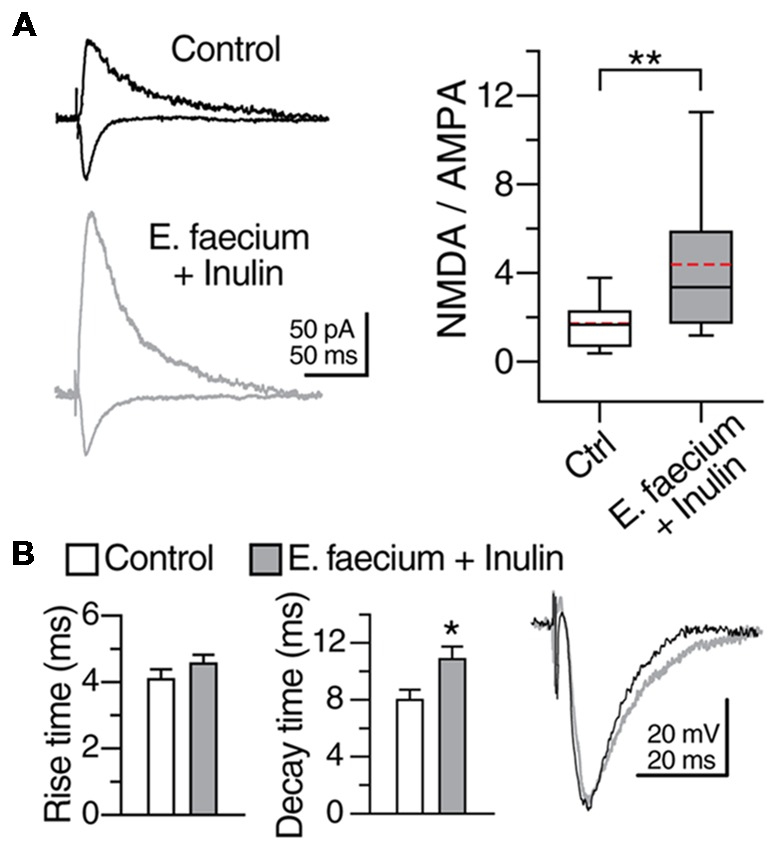
Figure 8 E. faecium + Inulin supplementation modifies the N-methyl-D-aspartate (NMDA)/AMPA ratio of CA1 PCs. (A) Representative traces (averaged from five continuous sweeps) obtained in voltage clamp mode acquired at −70 mV and +40 mV showing the typical AMPA- and NMDA-mediated response in control and in the E. faecium + Inulin supplemented group. The box plots in the right panel summarize the changes in the NMDA/AMPA ratio of the two experimental groups. (B) Bar graphs of the average Rise time and decay time of the evoked responses acquired at −70 mV in voltage clamp mode (n = 14 cells/3 animals for control condition and 15 cells/6 animals for the symbiotic group). The animals supplemented with E. faecium + Inulin exhibited an increase in the decay time of the excitatory responses. *p < 0.05, **p < 0.01.
Figure 8 E. faecium + Inulin supplementation modifies the N-methyl-D-aspartate (NMDA)/AMPA ratio of CA1 PCs. (A) Representative traces (averaged from five continuous sweeps) obtained in voltage clamp mode acquired at −70 mV and +40 mV showing the typical AMPA- and NMDA-mediated response in control and in the E. faecium + Inulin supplemented group. The box plots in the right panel summarize the changes in the NMDA/AMPA ratio of the two experimental groups. (B) Bar graphs of the average Rise time and decay time of the evoked responses acquired at −70 mV in voltage clamp mode (n = 14 cells/3 animals for control condition and 15 cells/6 animals for the symbiotic group). The animals supplemented with E. faecium + Inulin exhibited an increase in the decay time of the excitatory responses. *p < 0.05, **p < 0.01.CC BY · PubMed Central
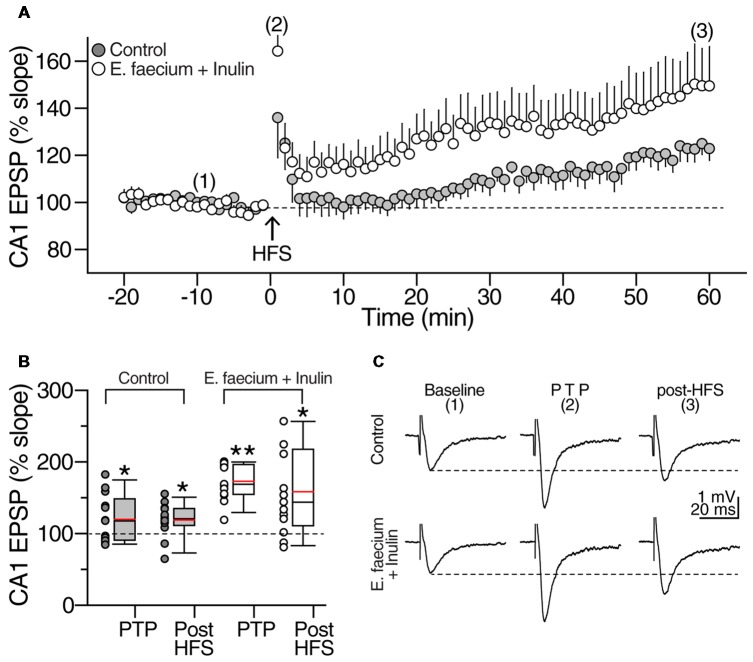
Figure 9 E. faecium + Inulin supplementation facilitates the induction of long-term potentiation (LTP) in area CA1. (A) Averaged time-course and magnitude of LTP of control slices (gray symbols; n = 13 slices/8 animals) contrasted with the responses obtained from supplemented animals (empty symbols; n = 13 slices/8 animals for control condition and 13 slices/8 animals for the symbiotic group). Arrowhead at time zero indicates delivery of tetanic stimulation (two 100 pulses at 100 Hz, delivered at 10 s interval). Tetanic stimulation resulted in a robust post-tetanic potentiation (PTP) of the fEPSP in both experimental groups, followed by a sustained increase in the fEPSP slope. (B) Box plots summarizing fEPSP changes during PTP and LTP of control (gray boxes) and E. faecium + Inulin supplemented group (empty boxes). The symbols at the left side of the box plots represent the average response from each experiment conducted. *p < 0.05, **p < 0.01. (C) Representative extracellular CA1 responses (averaged from 10 consecutive sweeps; recordings were performed in the CA1 stratum radiatum) obtained at the times indicated by the numbers in the time-course graph in upper panel (A), of control (top traces) and treated animals (bottom traces).
Figure 9 E. faecium + Inulin supplementation facilitates the induction of long-term potentiation (LTP) in area CA1. (A) Averaged time-course and magnitude of LTP of control slices (gray symbols; n = 13 slices/8 animals) contrasted with the responses obtained from supplemented animals (empty symbols; n = 13 slices/8 animals for control condition and 13 slices/8 animals for the symbiotic group). Arrowhead at time zero indicates delivery of tetanic stimulation (two 100 pulses at 100 Hz, delivered at 10 s interval). Tetanic stimulation resulted in a robust post-tetanic potentiation (PTP) of the fEPSP in both experimental groups, followed by a sustained increase in the fEPSP slope. (B) Box plots summarizing fEPSP changes during PTP and LTP of control (gray boxes) and E. faecium + Inulin supplemented group (empty boxes). The symbols at the left side of the box plots represent the average response from each experiment conducted. *p < 0.05, **p < 0.01. (C) Representative extracellular CA1 responses (averaged from 10 consecutive sweeps; recordings were performed in the CA1 stratum radiatum) obtained at the times indicated by the numbers in the time-course graph in upper panel (A), of control (top traces) and treated animals (bottom traces).CC BY · PubMed Central
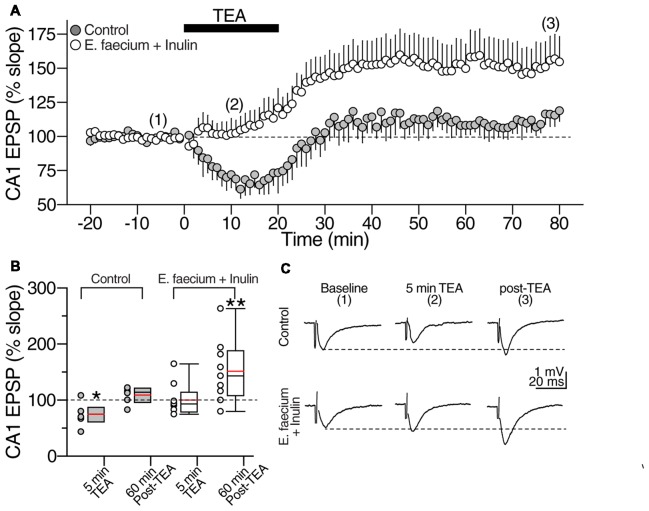
Figure 10 E. faecium + Inulin supplementation reverts the loss of synaptic potentiation induced with Tetraethylammonium (TEA). (A) Averaged time course graph contrasting the lack of synaptic potentiation of control slices (gray symbols; n = 8 cells/5 animals for control condition and 8 cells/5 animals for the symbiotic group) contrasted with the responses obtained from supplemented animals (empty symbols; n = 10 cells/6 animals for control condition and 10 cells/6 animals for the symbiotic group). TEA (20 mM) was bath perfused for 20 min (indicated with the filled bar) and then washed out. TEA stimulation resulted in a sustained increase in the fEPSP slope in the E. faecium + Inulin supplemented slices but not in control slices. (B) Box plots summarizing fEPSP changes at 5 min of TEA perfusion and 60 min post-TEA in control (gray boxes) and E. faecium + Inulin supplemented group (empty boxes). The symbols on left side of the boxes represent the average response from each experiment. *p < 0.05, **p < 0.01. (C) Representative extracellular CA1 responses (averaged from 10 consecutive sweeps; recorded in the CA1 stratum radiatum) obtained at the times indicated by the numbers in the time-course graph in upper panel (A), of control (top traces) and supplemented animals (bottom traces).
Figure 10 E. faecium + Inulin supplementation reverts the loss of synaptic potentiation induced with Tetraethylammonium (TEA). (A) Averaged time course graph contrasting the lack of synaptic potentiation of control slices (gray symbols; n = 8 cells/5 animals for control condition and 8 cells/5 animals for the symbiotic group) contrasted with the responses obtained from supplemented animals (empty symbols; n = 10 cells/6 animals for control condition and 10 cells/6 animals for the symbiotic group). TEA (20 mM) was bath perfused for 20 min (indicated with the filled bar) and then washed out. TEA stimulation resulted in a sustained increase in the fEPSP slope in the E. faecium + Inulin supplemented slices but not in control slices. (B) Box plots summarizing fEPSP changes at 5 min of TEA perfusion and 60 min post-TEA in control (gray boxes) and E. faecium + Inulin supplemented group (empty boxes). The symbols on left side of the boxes represent the average response from each experiment. *p < 0.05, **p < 0.01. (C) Representative extracellular CA1 responses (averaged from 10 consecutive sweeps; recorded in the CA1 stratum radiatum) obtained at the times indicated by the numbers in the time-course graph in upper panel (A), of control (top traces) and supplemented animals (bottom traces).CC BY · PubMed Central

Verification

Claims the paper makes

The claims and statistics of this paper haven’t been checked yet.

Run the check — free, no account needed. It reads the open-access text and checks the sources it cites.

A few free checks a day · papers already verified open instantly · results are public

Claims other papers make about this one

Each is checked against this paper’s own text: does it say what the citing paper says it does?

Self-check

Percentages, sums and reported differences re-computed from the paper’s own numbers.

The self-check needs the paper’s full text.

Citations

Cites

Show all 3 references

Research works printed but not linked: 45

  1. Aguilar, 2016, Oral butyrate reduces oxidative stress in atherosclerotic lesion sites by a mechanism involving NADPH oxidase down-regulation in endothelial cells, J. Nutr. Biochem., 34, 99, 10.1016/j.jnutbio.2016.05.002 · DOI
  2. Alberca Serrano, 2011, Enfermedad de Alzheimer Y Otras Demencias.
  3. Baierle, 2015, Relationship between inflammation and oxidative stress and cognitive decline in the institutionalized elderly, Oxid. Med. Cell. Longev., 2015, 804198, 10.1155/2015/804198 · DOI
  4. Bambah-Mukku, 2014, A positive autoregulatory BDNF feedback loop via C/EBPβ mediates hippocampal memory consolidation, J. Neurosci., 34, 12547, 10.1523/JNEUROSCI.0324-14.2014 · DOI · Paper page
  5. Bannerman, 2014, Hippocampal synaptic plasticity, spatial memory and anxiety, Nat. Rev. Neurosci., 15, 181, 10.1038/nrn3677 · DOI · Paper page
  6. Barahona, 2014, Controversias y utilidad clínica del deterioro cognitivo leve (dcl) disputes and clinical utility of mild cognitive impairment, Int. J. Dev. Edu. Psy., 1, 47, 10.17060/ijodaep/2014.n2.v1.004 · DOI
  7. Barnes, 1997, Age-related decrease in the N-methyl-D-aspartateR-mediated excitatory postsynaptic potential in hippocampal region CA1, Neurobiol. Aging, 18, 445, 10.1016/s0197-4580(97)00044-4 · DOI
  8. Bastos, 2017, Effect of tolbutamide on tetraethylammonium-induced postsynaptic zinc signals at hippocampal mossy fiber-CA3 synapses, Can. J. Physiol. Pharmacol., 95, 1058, 10.1139/cjpp-2016-0379 · DOI
  9. Bercik, 2011, The intestinal microbiota affect central levels of brain-derived neurotropic factor and behavior in mice, Gastroenterology, 141, 609.e1, 10.1053/j.gastro.2011.04.052 · DOI · Paper page
  10. Berni Canani, 2012, The epigenetic effects of butyrate: potential therapeutic implications for clinical practice, Clin. Epigenetics, 4, 4, 10.1186/1868-7083-4-4 · DOI · Paper page
  11. Bourassa, 2016, Butyrate, neuroepigenetics and the gut microbiome: can a high fiber diet improve brain health?, Neurosci. Lett., 625, 56, 10.1016/j.neulet.2016.02.009 · DOI
  12. Bradford, 1976, A rapid and sensitive method for the quantitation of microgram quantities of protein utilizing the principle of proteindye binding, Anal. Biochem., 72, 248, 10.1016/0003-2697(76)90527-3 · DOI · Paper page
  13. Brüssow, 2013, Microbiota and healthy ageing: observational and nutritional interventions studies, Microb. Biotechnol., 6, 326, 10.1111/1751-7915.12048 · DOI
  14. Butterfield, 2014, The 2013 SFRBM discovery award: selected discoveries from the butterfield laboratory of oxidative stress and its sequela in brain in cognitive disorders exemplified by Alzheimer disease and chemotherapy induced cognitive impairment, Free Radic. Biol. Med., 74, 157, 10.1016/j.freeradbiomed.2014.06.006 · DOI · Paper page
  15. Caracciolo, 2014, Cognitive decline, dietary factors and gut-brain interactions, Mech. Ageing Dev., 136, 59, 10.1016/j.mad.2013.11.011 · DOI
  16. Carlos, 2017, IL-1β impairs retrograde flow of BDNF signaling by attenuating endosome trafficking, J. Neuroinflammation, 14, 29, 10.1186/s12974-017-0803-z · DOI
  17. Cevenini, 2013, Inflamm-ageing, Curr. Opin. Clin. Nutr. Metab. Care, 16, 14, 10.1097/MCO.0b013e32835ada13 · DOI · Paper page
  18. Di Filippo, 2013, Effects of central and peripheral inflammation on hippocampal synaptic plasticity, Neurobiol. Dis., 52, 229, 10.1016/j.nbd.2012.12.009 · DOI
  19. Diógenes, 2011, Enhancement of LTP in aged rats is dependent on endogenous BDNF, Neuropsychopharmacology, 36, 1823, 10.1038/npp.2011.64 · DOI
  20. 2001, Health and nutritional properties of probiotics in food including powder milk with live lactic acid bacteria, 1
  21. Franco-Robles, 2015, Implication of fructans in health: immunomodulatory and antioxidant mechanisms, ScientificWorldJournal, 2015, 289267, 10.1155/2015/289267 · DOI
  22. Franco-Robles, 2016, Agavins increase neurotrophic factors and decrease oxidative stress in the brains of high-fat diet-induced obese mice, Molecules, 21, E998, 10.3390/molecules21080998 · DOI
  23. Franz, 2011, Enterococci as probiotics and their implications in food safety, Int. J. Food Microbiol., 151, 125, 10.1016/j.ijfoodmicro.2011.08.014 · DOI
  24. Fukuchi, 2014, Excitatory GABA induces BDNF transcription via CRTC 1 and phosphorylated CREB-related pathways in immature cortical cells, J. Neurochem., 131, 134, 10.1111/jnc.12801 · DOI
  25. Hamer, 2009, Butyrate modulates oxidative stress in the colonic mucosa of healthy humans, Clin. Nutr., 28, 88, 10.1016/j.clnu.2008.11.002 · DOI · Paper page
  26. Huang, 2012, Effect of orally administered Enterococcus faecium EF1 on intestinal cytokines and chemokines production of suckling piglets, Pak. Vet. J., 32, 81
  27. Katche, 2013, Molecular signatures and mechanisms of long-lasting memory consolidation and storage, Neurobiol. Learn. Mem., 106, 40, 10.1016/j.nlm.2013.06.018 · DOI
  28. Kim, 2009, The HDAC inhibitor, sodium butyrate, stimulates neurogenesis in the ischemic brain, J. Neurochem., 110, 1226, 10.1111/j.1471-4159.2009.06212.x · DOI · Paper page
  29. Kumar, 2011, Long-term potentiation at CA3-CA1 hippocampal synapses with special emphasis on aging, disease, and stress, Front. Aging Neurosci., 3, 7, 10.3389/fnagi.2011.00007 · DOI
  30. Leung, 2015, Gut microbiota: a modulator of brain plasticity and cognitive function in ageing, Healthcare, 3, 898, 10.3390/healthcare3040898 · DOI
  31. Luo, 2014, Ingestion of Lactobacillus strain reduces anxiety and improves cognitive function in the hyperammonemia rat, Sci. China Life Sci., 57, 327, 10.1007/s11427-014-4615-4 · DOI · Paper page
  32. Maqsood, 2016, The gut-brain axis, BDNF, NMDA and CNS disorders, Neurochem. Res., 41, 2819, 10.1007/s11064-016-2039-1 · DOI
  33. Mora, 2013, Successful brain aging: plasticity, environmental enrichment and lifestyle, Dialogues Clin. Neurosci., 15, 45, 10.31887/DCNS.2013.15.1/fmora · DOI
  34. Moreno Fernández, 2013, Neurogénesis hipocampal adulta y envejecimiento cognitivo, Escr. Psicol., 6, 14, 10.5231/psy.writ.2013.2510 · DOI
  35. Mufson, 2012, Mild cognitive impairment: pathology and mechanisms, Acta Neuropathol., 123, 13, 10.1007/s00401-011-0884-1 · DOI
  36. Nieto-Vera, 2018, Copolymer-1 enhances cognitive performance in young adult rats, PLoS One, 13, e0192885, 10.1371/journal.pone.0192885 · DOI
  37. Pang, 2004, Regulation of late-phase LTP and long-term memory in normal and aging hippocampus: role of secreted proteins tPA and BDNF, Ageing Res. Rev., 3, 407, 10.1016/j.arr.2004.07.002 · DOI
  38. Peshev, 2014, Fructans: prebiotics and immunomodulators, J. Funct. Foods, 8, 348, 10.1016/j.jff.2014.04.005 · DOI · Paper page
  39. Pineda-Rodriguez, 2017, Anterior chamber associated immune deviation used as a neuroprotective strategy in rats with spinal cord injury, PLoS One, 12, e0188506, 10.1371/journal.pone.0188506 · DOI
  40. Poulos, 2015, Localization and characterization of an essential associative memory trace in the mammalian brain, Brain Res., 1621, 252, 10.1016/j.brainres.2014.10.068 · DOI
  41. Rosi, 2005, Neuroinflammation alters the hippocampal pattern of behaviorally induced Arc expression, J. Neurosci., 25, 723, 10.1523/jneurosci.4469-04.2005 · DOI
  42. Ryan, 2016, Neuroinflammation negatively affects adult hippocampal neurogenesis and cognition: can exercise compensate?, Neurosci. Biobehav. Rev., 61, 121, 10.1016/j.neubiorev.2015.12.004 · DOI
  43. Simen, 2011, Cognitive dysfunction with aging and the role of inflammation, Ther. Adv. Chronic. Dis., 2, 175, 10.1177/2040622311399145 · DOI
  44. Skelly, 2018, Acute transient cognitive dysfunction and acute brain injury induced by systemic inflammation occur by dissociable IL-1-dependent mechanisms, Mol. Psychiatry, 10.1038/s41380-018-0075-8 · DOI
  45. Sun, 2015, Neuroprotective effect of sodium butyrate against cerebral ischemia/reperfusion injury in mice, Biomed Res. Int., 2015, 395895, 10.1155/2015/395895 · DOI

Cited by

Sorted by citations

Metadata

Authors
Romo-Araiza, A., Gutiérrez-Salmeán, G., Galván, E. J., Hernández-Frausto, M., Herrera-López, G., Romo-Parra, H., García-Contreras, V., Fernández-Presas, A. M., Jasso-Chávez, R., Borlongan, C. V., & Ibarra, A.
Venue
Frontiers in Aging Neuroscience
Published
2018-12-18
Volume
10
ISSN
1663-4365
Cited by
93
References
3

About these checks

Registry, retraction, Cites and statistics results are computed, not judged, with one exception: a printed reference that no index lists is read once by a model before it counts as a citation error. Claims are extracted by a model and kept only when their quote appears verbatim in the text; each cited source is then checked, with a model’s help, for whether it says what the claim relies on. Those verdicts can be wrong — read the claim’s quote and the cited source before relying on one.

Statistics and arithmetic are recomputed, not judged.

Confidence bands are shown only for fields calibrated on our annotated test set. None is calibrated yet, so no band is shown.

What counts as a claim ›How we measure confidence ›How we check this ›

Are you an author, or do you see a problem with this page? Request a review