

The DOI matches its Crossref record; 13 of the 13 references it cites were found in a registry or an index.
Plasma Extracellular Vesicles Enriched for Neuronal Origin: A Potential Window into Brain Pathologic Processes
Overview
The claims and statistics of this paper haven’t been checked yet.
Run the check — free, no account needed. It reads the open-access text and checks the sources it cites.
Integrity signals
Registry
Cites
Statistics
Figures
Verification
Claims the paper makes
The claims and statistics of this paper haven’t been checked yet.
Run the check — free, no account needed. It reads the open-access text and checks the sources it cites.
Claims other papers make about this one
Each is checked against this paper’s own text: does it say what the citing paper says it does?
The source backs part of the claim, not all of it — or backs it for a different population, condition or comparison.
In the citing paper
“Studies have shown that EVs circulating in the peripheral blood are enriched for L1 cell adhesion molecule (L1CAM), a protein found primarily in the nervous system and is used as a neuronal marker [25, 26] and astrocyte-specific glutamine aspartate transporter (GLAST) [27, 28].”
From Differential RNA packaging into small extracellular vesicles by neurons and astrocytes (2021) · cites this paper as [25]
Experimental — accuracy not yet measuredIn the citing paper
“EVs were isolated from plasma samples as previously described [28, 42].”
From miR-92a-3p and miR-320a are Upregulated in Plasma Neuron-Derived Extracellular Vesicles of Patients with Frontotemporal Dementia (2025) · cites this paper as [28]
Self-check
Percentages, sums and reported differences re-computed from the paper’s own numbers.
The self-check needs the paper’s full text.
Citations
Cites
McKhann, G. M., Knopman, D. S., Chertkow, H., Hyman, B. T., Jack, C. R., Kawas, C. H., Klunk, W. E., Koroshetz, W. J., Manly, J. J., Mayeux, R., et al. (2011) · Alzheimer's & Dementia · doi:10.1016/j.jalz.2011.03.005 · Cited by 18,657
Neuropathological stageing of Alzheimer-related changes.
Braak, H., & Braak, E. (1991) · Acta Neuropathologica · doi:10.1007/bf00308809 · Cited by 16,123 · cited 1×
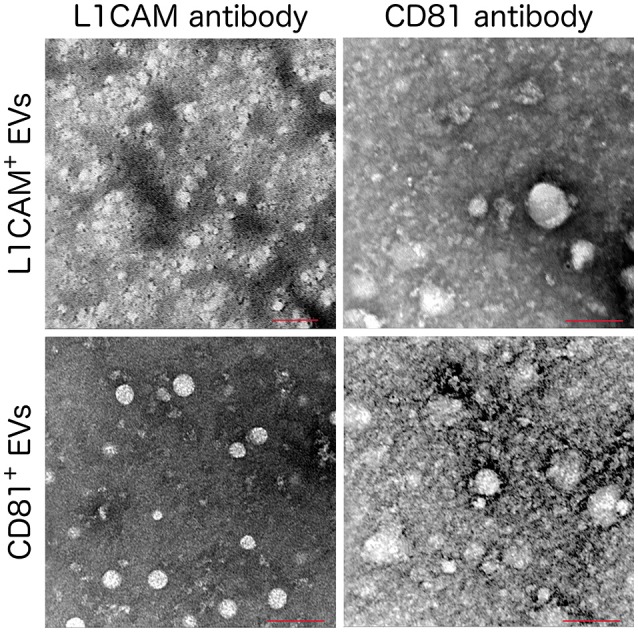
“…microscope settings; 120 kV, magnification 200,000x except the L1CAM+ labeled with anti-L1CAM (top left) which used a magnification of 160000x. hallmarks of AD (Arnold et al., 1991; Braak and Braak, 1991; Braak and Del Tredici, 2012), we first measured total tau, p-T181-tau, p-S396-tau, and Aβ42.”
MethodSperling, R. A., Aisen, P. S., Beckett, L. A., Bennett, D. A., Craft, S., Fagan, A. M., Iwatsubo, T., Jack, C. R., Kaye, J., Montine, T. J., et al. (2011) · Alzheimer's & Dementia · doi:10.1016/j.jalz.2011.03.003 · Cited by 7,155
Tumour exosome integrins determine organotropic metastasis
Hoshino, A., Costa-Silva, B., Shen, T.-L., Rodrigues, G., Hashimoto, A., Tesic Mark, M., Molina, H., Kohsaka, S., Di Giannatale, A., Ceder, S., et al. (2015) · Nature · doi:10.1038/nature15756 · Cited by 5,101
Hypothetical model of dynamic biomarkers of the Alzheimer's pathological cascade
Jack, C. R., Knopman, D. S., Jagust, W. J., Shaw, L. M., Aisen, P. S., Weiner, M. W., Petersen, R. C., & Trojanowski, J. Q. (2010) · The Lancet Neurology · doi:10.1016/s1474-4422(09)70299-6 · Cited by 4,806
Kowal, J., Arras, G., Colombo, M., Jouve, M., Morath, J. P., Primdal-Bengtson, B., Dingli, F., Loew, D., Tkach, M., & Théry, C. (2016) · Proceedings of the National Academy of Sciences · doi:10.1073/pnas.1521230113 · Cited by 3,426
Wiklander, O. P. B., Nordin, J. Z., O'Loughlin, A., Gustafsson, Y., Corso, G., Mäger, I., Vader, P., Lee, Y., Sork, H., Seow, Y., et al. (2015) · Journal of Extracellular Vesicles · doi:10.3402/jev.v4.26316 · Cited by 1,730
Arnold, S. E., Hyman, B. T., Flory, J., Damasio, A. R., & Van Hoesen, G. W. (1991) · Cerebral Cortex · doi:10.1093/cercor/1.1.103 · Cited by 1,380
Fiandaca, M. S., Kapogiannis, D., Mapstone, M., Boxer, A., Eitan, E., Schwartz, J. B., Abner, E. L., Petersen, R. C., Federoff, H. J., Miller, B. L., et al. (2015) · Alzheimer's & Dementia · doi:10.1016/j.jalz.2014.06.008 · Cited by 959
Self-citationExosomes are released by cultured cortical neurones
Fauré, J., Lachenal, G., Court, M., Hirrlinger, J., Chatellard-Causse, C., Blot, B., Grange, J., Schoehn, G., Goldberg, Y., Boyer, V., et al. (2006) · Molecular and Cellular Neuroscience · doi:10.1016/j.mcn.2005.12.003 · Cited by 896
Research works printed but not linked: 30
- Abner, 2016, Plasma neuronal exosomal levels of Alzheimer's disease biomarkers in normal aging, Ann. Clin. Transl. Neurol., 3, 399, 10.1002/acn3.309 · DOI
- Alvarez-Erviti, 2011, Delivery of siRNA to the mouse brain by systemic injection of targeted exosomes, Nat. Biotechnol., 29, 341, 10.1038/nbt.1807 · DOI · Paper page
- Bala, 2015, Biodistribution and function of extracellular miRNA-155 in mice, Sci. Rep., 5, 10721, 10.1038/srep10721 · DOI
- Bekinschtein, 2008, BDNF is essential to promote persistence of long-term memory storage, Proc. Natl. Acad. Sci. U.S.A., 105, 2711, 10.1073/pnas.0711863105 · DOI
- Bellingham, 2012, Exosomes: vehicles for the transfer of toxic proteins associated with neurodegenerative diseases?, Front. Physiol., 3, 124, 10.3389/fphys.2012.00124 · DOI · Paper page
- Braak, 2012, Where, when, and in what form does sporadic Alzheimer's disease begin?, Curr. Opin. Neurol., 25, 708, 10.1097/WCO.0b013e32835a3432 · DOI
- Chen, 2013, BEAMing and droplet digital PCR analysis of mutant IDH1 mRNA in glioma patient serum and cerebrospinal fluid extracellular vesicles, Mol. Ther. Nucleic Acids, 2, e109, 10.1038/mtna.2013.28 · DOI
- Goetzl, Low neural exosomal levels of cellular survival factors in Alzheimer's disease, Ann. Clin. Transl. Neurol., 2, 769, 10.1002/acn3.211 · DOI
- Goetzl, Altered lysosomal proteins in neural-derived plasma exosomes in preclinical Alzheimer disease, Neurology, 85, 40, 10.1212/WNL.0000000000001702 · DOI · Paper page
- Goetzl, Decreased synaptic proteins in neuronal exosomes of frontotemporal dementia and Alzheimer's disease, FASEB J., 30, 4141, 10.1096/fj.201600816R · DOI · Paper page
- Goetzl, Cargo proteins of plasma astrocyte-derived exosomes in Alzheimer's disease, FASEB J., 30, 3853, 10.1096/fj.201600756R · DOI · Paper page
- Goetzl, 2016, Novel window on early human neurodevelopment via fetal exosomes in maternal blood, Ann. Clin. Transl. Neurol., 3, 381, 10.1002/acn3.296 · DOI
- Kalia, 2016, Parkinson disease in 2015: evolving basic, pathological and clinical concepts in PD, Nat. Rev. Neurol., 12, 65, 10.1038/nrneurol.2015.249 · DOI
- Kapogiannis, 2015, Dysfunctionally phosphorylated type 1 insulin receptor substrate in neural-derived blood exosomes of preclinical Alzheimer's disease, FASEB J., 29, 589, 10.1096/fj.14-262048 · DOI
- Kapogiannis, 2014, Pathogenic proteins in neurally-derived blood exosomes as diagnostic and prognostic biomarkers for Alzheimer's disease, Ann. Neurol., 76, S92, 10.1016/j.jalz.2014.07.152 · DOI
- Kim, 2013, EVpedia: an integrated database of high-throughput data for systemic analyses of extracellular vesicles, J. Extracell. Vesicles, 2, 20384, 10.3402/jev.v2i0.20384 · DOI
- Koshimizu, 2009, Multiple functions of precursor BDNF to CNS neurons: negative regulation of neurite growth, spine formation and cell survival, Mol. Brain, 2, 27, 10.1186/1756-6606-2-27 · DOI · Paper page
- Lai, 2014, Dynamic biodistribution of extracellular vesicles in vivo using a multimodal imaging reporter, ACS Nano, 8, 483, 10.1021/nn404945r · DOI
- Marosi, 2014, BDNF mediates adaptive brain and body responses to energetic challenges, Trends Endocrinol. Metab., 25, 89, 10.1016/j.tem.2013.10.006 · DOI · Paper page
- Muller, 2014, Isolation of biologically-active exosomes from human plasma, J. Immunol. Methods, 411, 55, 10.1016/j.jim.2014.06.007 · DOI
- Murray, 2011, An overview of brain-derived neurotrophic factor and implications for excitotoxic vulnerability in the hippocampus, Int. J. Pept., 2011, 654085, 10.1155/2011/654085 · DOI
- Peterson, 2015, Integrated systems for exosome investigation, Methods, 87, 31, 10.1016/j.ymeth.2015.04.015 · DOI
- Reiman, 2012, Considerations in the design of clinical trials for cognitive aging, J. Gerontol. A Biol. Sci. Med. Sci., 67, 766, 10.1093/gerona/gls124 · DOI
- Saenz-Cuesta, 2015, Methods for extracellular vesicles isolation in a hospital setting, Front. Immunol., 6, 50, 10.3389/fimmu.2015.00050 · DOI
- Shi, 2014, Plasma exosomal alpha-synuclein is likely CNS-derived and increased in Parkinson's disease, Acta Neuropathol., 128, 639, 10.1007/s00401-014-1314-y · DOI · Paper page
- Simpson, 2012, ExoCarta as a resource for exosomal research. J. Extracell, Vesicles, 1, 18374, 10.3402/jev.v1i0.18374 · DOI
- Skog, 2008, Glioblastoma microvesicles transport RNA and proteins that promote tumour growth and provide diagnostic biomarkers, Nat. Cell Biol., 10, 1470, 10.1038/ncb1800 · DOI · Paper page
- Tauro, 2013, Two distinct populations of exosomes are released from LIM1863 colon carcinoma cell-derived organoids, Mol. Cell. Proteomics, 12, 587, 10.1074/mcp.M112.021303 · DOI
- Taylor, 2008, MicroRNA signatures of tumor-derived exosomes as diagnostic biomarkers of ovarian cancer, Gynecol. Oncol., 110, 13, 10.1016/j.ygyno.2008.04.033 · DOI
- Winston, 2016, Prediction of conversion from mild cognitive impairment to dementia with neuronally derived blood exosome protein profile, Alzheimers Dement., 3, 63, 10.1016/j.dadm.2016.04.001 · DOI
Cited by
Sorted by citations
Miranda, M., Morici, J. F., Zanoni, M. B., & Bekinschtein, P. (2019) · Frontiers in Cellular Neuroscience · doi:10.3389/fncel.2019.00363 · Cited by 1,416
Targeting and Crossing the Blood-Brain Barrier with Extracellular Vesicles
Saint-Pol, J., Gosselet, F., Duban-Deweer, S., Pottiez, G., & Karamanos, Y. (2020) · Cells · doi:10.3390/cells9040851 · Cited by 503
Challenges and hopes for Alzheimer’s disease
Tatulian, S. A. (2022) · Drug Discovery Today · doi:10.1016/j.drudis.2022.01.016 · Cited by 291
Goetzl, E. J., Abner, E. L., Jicha, G. A., Kapogiannis, D., & Schwartz, J. B. (2018) · The FASEB Journal · doi:10.1096/fj.201700731r · Cited by 219
Self-citationCicognola, C., Brinkmalm, G., Wahlgren, J., Portelius, E., Gobom, J., Cullen, N. C., Hansson, O., Parnetti, L., Constantinescu, R., Wildsmith, K., et al. (2019) · Acta Neuropathologica · doi:10.1007/s00401-018-1948-2 · Cited by 168
Incretin and insulin signaling as novel therapeutic targets for Alzheimer’s and Parkinson’s disease
Nowell, J., Blunt, E., & Edison, P. (2023) · Molecular Psychiatry · doi:10.1038/s41380-022-01792-4 · Cited by 136
Extracellular Vesicle Proteins and MicroRNAs as Biomarkers for Traumatic Brain Injury
Guedes, V. A., Devoto, C., Leete, J., Sass, D., Acott, J. D., Mithani, S., & Gill, J. M. (2020) · Frontiers in Neurology · doi:10.3389/fneur.2020.00663 · Cited by 85
Soliman, H. M., Ghonaim, G. A., Gharib, S. M., Chopra, H., Farag, A. K., Hassanin, M. H., Nagah, A., Emad-Eldin, M., Hashem, N. E., Yahya, G., et al. (2021) · International Journal of Molecular Sciences · doi:10.3390/ijms221910794 · Cited by 81
Fuller, O. K., Whitham, M., Mathivanan, S., & Febbraio, M. A. (2020) · Cells · doi:10.3390/cells9102182 · Cited by 60
Biomarkers for diseases with TDP-43 pathology
Steinacker, P., Barschke, P., & Otto, M. (2019) · Molecular and Cellular Neuroscience · doi:10.1016/j.mcn.2018.10.003 · Cited by 57
Eitan, E., Tosti, V., Suire, C. N., Cava, E., Berkowitz, S., Bertozzi, B., Raefsky, S. M., Veronese, N., Spangler, R., Spelta, F., et al. (2017) · Aging Cell · doi:10.1111/acel.12657 · Cited by 56
Self-citationExtracellular Vesicles as Novel Diagnostic and Prognostic Biomarkers for Parkinson’s Disease
Leggio, L., Paternò, G., Vivarelli, S., Falzone, G. G., Giachino, C., Marchetti, B., & Iraci, N. (2021) · Aging and disease · doi:10.14336/ad.2021.0527 · Cited by 55
Wang, X., Yang, H., Liu, C., & Liu, K. (2023) · Frontiers in Molecular Neuroscience · doi:10.3389/fnmol.2023.1194210 · Cited by 36
Alzheimer’s disease: From basic science to precision medicine approach
Forloni, G. (2020) · BMJ Neurology Open · doi:10.1136/bmjno-2020-000079 · Cited by 33
Differential RNA packaging into small extracellular vesicles by neurons and astrocytes
Luo, X., Jean-Toussaint, R., Sacan, A., & Ajit, S. K. (2021) · Cell Communication and Signaling · doi:10.1186/s12964-021-00757-4 · Cited by 32
Strawn, J. R., & Levine, A. (2020) · Biomarkers in Neuropsychiatry · doi:10.1016/j.bionps.2020.100024 · Cited by 30
Monteiro-Reis, S., Carvalho-Maia, C., Bart, G., Vainio, S. J., Pedro, J., Silva, E. R., Sales, G., Henrique, R., & Jerónimo, C. (2021) · International Journal of Molecular Sciences · doi:10.3390/ijms22063267 · Cited by 21
Li, X., Chen, J., Yang, Y., Cai, H., Ao, Z., Xing, Y., Li, K., Yang, K., Guan, W., Friend, J., et al. (2025) · Microsystems & Nanoengineering · doi:10.1038/s41378-025-00916-4 · Cited by 17
Manzini, V., Cappelletti, P., Orefice, N. S., Brentari, I., Rigby, M. J., Lo Giudice, M., Feligioni, M., Rivabene, R., Crestini, A., Manfredi, F., et al. (2025) · Molecular Neurobiology · doi:10.1007/s12035-024-04386-z · Cited by 16
A role for astrocytic miR-129-5p in frontotemporal dementia
Kaurani, L., Pradhan, R., Schröder, S., Burkhardt, S., Schuetz, A.-L., Krüger, D. M., Pena, T., Heutink, P., Sananbenesi, F., & Fischer, A. (2025) · Translational Psychiatry · doi:10.1038/s41398-025-03338-y · Cited by 10
Metadata
- Authors
- Mustapic, M., Eitan, E., Werner, J. K., Berkowitz, S. T., Lazaropoulos, M. P., Tran, J., Goetzl, E. J., & Kapogiannis, D.
- Venue
- Frontiers in Neuroscience
- Publisher
- Frontiers Media SA
- Published
- 2017-05-22
- Volume
- 11
- ISSN
- 1662-453X
- PMC
- PMC5439289
- Cited by
- 441
- References
- 13
About these checks
Registry, retraction, Cites and statistics results are computed, not judged, with one exception: a printed reference that no index lists is read once by a model before it counts as a citation error. Claims are extracted by a model and kept only when their quote appears verbatim in the text; each cited source is then checked, with a model’s help, for whether it says what the claim relies on. Those verdicts can be wrong — read the claim’s quote and the cited source before relying on one.
Statistics and arithmetic are recomputed, not judged.
Confidence bands are shown only for fields calibrated on our annotated test set. None is calibrated yet, so no band is shown.
What counts as a claim ›How we measure confidence ›How we check this ›
Are you an author, or do you see a problem with this page? Request a review
