

The DOI matches its Crossref record; 11 of the 11 references it cites were found in a registry or an index.
miRNA-Based Rapid Differentiation of Purified Neurons from hPSCs Advancestowards Quick Screening for Neuronal Disease Phenotypes In Vitro
Abstract
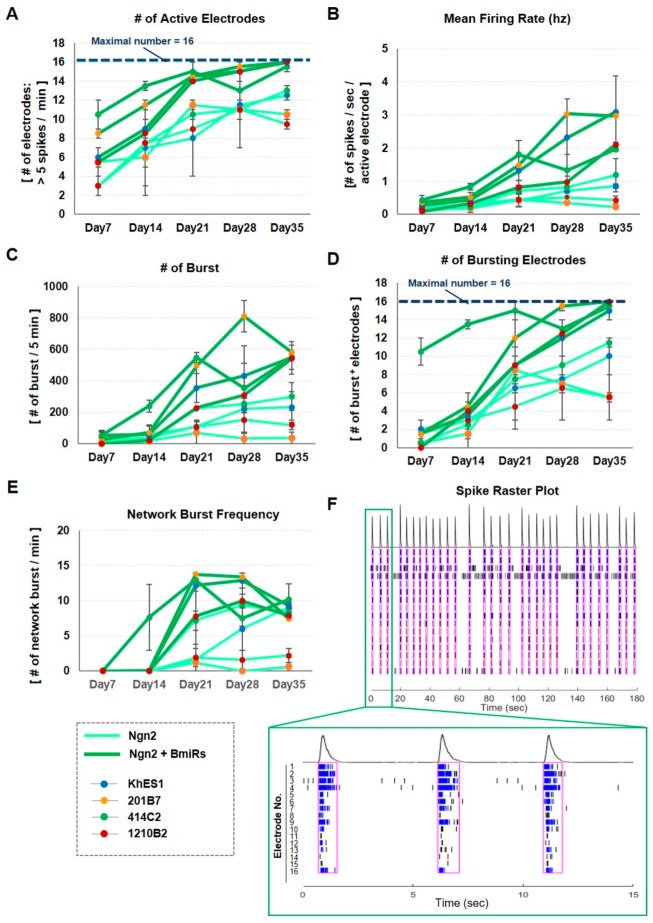
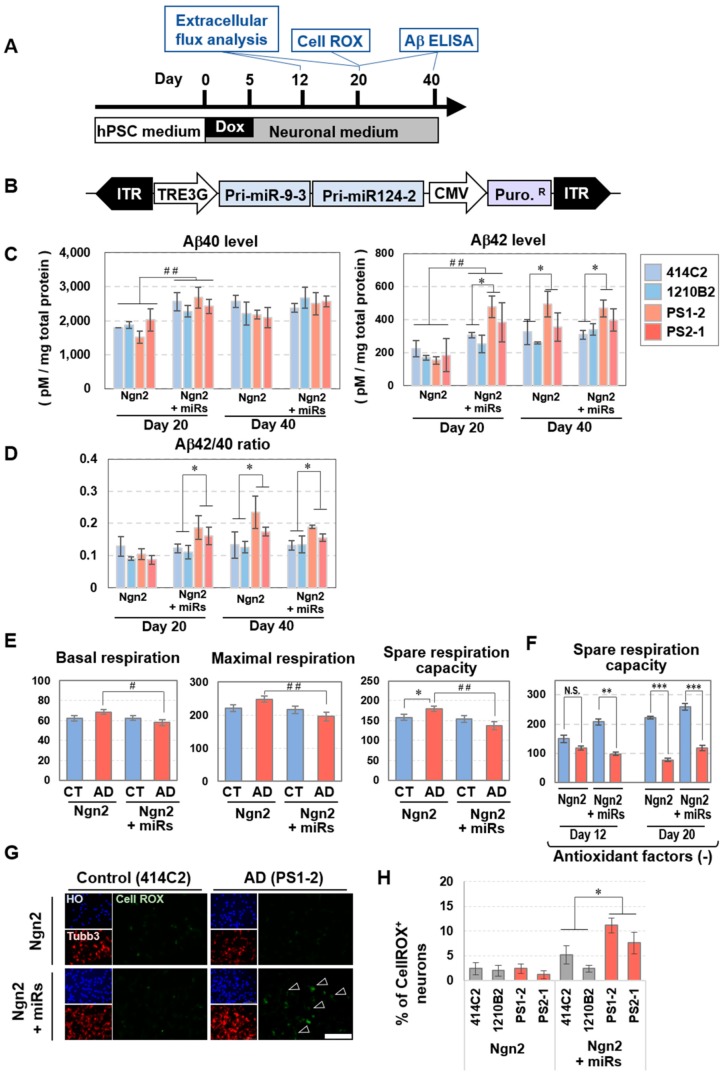
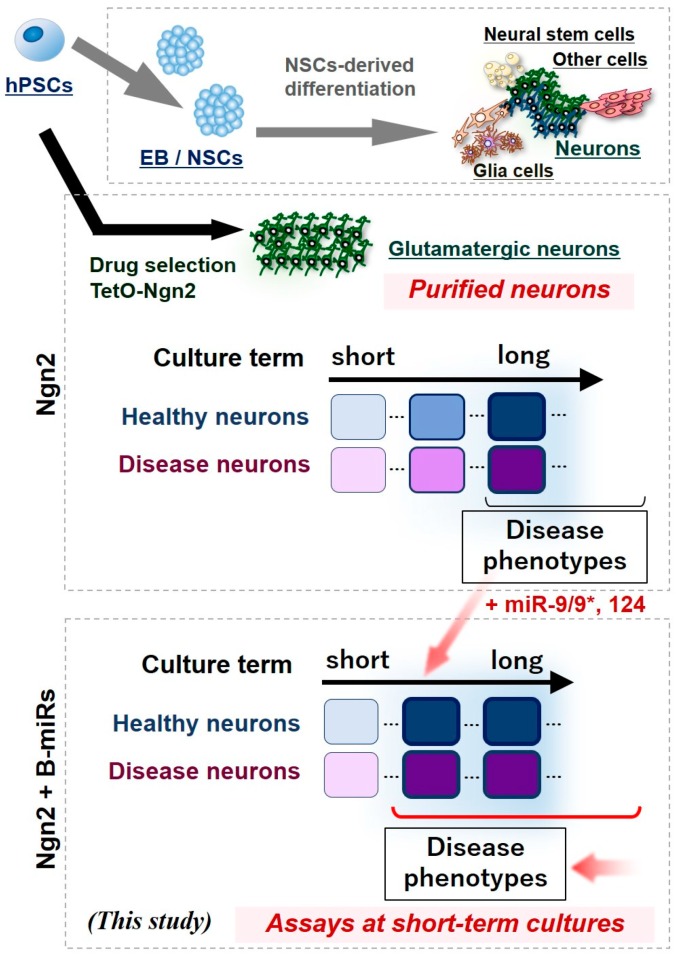
Obtaining differentiated cells with high physiological functions by an efficient, but simple and rapid differentiation method is crucial for modeling neuronal diseases in vitro using human pluripotent stem cells (hPSCs). Currently, methods involving the transient expression of one or a couple of transcription factors have been established as techniques for inducing neuronal differentiation in a rapid, single step. It has also been reported that microRNAs can function as reprogramming effectors for directly reprogramming human dermal fibroblasts to neurons. In this study, we tested the effect of adding neuronal microRNAs, miRNA-9/9*, and miR-124 (miR-9/9*-124), for the neuronal induction method of hPSCs using Tet-On-driven expression of the Neurogenin2 gene (Ngn2), a proneural factor. While it has been established that Ngn2 can facilitate differentiation from pluripotent stem cells into neurons with high purity due to its neurogenic effect, a long or indefinite time is required for neuronal maturation with Ngn2 misexpression alone. With the present method, the cells maintained a high neuronal differentiation rate while exhibiting increased gene expression of neuronal maturation markers, spontaneous calcium oscillation, and high electrical activity with network bursts as assessed by a multipoint electrode system. Moreover, when applying this method to iPSCs from Alzheimer’s disease (AD) patients with presenilin-1 (PS1) or presenilin-2 (PS2) mutations, cellular phenotypes such as increased amount of extracellular secretion of amyloid β42, abnormal oxygen consumption, and increased reactive oxygen species in the cells were observed in a shorter culture period than those previously reported. Therefore, it is strongly anticipated that the induction method combining Ngn2 and miR-9/9*-124 will enable more rapid and simple screening for various types of neuronal disease phenotypes and promote drug discovery.
Overview
The claims and statistics of this paper haven’t been checked yet.
Run the check — free, no account needed. It reads the open-access text and checks the sources it cites.
Integrity signals
Registry
Cites
Statistics
Figures
Verification
Claims the paper makes
The claims and statistics of this paper haven’t been checked yet.
Run the check — free, no account needed. It reads the open-access text and checks the sources it cites.
Claims other papers make about this one
Each is checked against this paper’s own text: does it say what the citing paper says it does?
The source backs part of the claim, not all of it — or backs it for a different population, condition or comparison.
In the citing paper
“These neurons converted from iPSCs could be used for disease diagnosis, drug screening and in disease model studies [98].”
From MicroRNAs in Extracellular Vesicles of Alzheimer’s Disease (2023) · cites this paper as [98]
Experimental — accuracy not yet measuredIn the citing paper
“Ishikawa et al. [98] also achieved a rapid differentiation of neurons from human pluripotent stem cells (iPSCs) through the Neurogenin2 gene, miR-9-5p and miR-124.”
From MicroRNAs in Extracellular Vesicles of Alzheimer’s Disease (2023) · cites this paper as [98]
Self-check
Percentages, sums and reported differences re-computed from the paper’s own numbers.
The self-check needs the paper’s full text.
Citations
Cites
Direct conversion of fibroblasts to functional neurons by defined factors
Vierbuchen, T., Ostermeier, A., Pang, Z. P., Kokubu, Y., Südhof, T. C., & Wernig, M. (2010) · Nature · doi:10.1038/nature08797 · Cited by 3,017
Assembly of functionally integrated human forebrain spheroids
Birey, F., Andersen, J., Makinson, C. D., Islam, S., Wei, W., Huber, N., Fan, H. C., Metzler, K. R. C., Panagiotakos, G., Thom, N., et al. (2017) · Nature · doi:10.1038/nature22330 · Cited by 1,365
Kadoshima, T., Sakaguchi, H., Nakano, T., Soen, M., Ando, S., Eiraku, M., & Sasai, Y. (2013) · Proceedings of the National Academy of Sciences · doi:10.1073/pnas.1315710110 · Cited by 999
Kondo, T., Asai, M., Tsukita, K., Kutoku, Y., Ohsawa, Y., Sunada, Y., Imamura, K., Egawa, N., Yahata, N., Okita, K., et al. (2013) · Cell Stem Cell · doi:10.1016/j.stem.2013.01.009 · Cited by 741
Nakagawa, M., Taniguchi, Y., Senda, S., Takizawa, N., Ichisaka, T., Asano, K., Morizane, A., Doi, D., Takahashi, J., Nishizawa, M., et al. (2014) · Scientific Reports · doi:10.1038/srep03594 · Cited by 673
Modeling familial Alzheimer's disease with induced pluripotent stem cells
Yagi, T., Ito, D., Okada, Y., Akamatsu, W., Nihei, Y., Yoshizaki, T., Yamanaka, S., Okano, H., & Suzuki, N. (2011) · Human Molecular Genetics · doi:10.1093/hmg/ddr394 · Cited by 599
Self-citationGeneration of Human Striatal Neurons by MicroRNA-Dependent Direct Conversion of Fibroblasts
Victor, M. B., Richner, M., Hermanstyne, T. O., Ransdell, J. L., Sobieski, C., Deng, P.-Y., Klyachko, V. A., Nerbonne, J. M., & Yoo, A. S. (2014) · Neuron · doi:10.1016/j.neuron.2014.10.016 · Cited by 295
Self-citationHippocampal MicroRNA-124 Enhances Chronic Stress Resilience in Mice
Higuchi, F., Uchida, S., Yamagata, H., Abe-Higuchi, N., Hobara, T., Hara, K., Kobayashi, A., Shintaku, T., Itoh, Y., Suzuki, T., et al. (2016) · Journal of Neuroscience · doi:10.1523/jneurosci.0319-16.2016 · Cited by 158
Abernathy, D. G., Kim, W. K., McCoy, M. J., Lake, A. M., Ouwenga, R., Lee, S. W., Xing, X., Li, D., Lee, H. J., Heuckeroth, R. O., et al. (2017) · Cell Stem Cell · doi:10.1016/j.stem.2017.08.002 · Cited by 145
Self-citationDysregulation of miRNA-9 in a Subset of Schizophrenia Patient-Derived Neural Progenitor Cells
Topol, A., Zhu, S., Hartley, B. J., English, J., Hauberg, M. E., Tran, N., Rittenhouse, C. A., Simone, A., Ruderfer, D. M., Johnson, J., et al. (2016) · Cell Reports · doi:10.1016/j.celrep.2016.03.090 · Cited by 122
Research works printed but not linked: 57
- Takahashi, 2007, Induction of pluripotent stem cells from adult human fibroblasts by defined factors, Cell, 131, 861, 10.1016/j.cell.2007.11.019 · DOI · Paper page
- Okano, 2014, iPS cell technologies: Significance and applications to CNS regeneration and disease, Mol. Brain, 7, 22, 10.1186/1756-6606-7-22 · DOI
- Imaizumi, 2014, Modeling human neurological disorders with induced pluripotent stem cells, J. Neurochem., 129, 388, 10.1111/jnc.12625 · DOI
- Chambers, 2009, Highly efficient neural conversion of human ES and iPS cells by dual inhibition of SMAD signaling, Nat. Biotechnol., 27, 275, 10.1038/nbt.1529 · DOI · Paper page
- Imaizumi, 2015, Controlling the Regional Identity of hPSC-Derived Neurons to Uncover Neuronal Subtype Specificity of Neurological Disease Phenotypes, Stem Cell Rep., 5, 1010, 10.1016/j.stemcr.2015.10.005 · DOI
- Matsumoto, 2016, Functional Neurons Generated from T Cell-Derived Induced Pluripotent Stem Cells for Neurological Disease Modeling, Stem Cell Rep., 6, 422, 10.1016/j.stemcr.2016.01.010 · DOI
- Fujimori, 2017, Escape from Pluripotency via Inhibition of TGF-β/BMP and Activation of Wnt Signaling Accelerates Differentiation and Aging in hPSC Progeny Cells, Stem Cell Rep., 9, 1675, 10.1016/j.stemcr.2017.09.024 · DOI
- Zhang, 2013, Rapid single-step induction of functional neurons from human pluripotent stem cells, Neuron, 78, 785, 10.1016/j.neuron.2013.05.029 · DOI · Paper page
- Nakamoto, 2018, The pathogenesis linked to coenzyme Q10 insufficiency in iPSC-derived neurons from patients with multiple-system atrophy, Sci. Rep., 8, 14215, 10.1038/s41598-018-32573-1 · DOI
- Ishii, 2019, In vitro Modeling of the Bipolar Disorder and Schizophrenia Using Patient-Derived Induced Pluripotent Stem Cells with Copy Number Variations of PCDH15 and RELN, eNeuro, 6, 2019, 10.1523/ENEURO.0403-18.2019 · DOI
- Mertens, 2016, Evaluating cell reprogramming, differentiation and conversion technologies in neuroscience, Nat. Rev. Neurosci., 17, 424, 10.1038/nrn.2016.46 · DOI
- Nehme, 2018, Combining NGN2 Programming with Developmental Patterning Generates Human Excitatory Neurons with NMDAR-Mediated Synaptic Transmission, Cell Rep., 23, 2509, 10.1016/j.celrep.2018.04.066 · DOI
- Coolen, 2009, MicroRNAs in brain development and physiology, Curr. Opin. Neurobiol., 19, 461, 10.1016/j.conb.2009.09.006 · DOI
- Lu, Y.L., and Yoo, A.S. (2018). Mechanistic Insights into MicroRNA-Induced Neuronal Reprogramming of Human Adult Fibroblasts. Front. Neurosci. · DOI
- Lee, 2018, MicroRNAs Overcome Cell Fate Barrier by Reducing EZH2-Controlled REST Stability during Neuronal Conversion of Human Adult Fibroblasts, Dev. Cell, 46, 73, 10.1016/j.devcel.2018.06.007 · DOI · Paper page
- Lessard, 2007, An essential switch in subunit composition of a chromatin remodeling complex during neural development, Neuron, 55, 201, 10.1016/j.neuron.2007.06.019 · DOI · Paper page
- Yoo, 2009, MicroRNA-mediated switching of chromatin-remodelling complexes in neural development, Nature, 460, 642, 10.1038/nature08139 · DOI · Paper page
- Wu, 2007, Regulation of dendritic development by neuron-specific chromatin remodeling complexes, Neuron, 56, 94, 10.1016/j.neuron.2007.08.021 · DOI
- Staahl, 2013, Creating a neural specific chromatin landscape by npBAF and nBAF complexes, Curr. Opin. Neurobiol., 23, 903, 10.1016/j.conb.2013.09.003 · DOI
- Yoo, 2011, MicroRNA-mediated conversion of human fibroblasts to neurons, Nature, 476, 228, 10.1038/nature10323 · DOI · Paper page
- Richner, 2015, MicroRNA-based conversion of human fibroblasts into striatal medium spiny neurons, Nat. Protoc., 10, 1543, 10.1038/nprot.2015.102 · DOI
- Maryanovich, 2013, A ROS rheostat for cell fate regulation, Trends Cell Biol., 23, 129, 10.1016/j.tcb.2012.09.007 · DOI
- Suemori, 2006, Efficient establishment of human embryonic stem cell lines and long-term maintenance with stable karyotype by enzymatic bulk passage, Biochem. Biophys. Res. Commun., 345, 926, 10.1016/j.bbrc.2006.04.135 · DOI
- Okita, 2011, A more efficient method to generate integration-free human iPS cells, Nat. Methods, 8, 409, 10.1038/nmeth.1591 · DOI · Paper page
- Miyazaki, 2017, Efficient Adhesion Culture of Human Pluripotent Stem Cells Using Laminin Fragments in an Uncoated Manner, Sci. Rep., 7, 41165, 10.1038/srep41165 · DOI
- Matsushita, 2017, Neural differentiation of human embryonic stem cells induced by the transgene-mediated overexpression of single transcription factors, Biochem. Biophys. Res. Commun., 490, 296, 10.1016/j.bbrc.2017.06.039 · DOI
- Sone, 2012, Methods for constructing clones for protein expression in mammalian cells, Methods Mol. Biol., 801, 227, 10.1007/978-1-61779-352-3_15 · DOI
- Iida, 2017, Whole-Genome DNA Methylation Analyses Revealed Epigenetic Instability in Tumorigenic Human iPS Cell-Derived Neural Stem/Progenitor Cells, Stem Cells, 35, 1316, 10.1002/stem.2581 · DOI
- Magnani, E., Bartling, L., and Hake, S. (2006). From Gateway to MultiSite Gateway in one recombination event. BMC Mol. Biol., 7. · DOI
- Kurokawa, 2008, Visualizing spatiotemporal dynamics of multicellular cell-cycle progression, Cell, 132, 487, 10.1016/j.cell.2007.12.033 · DOI
- Sho, M., Ichiyanagi, N., Imaizumi, K., Ishikawa, M., Morimoto, S., Watanabe, H., and Okano, H. (2019). A combinational treatment of carotenoids decreases Aβ secretion in human neurons via β-secretase inhibition. Neurosci. Res. · DOI
- Wilkins, 2018, Application of Metabolomics in Alzheimer’s Disease, Front. Neurol., 8, 719, 10.3389/fneur.2017.00719 · DOI · Paper page
- Flannery, 2019, Mitochondrial dynamics and transport in Alzheimer’s disease, Mol. Cell Neurosci., 98, 109, 10.1016/j.mcn.2019.06.009 · DOI
- Cadonic, 2016, Mechanisms of Mitochondrial Dysfunction in Alzheimer’s Disease, Mol. Neurobiol., 53, 6078, 10.1007/s12035-015-9515-5 · DOI · Paper page
- Imamura, 2016, Calcium dysregulation contributes to neurodegeneration in FTLD patient iPSC-derived neurons, Sci. Rep., 6, 34904, 10.1038/srep34904 · DOI
- Nakamura, 2019, Pathological Progression Induced by the Frontotemporal Dementia-Associated R406W Tau Mutation in Patient-Derived iPSCs, Stem Cell Rep., 13, 684, 10.1016/j.stemcr.2019.08.011 · DOI
- Imaizumi, 2012, Mitochondrial dysfunction associated with increased oxidative stress and α-synuclein accumulation in PARK2 iPSC-derived neurons and postmortem brain tissue, Mol. Brain, 5, 35, 10.1186/1756-6606-5-35 · DOI
- Tabata, 2018, T-type Calcium Channels Determine the Vulnerability of Dopaminergic Neurons to Mitochondrial Stress in Familial Parkinson Disease, Stem Cell Rep., 11, 1171, 10.1016/j.stemcr.2018.09.006 · DOI
- Ichiyanagi, 2016, Establishment of In Vitro FUS-Associated Familial Amyotrophic Lateral Sclerosis Model Using Human Induced Pluripotent Stem Cells, Stem Cell Rep., 6, 496, 10.1016/j.stemcr.2016.02.011 · DOI
- Fujimori, 2018, Modeling sporadic ALS in iPSC-derived motor neurons identifies a potential therapeutic agent, Nat. Med., 24, 1579, 10.1038/s41591-018-0140-5 · DOI · Paper page
- Akiyama, 2019, Aberrant axon branching via Fos-B dysregulation in FUS-ALS motor neurons, EBioMedicine, 45, 362, 10.1016/j.ebiom.2019.06.013 · DOI
- Imamura, 2017, The Src/c-Abl pathway is a potential therapeutic target in amyotrophic lateral sclerosis, Sci. Transl. Med., 9, eaaf3962, 10.1126/scitranslmed.aaf3962 · DOI
- Berninger, 2007, Functional properties of neurons derived from in vitro reprogrammed postnatal astroglia, J. Neurosci., 27, 8654, 10.1523/JNEUROSCI.1615-07.2007 · DOI
- Murenu, 2016, Identification and Successful Negotiation of a Metabolic Checkpoint in Direct Neuronal Reprogramming, Cell Stem Cell, 18, 396, 10.1016/j.stem.2015.12.003 · DOI
- Giusti, 2014, MicroRNA-9 controls dendritic development by targeting REST, Elife, 3, e02755, 10.7554/eLife.02755 · DOI · Paper page
- Bonev, 2012, microRNA-9 regulates axon extension and branching by targeting Map1b in mouse cortical neurons, Nat. Neurosci., 15, 697, 10.1038/nn.3082 · DOI
- Hou, 2015, MicroRNA miR124 is required for the expression of homeostatic synaptic plasticity, Nat. Commun., 6, 10045, 10.1038/ncomms10045 · DOI
- Madelaine, 2017, MicroRNA-9 Couples Brain Neurogenesis and Angiogenesis, Cell Rep., 20, 1533, 10.1016/j.celrep.2017.07.051 · DOI
- Tsunemoto, 2018, Diverse reprogramming codes for neuronal identity, Nature, 557, 375, 10.1038/s41586-018-0103-5 · DOI
- Victor, 2018, Striatal neurons directly converted from Huntington’s disease patient fibroblasts recapitulate age-associated disease phenotypes, Nat. Neurosci., 21, 341, 10.1038/s41593-018-0075-7 · DOI · Paper page
- Seki, 2010, Generation of induced pluripotent stem cells from human terminally differentiated circulating T cells, Cell Stem Cell, 7, 11, 10.1016/j.stem.2010.06.003 · DOI · Paper page
- Fujimori, 2016, Modeling neurological diseases with induced pluripotent cells reprogrammed from immortalized lymphoblastoid cell lines, Mol. Brain, 9, 88, 10.1186/s13041-016-0267-6 · DOI
- Nakazawa, 2017, Differential gene expression profiles in neurons generated from lymphoblastoid B-cell line-derived iPS cells from monozygotic twin cases with treatment-resistant schizophrenia and discordant responses to clozapine, Schizophr. Res., 181, 75, 10.1016/j.schres.2016.10.012 · DOI
- Pang, 2011, Induction of human neuronal cells by defined transcription factors, Nature, 476, 220, 10.1038/nature10202 · DOI
- Tanabe, 2018, Transdifferentiation of human adult peripheral blood T cells into neurons, Proc. Natl. Acad. Sci. USA, 115, 6470, 10.1073/pnas.1720273115 · DOI
- Lancaster, 2013, Cerebral organoids model human brain development and microcephaly, Nature, 501, 373, 10.1038/nature12517 · DOI · Paper page
- Mansour, 2018, An in vivo model of functional and vascularized human brain organoids, Nat. Biotechnol., 36, 432, 10.1038/nbt.4127 · DOI · Paper page
Cited by
Sorted by citations
MicroRNAs in Extracellular Vesicles of Alzheimer’s Disease
Li, W., & Zheng, Y. (2023) · Cells · doi:10.3390/cells12101378 · Cited by 43
Metadata
- Authors
- Ishikawa, M., Aoyama, T., Shibata, S., Sone, T., Miyoshi, H., Watanabe, H., Nakamura, M., Morota, S., Uchino, H., Yoo, A. S., & Okano, H.
- Affiliations
- Department of Physiology, Keio University School of Medicine, 35 Shinanomachi, Shinjuku-ku, Tokyo 160-8582, Japan
- Department of Anesthesiology, Tokyo Medical University, 6-7-1 Nishishinjuku, Shinjuku-ku, Tokyo 160-0023, Japan
- Department of Developmental Biology, Washington University School of Medicine, St. Louis, MO 63110, USA
- ORCID
- Sone, Takefumi
- Venue
- Cells
- Publisher
- MDPI AG
- Published
- 2020-02-25
- Volume
- 9
- Issue
- 3
- Pages
- 532
- ISSN
- 2073-4409
- PMC
- PMC7140514
- Cited by
- 36
- References
- 11
- Language
- en
- Funders
- Japan Agency for Medical Research and Development (17bm0804014h0101, 18bm0804014h0102, 19bm0804014h0103, 15bm0609003h0004, 16bm0609003h0005, 17bm0609003h0006, 17bm0804003h0001, 18bm0804003h0002, 19bm0804003h0003, 15bk0104027h003, 16bk0104016h0004, 17bk0104016h0005)
- Japan Society for the Promotion of Science (JP1710083, JP26830018)
About these checks
Registry, retraction, Cites and statistics results are computed, not judged, with one exception: a printed reference that no index lists is read once by a model before it counts as a citation error. Claims are extracted by a model and kept only when their quote appears verbatim in the text; each cited source is then checked, with a model’s help, for whether it says what the claim relies on. Those verdicts can be wrong — read the claim’s quote and the cited source before relying on one.
Statistics and arithmetic are recomputed, not judged.
Confidence bands are shown only for fields calibrated on our annotated test set. None is calibrated yet, so no band is shown.
What counts as a claim ›How we measure confidence ›How we check this ›
Are you an author, or do you see a problem with this page? Request a review
How to cite
Cite CoChat for the checks on this page, and the paper for its own findings.
- This page
- CoChat. (2026). Citation check: miRNA-Based Rapid Differentiation of Purified Neurons from hPSCs Advancestowards Quick Screening for Neuronal Disease Phenotypes In Vitro. https://app.cochat.ai/papers/10.3390/cells9030532
- The paper
- Ishikawa, M., Aoyama, T., Shibata, S., Sone, T., Miyoshi, H., Watanabe, H., Nakamura, M., Morota, S., Uchino, H., Yoo, A. S., & Okano, H. (2020). miRNA-Based Rapid Differentiation of Purified Neurons from hPSCs Advancestowards Quick Screening for Neuronal Disease Phenotypes In Vitro. Cells. https://doi.org/10.3390/cells9030532
