

System Integrated Information
Open accessThe DOI matches its Crossref record; 24 of the 25 references it cites were found in a registry or an index, and 1 are not checked yet.
Abstract
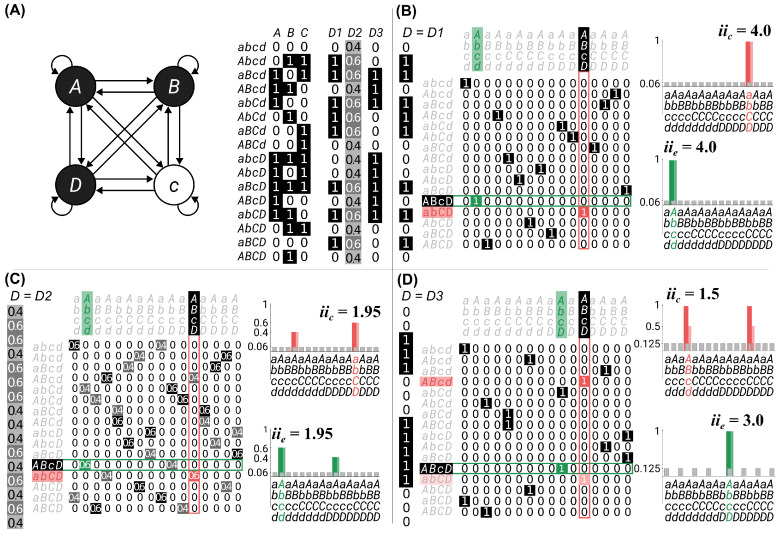
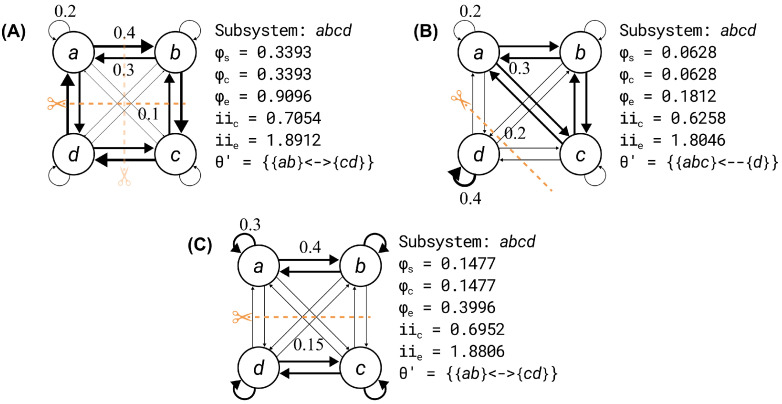
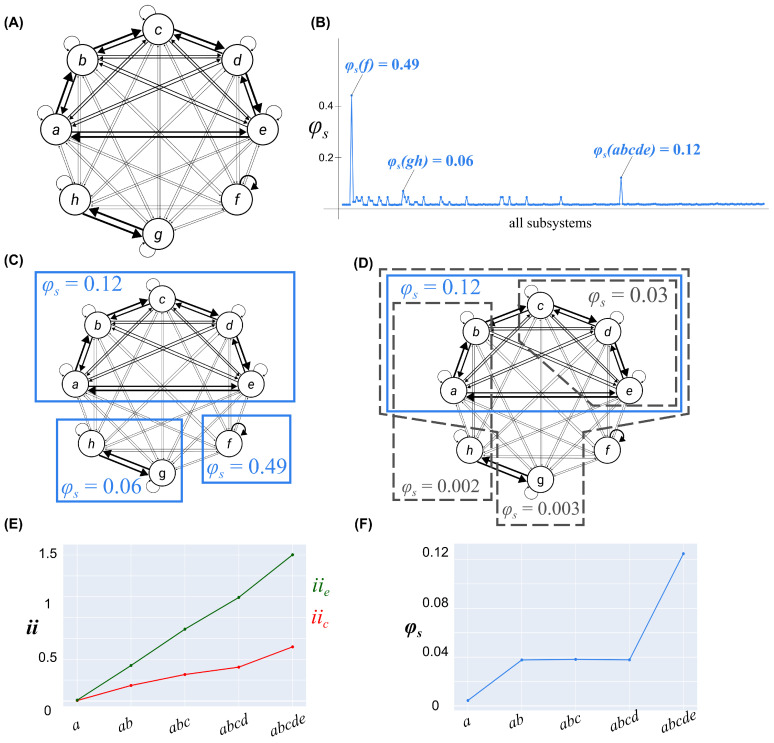
Integrated information theory (IIT) starts from consciousness itself and identifies a set of properties (axioms) that are true of every conceivable experience. The axioms are translated into a set of postulates about the substrate of consciousness (called a complex), which are then used to formulate a mathematical framework for assessing both the quality and quantity of experience. The explanatory identity proposed by IIT is that an experience is identical to the cause–effect structure unfolded from a maximally irreducible substrate (a Φ-structure). In this work we introduce a definition for the integrated information of a system (φs) that is based on the existence, intrinsicality, information, and integration postulates of IIT. We explore how notions of determinism, degeneracy, and fault lines in the connectivity impact system-integrated information. We then demonstrate how the proposed measure identifies complexes as systems, the φs of which is greater than the φs of any overlapping candidate systems.
Overview
The claims and statistics of this paper haven’t been checked yet.
Free: it reads the open-access text and checks the first 5 claims that cite a source we can check. Create a free account to check every claim.
Integrity signals
Registry
Cites
Statistics
Figures
Verification
Claims the paper makes
The claims and statistics of this paper haven’t been checked yet.
Free: it reads the open-access text and checks the first 5 claims that cite a source we can check. Create a free account to check every claim.
Claims other papers make about this one
Each is checked against this paper’s own text: does it say what the citing paper says it does?
The source backs part of the claim, not all of it — or backs it for a different population, condition or comparison.
In the citing paper
“For example, as shown in [13], the MIP will correctly identify the fault line dividing a system into two large subsets of units linked through a few interconnected units (a “bridge”), rather than defaulting to partitions between individual units and the rest of the system.”
From Integrated information theory (IIT) 4.0: Formulating the properties of phenomenal existence in physical terms (2023) · cites this paper as [13]
Experimental — accuracy not yet measuredThe source backs part of the claim, not all of it — or backs it for a different population, condition or comparison.
In the citing paper
“As described in [13], this recursive search for maximal substrates “condenses” the universe U0 in state into a disjoint (non-overlapping) and exhaustive set of complexes—the first complex, second complex, and so on.”
From Integrated information theory (IIT) 4.0: Formulating the properties of phenomenal existence in physical terms (2023) · cites this paper as [13]
Experimental — accuracy not yet measuredThe cited source says what the claim attributes to it.
In the citing paper
“As proven in [13], the maximal value of for a given partition θ is the normalization factor , which corresponds to the maximal possible number of “connections” (pairwise interactions) affected by θ.”
From Integrated information theory (IIT) 4.0: Formulating the properties of phenomenal existence in physical terms (2023) · cites this paper as [13]
Experimental — accuracy not yet measuredThe cited source says what the claim attributes to it.
In the citing paper
“Integrated information is highly sensitive to the presence of fault lines—partitions that separate parts of a system that interact weakly or directionally [13].”
From Integrated information theory (IIT) 4.0: Formulating the properties of phenomenal existence in physical terms (2023) · cites this paper as [13]
The cited source says what the claim attributes to it.
In the citing paper
“In turn, degeneracy decreases the probability of the selected cause state because it implies that multiple states can lead to the same state, even in a deterministic system.”
From Integrated information theory (IIT) 4.0: Formulating the properties of phenomenal existence in physical terms (2023) · cites this paper as [13]
2 more claims about this paper
Create a free account to see every claim other papers make about this one.
Self-check
Percentages, sums and reported differences re-computed from the paper’s own numbers.
The self-check needs the paper’s full text.
Citations
Cites
An information integration theory of consciousness
Tononi, G. (2004) · BMC Neuroscience · doi:10.1186/1471-2202-5-42 · Cited by 1,958 · cited 1×
“The mathematical formulation of IIT has been refined and developed over time, with the goal of fully and accurately capturing the postulates [4,7,8].”
MethodSelf-citationIntegrated information theory: from consciousness to its physical substrate
Tononi, G., Boly, M., Massimini, M., & Koch, C. (2016) · Nature Reviews Neuroscience · doi:10.1038/nrn.2016.44 · Cited by 1,727
Self-citationFrom the phenomenology to the mechanisms of consciousness: integrated information theory 3.0
Oizumi, M., Albantakis, L., & Tononi, G. (2014) · PLoS Computational Biology · doi:10.1371/journal.pcbi.1003588 · Cited by 1,128
Self-citationConsciousness: here, there and everywhere?
Tononi, G., & Koch, C. (2015) · Philosophical Transactions of the Royal Society B: Biological Sciences · doi:10.1098/rstb.2014.0167 · Cited by 811
Self-citationMeasures of degeneracy and redundancy in biological networks
Tononi, G., Sporns, O., & Edelman, G. M. (1999) · Proceedings of the National Academy of Sciences · doi:10.1073/pnas.96.6.3257 · Cited by 632
Self-citationIntegrated information in discrete dynamical systems: motivation and theoretical framework
Balduzzi, D., & Tononi, G. (2008) · PLoS Computational Biology · doi:10.1371/journal.pcbi.1000091 · Cited by 419 · cited 1×
“The mathematical formulation of IIT has been refined and developed over time, with the goal of fully and accurately capturing the postulates [5,7,8].”
MethodSelf-citationQuantifying causal emergence shows that macro can beat micro
Hoel, E. P., Albantakis, L., & Tononi, G. (2013) · Proceedings of the National Academy of Sciences · doi:10.1073/pnas.1314922110 · Cited by 378
Self-citationTononi, G. (2015) · Scholarpedia · doi:10.4249/scholarpedia.4164 · Cited by 188
Self-citationWhy Does Space Feel the Way it Does? Towards a Principled Account of Spatial Experience
Haun, A., & Tononi, G. (2019) · Entropy · doi:10.3390/e21121160 · Cited by 143 · cited 1×
“Moreover, there is now an explicit assessment of the causal relations among the distinctions specified by a system, as required by composition [10].”
BackgroundSelf-citationCan the macro beat the micro? Integrated information across spatiotemporal scales
Hoel, E. P., Albantakis, L., Marshall, W., & Tononi, G. (2016) · Neuroscience of Consciousness · doi:10.1093/nc/niw012 · Cited by 140
Self-citationIntegrated Information Increases with Fitness in the Evolution of Animats
Edlund, J. A., Chaumont, N., Hintze, A., Koch, C., Tononi, G., & Adami, C. (2011) · PLoS Computational Biology · doi:10.1371/journal.pcbi.1002236 · Cited by 124
Self-citationPyPhi: A toolbox for integrated information theory
Mayner, W. G. P., Marshall, W., Albantakis, L., Findlay, G., Marchman, R., & Tononi, G. (2018) · PLOS Computational Biology · doi:10.1371/journal.pcbi.1006343 · Cited by 118
Self-citationAlbantakis, L., Hintze, A., Koch, C., Adami, C., & Tononi, G. (2014) · PLoS Computational Biology · doi:10.1371/journal.pcbi.1003966 · Cited by 101
Self-citationBlack-boxing and cause-effect power
Marshall, W., Albantakis, L., & Tononi, G. (2018) · PLOS Computational Biology · doi:10.1371/journal.pcbi.1006114 · Cited by 73
Self-citationMechanism Integrated Information
Barbosa, L. S., Marshall, W., Albantakis, L., & Tononi, G. (2021) · Entropy · doi:10.3390/e23030362 · Cited by 72 · cited 3×
“Recently, the mathematical framework has been updated by introducing a measure that uniquely satisfies the postulates of existence, intrinsicality, and information [6,9].”
BackgroundSelf-citationWhat caused what? A quantitative account of actual causation using dynamical causal networks
Albantakis, L., Marshall, W., Hoel, E., & Tononi, G. (2019) · Entropy · doi:10.3390/e21050459 · Cited by 67 · cited 1×
“The use of a uniform distribution of intervention states is required to accurately capture its full cause-effect power [11,12].”
BackgroundSelf-citationHow causal analysis can reveal autonomy in models of biological systems
Marshall, W., Kim, H., Walker, S. I., Tononi, G., & Albantakis, L. (2017) · Philosophical Transactions of the Royal Society A: Mathematical, Physical and Engineering Sciences · doi:10.1098/rsta.2016.0358 · Cited by 64
Self-citationA measure for intrinsic information
Barbosa, L. S., Marshall, W., Streipert, S., Albantakis, L., & Tononi, G. (2020) · Scientific Reports · doi:10.1038/s41598-020-75943-4 · Cited by 42
Self-citationIntegrated world modeling theory expanded: Implications for the future of consciousness
Safron, A. (2022) · Frontiers in Computational Neuroscience · doi:10.3389/fncom.2022.642397 · Cited by 34
The Minimal Complexity of Adapting Agents Increases with Fitness
Joshi, N. J., Tononi, G., & Koch, C. (2013) · PLoS Computational Biology · doi:10.1371/journal.pcbi.1003111 · Cited by 32
Self-citationCausal composition: Structural differences among dynamically equivalent systems
Albantakis, L., & Tononi, G. (2019) · Entropy · doi:10.3390/e21100989 · Cited by 30 · cited 1×
“The use of a uniform distribution of intervention states is required to accurately capture its full cause–effect power [11,12].”
BackgroundSelf-citationAlbantakis, L. (2020) · Routledge eBooks · doi:10.4324/9781315205267-6 · Cited by 19
Self-citationOlesen, C., Waade, P. T., Albantakis, L., & Mathys, C. D. (2023) · PLoS Computational Biology · doi:10.1371/journal.pcbi.1011346 · Cited by 17
Self-citationAlbantakis, L., Barbosa, L. S., Findlay, G., et al. (2022) · arXiv (Cornell University) · doi:10.48550/arxiv.2212.14787 · Cited by 15
Self-citationOlesen, C., Waade, P. T., Albantakis, L., & Mathys, C. D. (2020) · doi:10.31234/osf.io/qjrcu · Cited by 4
Self-citation
Cited by
Albantakis, L., Barbosa, L., Findlay, G., Grasso, M., Haun, A. M., Marshall, W., Mayner, W. G. P., Zaeemzadeh, A., Boly, M., Juel, B. E., et al. (2023) · PLoS Computational Biology · doi:10.1371/journal.pcbi.1011465 · Cited by 292
“To account for the many regularities of experience (Box 1), it is a good inference to assume the existence of a world that persists independently of one’s experience ( realism ).”
Self-citationComputing the Integrated Information of a Quantum Mechanism
Albantakis, L., Prentner, R., & Durham, I. T. (2023) · Entropy · doi:10.3390/e25030449 · Cited by 27
Self-citationUnravelling consciousness and brain function through the lens of time, space, and information
Luppi, A. I., Rosas, F. E., Mediano, P. A. M., Demertzi, A., Menon, D. K., & Stamatakis, E. A. (2024) · Trends in Neurosciences · doi:10.1016/j.tins.2024.05.007 · Cited by 30
Why does time feel the way it does? Toward a principled account of temporal experience
Comolatti, R., Grasso, M., & Tononi, G. (2025) · iScience · doi:10.1016/j.isci.2025.113434 · Cited by 26
Self-citationThe fundamental tension in integrated information theory 4.0’s realist idealism
Cea, I., Negro, N., & Signorelli, C. M. (2023) · Entropy · doi:10.3390/e25101453 · Cited by 13
“This is computed as the value ϕ s (amount of “System Integrated Information”, introduced in [13]).”
Method
Metadata
- Authors
- Marshall, W., Grasso, M., Mayner, W. G. P., Zaeemzadeh, A., Barbosa, L. S., Chastain, E., Findlay, G., Sasai, S., Albantakis, L., & Tononi, G.
- Affiliations
- University of Wisconsin–Madison (US)
- University of Dallas (US)
- Corresponding author
- Marshall, William
- Tononi, Giulio
- ORCID
- Venue
- Entropy
- Publisher
- MDPI AG
- Published
- 2023-02-11
- Volume
- 25
- Issue
- 2
- Pages
- 334
- ISSN
- 1099-4300 (ISSN-L)
- PMC
- PMC9955253
- OpenAlex
- W4320496098
- Cited by
- 20
- References
- 23
- Citations by year
- 2026: 10 · 2025: 3 · 2024: 4 · 2023: 3
- FWCI
- 5.17
- Type
- journal article
- Language
- en
- Open access
- gold
- doi.org
- Licence
- Locations
- Entropy (publishedVersion, cc-by)
- PubMed Central (publishedVersion, cc-by)
- PubMed (publishedVersion)
- arXiv (Cornell University) (submittedVersion)
- VTechWorks (Virginia Tech) (submittedVersion, cc-by)
- DOAJ (DOAJ: Directory of Open Access Journals) (submittedVersion, cc-by-sa)
- arXiv (Cornell University) (cc-by)
- Funders
- Tiny Blue Dot Foundation (UW 133AAG3451, RGPIN-2019-05418, TWCF0216)
- Natural Science and Engineering Research Council of Canada (UW 133AAG3451, RGPIN-2019-05418, TWCF0216)
- Templeton World Charity Foundation (UW 133AAG3451, RGPIN-2019-05418, TWCF0216)
- Topics
- Social Sciences › Arts and Humanities › Philosophy › Philosophy and Theoretical Science
- Physical Sciences › Physics and Astronomy › Statistical and Nonlinear Physics › Complex Systems and Dynamics
- Life Sciences › Neuroscience › Cognitive Neuroscience › Functional Brain Connectivity Studies
- Keywords
- integrated information theory, integrated information, consciousness, information integration, determinism, degeneracy, fault lines, connectivity, complex systems
About these checks
Registry, retraction, Cites and statistics results are computed, not judged, with one exception: a printed reference that no index lists is read once by a model before it counts as a citation error. Claims are extracted by a model and kept only when their quote appears verbatim in the text; each cited source is then checked, with a model’s help, for whether it says what the claim relies on. Those verdicts can be wrong — read the claim’s quote and the cited source before relying on one.
Statistics and arithmetic are recomputed, not judged.
Confidence bands are shown only for fields calibrated on our annotated test set. None is calibrated yet, so no band is shown.
What counts as a claim ›How we measure confidence ›How we check this ›
Are you an author, or do you see a problem with this page? Request a review
Data sources
Bibliographic data: Semantic Scholar, OpenAlex, Crossref.
Contains information from the Semantic Scholar Academic Graph Datasets, made available under the ODC Attribution License (ODC-BY 1.0).
Semantic Scholar’s data is described in: Kinney, R., et al. (2023). The Semantic Scholar Open Data Platform. arXiv:2301.10140.
