Cited by 88

The DOI matches its Crossref record; 4 of the 4 references it cites were found in a registry or an index.

Presence of Cx43 in extracellular vesicles reduces the cardiotoxicity of the anti‐tumour therapeutic approach with doxorubicin

Martins‐Marques, Tania, Pinho, Maria Joao, Zuzarte, Monica, Oliveira, Carla, Pereira, Paulo, Sluijter, Joost P. G., Gomes, Celia, Girao, Henrique·2016·Journal of Extracellular Vesicles

Abstract

Extracellular vesicles (EVs) are major conveyors of biological information, mediating local and systemic cell‐to‐cell communication under physiological and pathological conditions. These endogenous vesicles have been recognized as prominent drug delivery vehicles of several therapeutic cargoes, including doxorubicin (dox), presenting major advantages over the classical approaches. Although dox is one of the most effective anti‐tumour agents in the clinical practice, its use is very often hindered by its consequent dramatic cardiotoxicity. Despite significant advances witnessed in the past few years, more comprehensive studies, supporting the therapeutic efficacy of EVs, with decreased side effects, are still scarce. The main objective of this study was to evaluate the role of the gap junction protein connexin43 (Cx43) in mediating the release of EV content into tumour cells. Moreover, we investigated whether Cx43 improves the efficiency of dox‐based anti‐tumour treatment, with a concomitant decrease of cardiotoxicity. In the present report, we demonstrate that the presence of Cx43 in EVs increases the release of luciferin from EVs into tumour cells in vitro and in vivo. In addition, using cell‐based approaches and a subcutaneous mouse tumour model, we show that the anti‐tumour effect of dox incorporated into EVs is similar to the administration of the free drug, regardless the presence of Cx43. Strikingly, we demonstrate that the presence of Cx43 in dox‐loaded EVs reduces the cardiotoxicity of the drug. Altogether, these results bring new insights into the concrete potential of EVs as therapeutic vehicles and open new avenues toward the development of strategies that help to reduce unwanted side effects.

Overview

The claims and statistics of this paper haven’t been checked yet.

Run the check — free, no account needed. It reads the open-access text and checks the sources it cites.

A few free checks a day · papers already verified open instantly · results are public

Integrity signals

Registry

Crossref · 10.3402/jev.v5.32538

Cites

4 of 4 references verified0 citation errors · 0 not checkable

Statistics

Figures

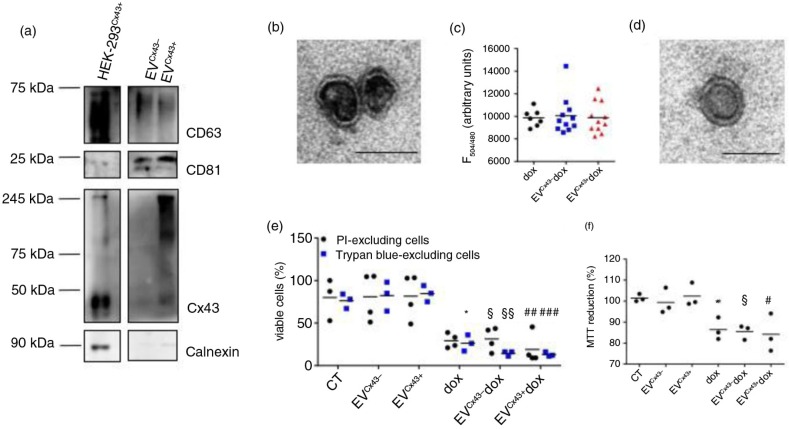
Fig. 1 EVs loaded with dox decrease the viability of tumour cells in vitro. (a) Characterization of EVs produced by HEK-293 cells expressing or not Cx43 (EVCx43 + or EVCx43−) was performed by WB under non-reducing conditions. The presence of EV markers CD63 and CD81 was analysed. Calnexin was used as control for cell debris contamination. Equal amounts of protein (10 µg) from total cellular extracts from HEK-293Cx43+ were used as control. (b) Representative TEM image of EVCx43+. Scale bars, 100 nm. (c) Ten micrograms of EVCx43− or EVCx43+ was loaded with 100 µg dox by electroporation; not incorporated dox was washed out with PBS by ultracentrifugation. Values of EV-loaded dox (~10% EV pellet) were quantified by fluorescence detection (emission, 594 nm; excitation, 480 nm) and are depicted in the graph. Fluorescence reading of similar amounts of free dox was used as control (n=10). (d) Representative TEM image of EVCx43+ dox after electroporation. Scale bars, 80 nm. (e) 4T1luc2 cells were treated with either 2 µM free dox or dox loaded into EVs containing or not Cx43 (EVCx43+ dox and EVCx43− dox) for 24 h. Equal amounts of EVCx43+ or EVCx43− were used for dox loading, and vehicle-treated cells were used as controls. Cell viability was assessed by flow cytometry analysis of propidium iodide (PI) exclusion and by counting the number of Trypan blue–excluding cells. Number of viable cells is represented as percentage of total cells (n=3, p<0.05 vs. CT, §p<0.05, §§p<0.01 vs. EVCx43−, ##p<0.01 ###p<0.001 vs. EVCx43+). (f) Metabolic activity was assessed by MTT reduction (n=3, *p<0.05 vs. CT, §p<0.05 vs. EVCx43−, #p<0.05 vs. EVCx43+).
Fig. 1 EVs loaded with dox decrease the viability of tumour cells in vitro. (a) Characterization of EVs produced by HEK-293 cells expressing or not Cx43 (EVCx43 + or EVCx43−) was performed by WB under non-reducing conditions. The presence of EV markers CD63 and CD81 was analysed. Calnexin was used as control for cell debris contamination. Equal amounts of protein (10 µg) from total cellular extracts from HEK-293Cx43+ were used as control. (b) Representative TEM image of EVCx43+. Scale bars, 100 nm. (c) Ten micrograms of EVCx43− or EVCx43+ was loaded with 100 µg dox by electroporation; not incorporated dox was washed out with PBS by ultracentrifugation. Values of EV-loaded dox (~10% EV pellet) were quantified by fluorescence detection (emission, 594 nm; excitation, 480 nm) and are depicted in the graph. Fluorescence reading of similar amounts of free dox was used as control (n=10). (d) Representative TEM image of EVCx43+ dox after electroporation. Scale bars, 80 nm. (e) 4T1luc2 cells were treated with either 2 µM free dox or dox loaded into EVs containing or not Cx43 (EVCx43+ dox and EVCx43− dox) for 24 h. Equal amounts of EVCx43+ or EVCx43− were used for dox loading, and vehicle-treated cells were used as controls. Cell viability was assessed by flow cytometry analysis of propidium iodide (PI) exclusion and by counting the number of Trypan blue–excluding cells. Number of viable cells is represented as percentage of total cells (n=3, p<0.05 vs. CT, §p<0.05, §§p<0.01 vs. EVCx43−, ##p<0.01 ###p<0.001 vs. EVCx43+). (f) Metabolic activity was assessed by MTT reduction (n=3, *p<0.05 vs. CT, §p<0.05 vs. EVCx43−, #p<0.05 vs. EVCx43+).CC BY-NC · PubMed Central
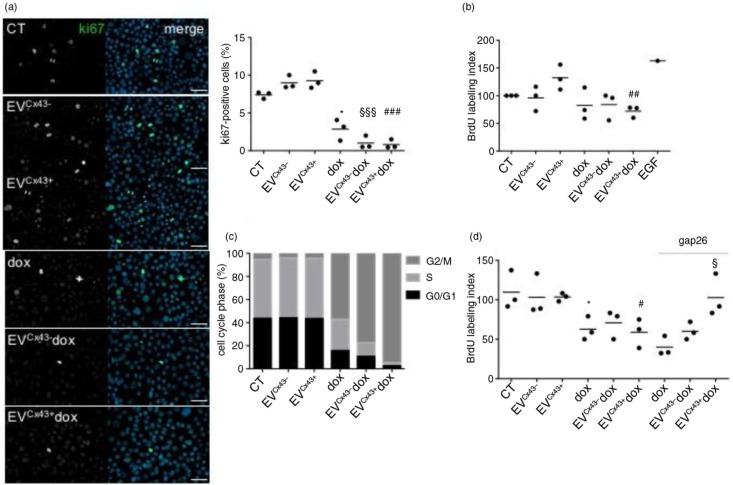
Fig. 2 EVs loaded with dox impair tumour cell proliferation in vitro. 4T1luc2 cells were treated with 2 µM free dox, EVCx43+ dox, EVCx43− dox or vehicles, for 24 h. (a) Representative images of ki-67 immunostaining (green). Nuclei were stained with 4,6-diamidino-2-phenylindole (Dapi). Scale bars, 50 µm. Percentage of ki-67 (per total nuclei) is plotted in the graph (n=3, *p<0.05 vs. CT, §§§p<0.001 vs. EVCx43−, ###p<0.001 vs. EVCx43+). (b) Cell proliferation was assessed by the BrdU assay. Treatment with epidermal growth factor (100 ng/ml, 24 h) was performed as positive control. Percentage of BrdU incorporation is plotted on the graph (n=3, ##p<0.01 vs. EVCx43+). (c) Cell cycle analysis was performed by flow cytometry, using PI (n=3). (d) 4T1luc2 cells were treated with 2 µM free dox, EVCx43+ dox, EVCx43− dox or vehicles, for 1 h. A Cx43-mimetic peptide (gap26, 0.25 mg/ml) was used, where indicated. Fresh media was added and the cells cultured for an additional 23 h. Cell proliferation was assessed by the BrdU incorporation assay (n=3, *p<0.05 vs. CT, #p<0.05 vs. EVCx43+, §p<0.05 vs. EVCx43+ dox).
Fig. 2 EVs loaded with dox impair tumour cell proliferation in vitro. 4T1luc2 cells were treated with 2 µM free dox, EVCx43+ dox, EVCx43− dox or vehicles, for 24 h. (a) Representative images of ki-67 immunostaining (green). Nuclei were stained with 4,6-diamidino-2-phenylindole (Dapi). Scale bars, 50 µm. Percentage of ki-67 (per total nuclei) is plotted in the graph (n=3, *p<0.05 vs. CT, §§§p<0.001 vs. EVCx43−, ###p<0.001 vs. EVCx43+). (b) Cell proliferation was assessed by the BrdU assay. Treatment with epidermal growth factor (100 ng/ml, 24 h) was performed as positive control. Percentage of BrdU incorporation is plotted on the graph (n=3, ##p<0.01 vs. EVCx43+). (c) Cell cycle analysis was performed by flow cytometry, using PI (n=3). (d) 4T1luc2 cells were treated with 2 µM free dox, EVCx43+ dox, EVCx43− dox or vehicles, for 1 h. A Cx43-mimetic peptide (gap26, 0.25 mg/ml) was used, where indicated. Fresh media was added and the cells cultured for an additional 23 h. Cell proliferation was assessed by the BrdU incorporation assay (n=3, *p<0.05 vs. CT, #p<0.05 vs. EVCx43+, §p<0.05 vs. EVCx43+ dox).CC BY-NC · PubMed Central
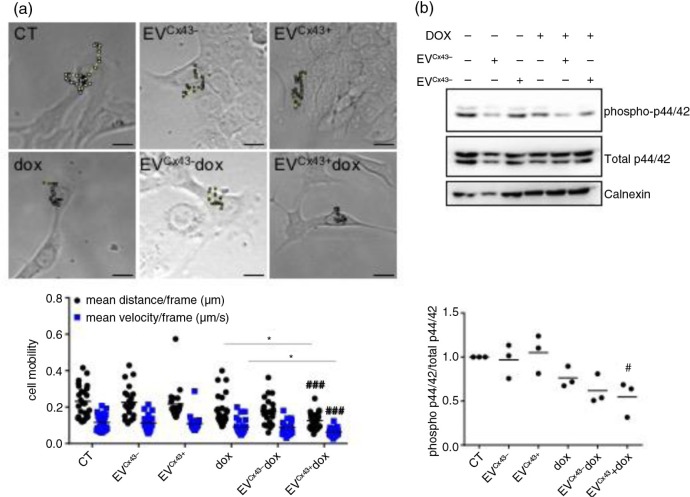
Fig. 3 Cx43-containing EVs loaded with dox decrease the activation of signalling pathways related to cell motility. The 4T1luc2 cells were treated with 2 µM free dox, EVCx43+ dox, EVCx43− dox or vehicles, for 24 h. (a) Time-lapse microscopy was performed to assess cell motility, followed by individual cell tracking. Mean distance and velocity are plotted in the graph (n=3, ###p<0.001 vs. EVCx43+ ; *p<0.05 EVCx43+ dox vs. dox;). Left panel shows representative images of the assay. Scale bar, 10 µm. (b) Activation of the p44/42 pathway was analysed by WB. Calnexin was used as loading control (n=3, #p<0.05 vs. EVCx43+).
Fig. 3 Cx43-containing EVs loaded with dox decrease the activation of signalling pathways related to cell motility. The 4T1luc2 cells were treated with 2 µM free dox, EVCx43+ dox, EVCx43− dox or vehicles, for 24 h. (a) Time-lapse microscopy was performed to assess cell motility, followed by individual cell tracking. Mean distance and velocity are plotted in the graph (n=3, ###p<0.001 vs. EVCx43+ ; *p<0.05 EVCx43+ dox vs. dox;). Left panel shows representative images of the assay. Scale bar, 10 µm. (b) Activation of the p44/42 pathway was analysed by WB. Calnexin was used as loading control (n=3, #p<0.05 vs. EVCx43+).CC BY-NC · PubMed Central
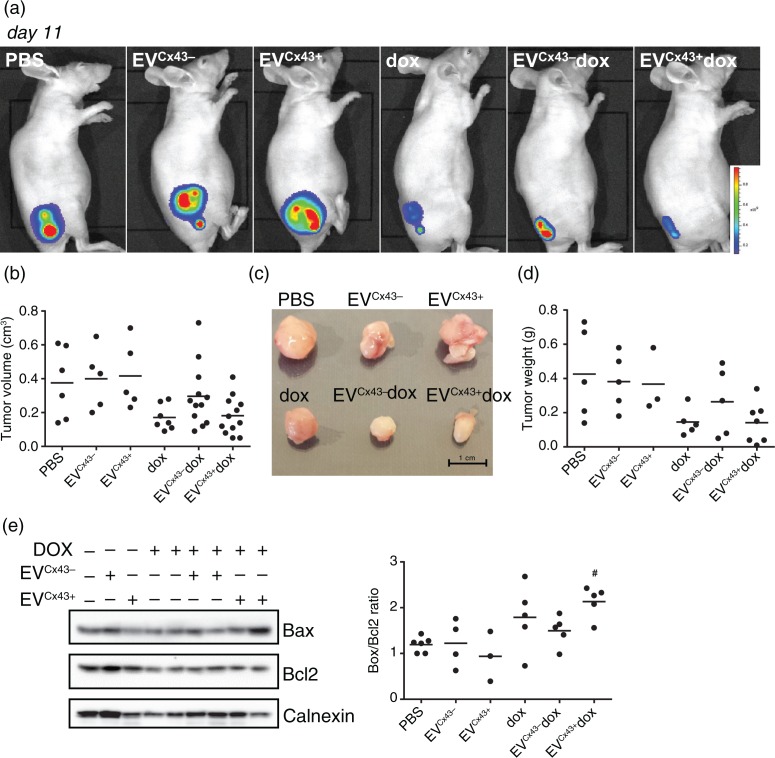
Fig. 4 EVs loaded with dox have anti-tumoural activity in 4T1luc2 tumour-bearing mice. Tumour-bearing mice were treated (i.t.) with 0.2 mg/kg of free dox, EVCx43+ dox or EVCx43− dox or vehicles, on days 5 and 8 after subcutaneous inoculation of 4T1luc2 cells into opposed flanks. Equal amounts of EVs were used in each condition. (a) Representative BLI of mice 11 days after 4T1luc2 cells inoculation, corresponding to 3 days after the last treatment. (b) Tumour diameters were measured with a caliper, followed by determination of tumour volume (n=5–8). (c) Representative images of excised tumours. (d) Average mass of excised tumours (n=5–8). (e) WB analysis of Bax and Bcl2 in tumour lysates, for each treatment group. Ratio of Bax/Bcl2 is depicted on graph. Calnexin was used as loading control (n=5, #p<0.05 vs. EVCx43+).
Fig. 4 EVs loaded with dox have anti-tumoural activity in 4T1luc2 tumour-bearing mice. Tumour-bearing mice were treated (i.t.) with 0.2 mg/kg of free dox, EVCx43+ dox or EVCx43− dox or vehicles, on days 5 and 8 after subcutaneous inoculation of 4T1luc2 cells into opposed flanks. Equal amounts of EVs were used in each condition. (a) Representative BLI of mice 11 days after 4T1luc2 cells inoculation, corresponding to 3 days after the last treatment. (b) Tumour diameters were measured with a caliper, followed by determination of tumour volume (n=5–8). (c) Representative images of excised tumours. (d) Average mass of excised tumours (n=5–8). (e) WB analysis of Bax and Bcl2 in tumour lysates, for each treatment group. Ratio of Bax/Bcl2 is depicted on graph. Calnexin was used as loading control (n=5, #p<0.05 vs. EVCx43+).CC BY-NC · PubMed Central
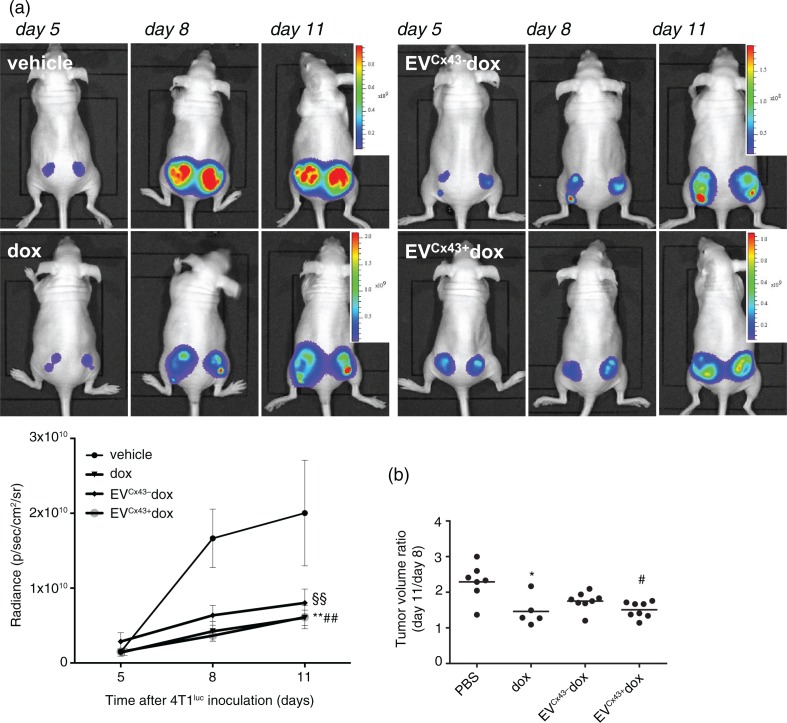
Fig. 5 EVs loaded with dox inhibit tumour growth in vivo. Representative serial BLI of mice bearing bilateral 4T1luc2 subcutaneous tumours before treatment (at day 5), and at days 8 and 11 after cells inoculation, corresponding to 3 days after the first and second treatments, respectively. Treatment groups received (i.t.) 0.2 mg/kg of free dox, EVCx43− dox or EVCx43+ dox, on days 5 and 8. Equal amounts of EVs were used in each condition. (a) Tumour size was evaluated by quantification of bioluminescence signal (p/sec/cm2/sr) in a ROI drawn around the tumour. Graph depicts tumour progression of untreated and treated animals, normalized to the signal at the beginning of the treatment (n=5, **p<0.01 dox vs. vehicle, §§p<0.01 EVCx43+ dox vs. vehicle, ##p<0.05 EVCx43+ vs. vehicle). (b) Tumour diameters were measured to calculate tumour volume ratio between days 11 and 8 (n=5–8, *p<0.05 vs. vehicle, #p<0.05 vs. vehicle).
Fig. 5 EVs loaded with dox inhibit tumour growth in vivo. Representative serial BLI of mice bearing bilateral 4T1luc2 subcutaneous tumours before treatment (at day 5), and at days 8 and 11 after cells inoculation, corresponding to 3 days after the first and second treatments, respectively. Treatment groups received (i.t.) 0.2 mg/kg of free dox, EVCx43− dox or EVCx43+ dox, on days 5 and 8. Equal amounts of EVs were used in each condition. (a) Tumour size was evaluated by quantification of bioluminescence signal (p/sec/cm2/sr) in a ROI drawn around the tumour. Graph depicts tumour progression of untreated and treated animals, normalized to the signal at the beginning of the treatment (n=5, **p<0.01 dox vs. vehicle, §§p<0.01 EVCx43+ dox vs. vehicle, ##p<0.05 EVCx43+ vs. vehicle). (b) Tumour diameters were measured to calculate tumour volume ratio between days 11 and 8 (n=5–8, *p<0.05 vs. vehicle, #p<0.05 vs. vehicle).CC BY-NC · PubMed Central
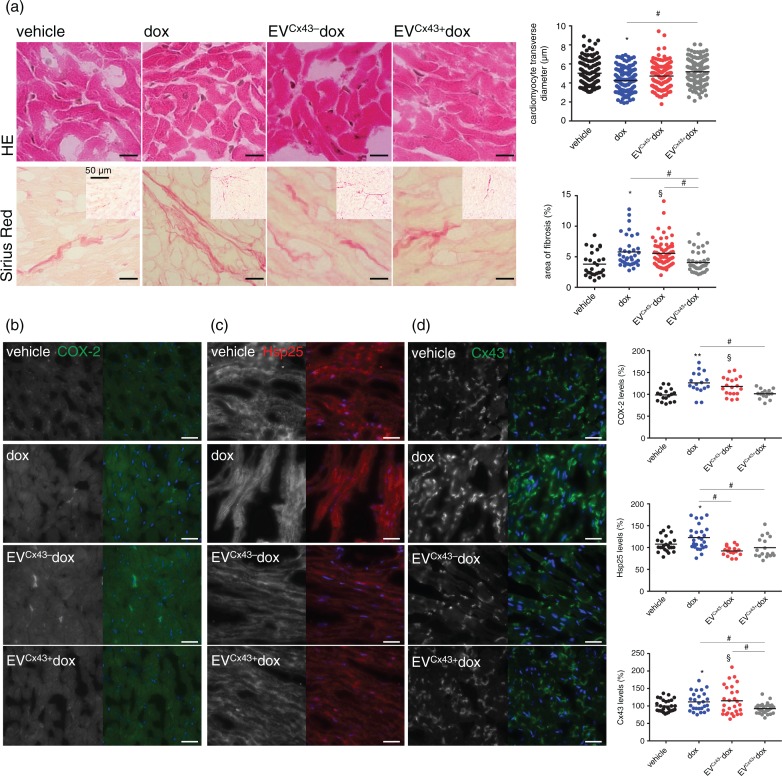
Fig. 6 Cx43-containing EVs ameliorate dox cardiotoxicity in vivo. Tumour-bearing mice were treated (i.t.) with 0.2 mg/kg of free dox, EVCx43+ dox or EVCx43− dox 5 and 8 days after bilateral subcutaneous 4T1luc2 cells inoculation. At day 11, mice were sacrificed and hearts were collected. (a) Histological analysis of hearts was performed by HE and Sirius red staining. Scale bars, 5 µm. Insets represent low-magnification images. Quantitative measurements obtained in each field analysed by microscopy are depicted in the graph (n=3–4, *p<0.05 dox vs. vehicle; §p<0.05 EVCx43− dox vs. vehicle; #p<0.05). Expression of COX-2 (green) (b) Hsp25 (red) (c) and Cx43 (green) (d) was assessed by immunofluorescence. Nuclei were stained with Dapi. Scale bars, 20 µm. Graphs depict quantification of each individual field analysed by fluorescence microscopy (n=3–4, *p<0.05, **p<0.01 dox vs. vehicle; §p<0.05 EVCx43− dox vs. vehicle; #p<0.05).
Fig. 6 Cx43-containing EVs ameliorate dox cardiotoxicity in vivo. Tumour-bearing mice were treated (i.t.) with 0.2 mg/kg of free dox, EVCx43+ dox or EVCx43− dox 5 and 8 days after bilateral subcutaneous 4T1luc2 cells inoculation. At day 11, mice were sacrificed and hearts were collected. (a) Histological analysis of hearts was performed by HE and Sirius red staining. Scale bars, 5 µm. Insets represent low-magnification images. Quantitative measurements obtained in each field analysed by microscopy are depicted in the graph (n=3–4, *p<0.05 dox vs. vehicle; §p<0.05 EVCx43− dox vs. vehicle; #p<0.05). Expression of COX-2 (green) (b) Hsp25 (red) (c) and Cx43 (green) (d) was assessed by immunofluorescence. Nuclei were stained with Dapi. Scale bars, 20 µm. Graphs depict quantification of each individual field analysed by fluorescence microscopy (n=3–4, *p<0.05, **p<0.01 dox vs. vehicle; §p<0.05 EVCx43− dox vs. vehicle; #p<0.05).CC BY-NC · PubMed Central

Verification

Claims the paper makes

The claims and statistics of this paper haven’t been checked yet.

Run the check — free, no account needed. It reads the open-access text and checks the sources it cites.

A few free checks a day · papers already verified open instantly · results are public

Claims other papers make about this one

Each is checked against this paper’s own text: does it say what the citing paper says it does?

Self-check

Percentages, sums and reported differences re-computed from the paper’s own numbers.

The self-check needs the paper’s full text.

Citations

Cites

Research works printed but not linked: 42

  1. 10.1146/annurev-physiol-021014-071641 · DOI · Paper page
  2. 10.3402/jev.v2i0.20389 · DOI
  3. 10.1146/annurev-pharmtox-010814-124630 · DOI
  4. 10.1038/mt.2012.180 · DOI · Paper page
  5. 10.3389/fonc.2014.00127 · DOI
  6. 10.3402/jev.v3.24641 · DOI · Paper page
  7. 10.1038/srep13243 · DOI
  8. 10.1038/mt.2011.164 · DOI · Paper page
  9. 10.1016/j.biomaterials.2013.11.083 · DOI
  10. 10.1038/nrcardio.2015.65 · DOI
  11. Toffoli G, 2015, Exosomal doxorubicin reduces the cardiac toxicity of doxorubicin, Nanomedicine (Lond).
  12. 10.3402/jev.v4.30087 · DOI · Paper page
  13. 10.1186/1741-7015-6-20 · DOI
  14. 10.1007/s00232-007-9052-x · DOI
  15. 10.18632/oncotarget.5517 · DOI
  16. 10.1016/j.canlet.2015.11.013 · DOI
  17. Lim E, 2009, In vivo bioluminescent imaging of mammary tumors using IVIS spectrum., J Vis Exp., 1210
  18. Théry C, 2006, Isolation and characterization of exosomes from cell culture supernatants and biological fluids, 3.22.1
  19. 10.1182/blood-2011-02-338004 · DOI · Paper page
  20. Johnson S, 2013, Assessment of cell viability, 9.2.1
  21. Strober W, 2015, Current protocols in immunology, A3.B.1
  22. 10.1007/978-1-62703-733-4_12 · DOI
  23. Pozarowski P, Analysis of cell cycle by flow cytometry, 301
  24. Jain P, 2012, Quantitative analysis of random migration of cells using time‐lapse video microscopy, J Vis Exp., 63
  25. 10.1038/nprot.2006.339 · DOI
  26. 10.1042/BJ20141370 · DOI
  27. 10.1016/j.biochi.2015.02.020 · DOI
  28. 10.1093/cvr/cvs282 · DOI
  29. 10.1371/journal.pbio.1002128 · DOI
  30. 10.3402/jev.v3.26913 · DOI · Paper page
  31. 10.1016/j.cell.2011.02.013 · DOI · Paper page
  32. 10.1007/s00424-010-0849-6 · DOI
  33. 10.1016/S1535-6108(03)00162-4 · DOI
  34. Chen GG, 2002, Negative correlation between the ratio of Bax to Bcl‐2 and the size of tumor treated by culture supernatants from Kupffer cells, Clin Exp Metastasis., 19, 457, 10.1023/A:1016336724463 · DOI
  35. 10.1016/j.yjmcc.2012.03.006 · DOI
  36. Vedam K, 2010, Role of heat shock factor‐1 activation in the doxorubicin‐induced heart failure in mice, Am J Physiol Heart Circ Physiol.
  37. 10.1172/JCI200111334 · DOI
  38. 10.1042/BST20150046 · DOI
  39. Radić J, 2016, Connexin 43 expression in primary colorectal carcinomas in patients with Stage III and IV disease, Anticancer Res., 36, 2189
  40. 10.1146/annurev-cellbio-101512-122326 · DOI · Paper page
  41. Pecoraro M, Doxorubicin‐mediated cardiotoxicity: role of mitochondrial connexin 43, Cardiovasc Toxicol., 15, 366, 10.1007/s12012-014-9305-8 · DOI
  42. 10.1016/j.nano.2015.04.001 · DOI

Cited by

Sorted by citations

See all 88

Metadata

Authors
Martins‐Marques, T., Pinho, M. J., Zuzarte, M., Oliveira, C., Pereira, P., Sluijter, J. P. G., Gomes, C., & Girao, H.
Venue
Journal of Extracellular Vesicles
Publisher
Wiley
Published
2016-01
Volume
5
Issue
1
ISSN
2001-3078
Cited by
88
References
4
Language
en
Funders
  • Fundação para a Ciência e a Tecnologia (FCT‐UID/NEU/04539/2013, PD/BD/106043/2015, POCI‐01‐0145‐FEDER‐007274)
  • European Regional Development Fund

About these checks

Registry, retraction, Cites and statistics results are computed, not judged, with one exception: a printed reference that no index lists is read once by a model before it counts as a citation error. Claims are extracted by a model and kept only when their quote appears verbatim in the text; each cited source is then checked, with a model’s help, for whether it says what the claim relies on. Those verdicts can be wrong — read the claim’s quote and the cited source before relying on one.

Statistics and arithmetic are recomputed, not judged.

Confidence bands are shown only for fields calibrated on our annotated test set. None is calibrated yet, so no band is shown.

What counts as a claim ›How we measure confidence ›How we check this ›

Are you an author, or do you see a problem with this page? Request a review