

The DOI matches its Crossref record; 70 of the 70 references it cites were found in a registry or an index.
Long-term irritable bowel syndrome symptom control with reintroduction of selected FODMAPs
Open accessAbstract
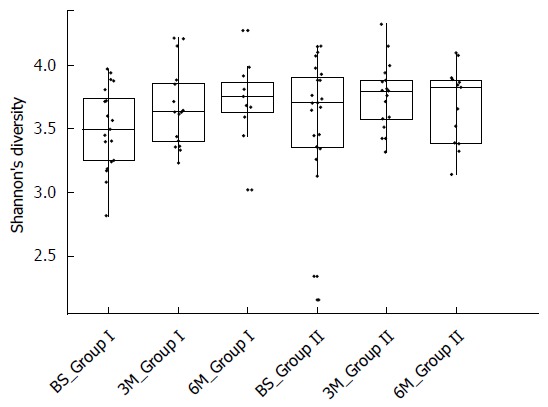
AIM: To investigate the long-term effect of dietary education on a low fermentable oligosaccharide, disaccharide and polyol (FODMAP) diet on irritable bowel syndrome (IBS) symptoms and quality of life (QoL). METHODS: Participants with IBS (Rome III) were randomized to two groups. Group I commenced a low FODMAP diet at baseline. At three months, group II, so far a comparator group, crossed over to a low FODMAP diet while group I started re-challenging foods. All patients completed the IBS SSS (IBS symptom severity scoring system, 0-500 points increasing with severity), IBS QoL questionnaire (0-100 increasing with QoL), a FODMAP specific food frequency questionnaire and provided a stool sample at baseline, three and six months for microbiome analysis. RESULTS: < 0.01) and after re-introducing FODMAP containing foods increased again to 27 ± 9 g/d. There was no change seen in the intestinal microbiome when participants adopted a low FODMAP diet. CONCLUSION: This study demonstrated that a reduction in FODMAPs improves symptoms in IBS and this improvement can be maintained while reintroducing FODMAPs.
Overview
The claims and statistics of this paper haven’t been checked yet.
Run the check — free, no account needed. It reads the open-access text and checks the sources it cites.
Integrity signals
Registry
Cites
Statistics
Figures
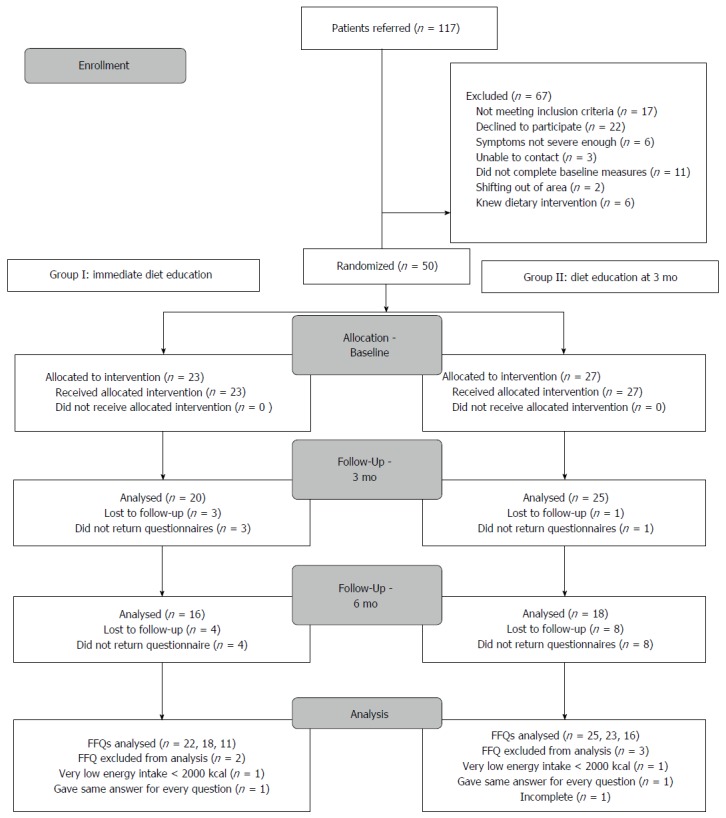
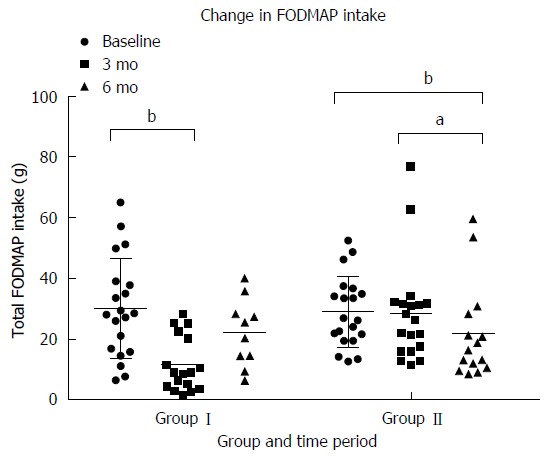
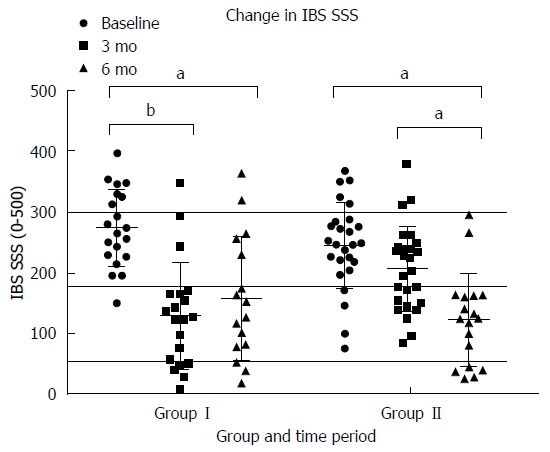
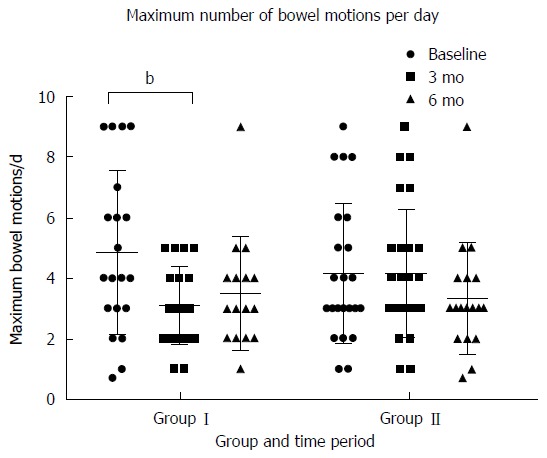
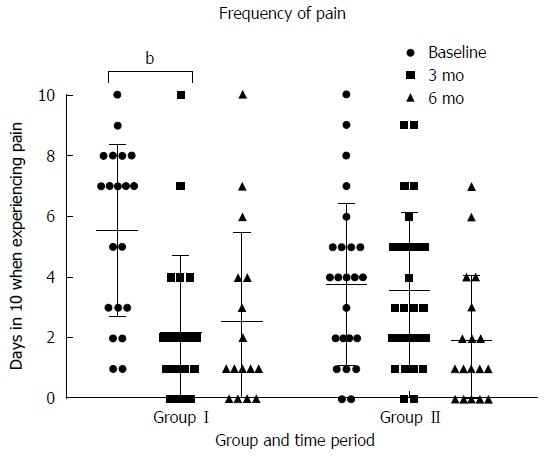
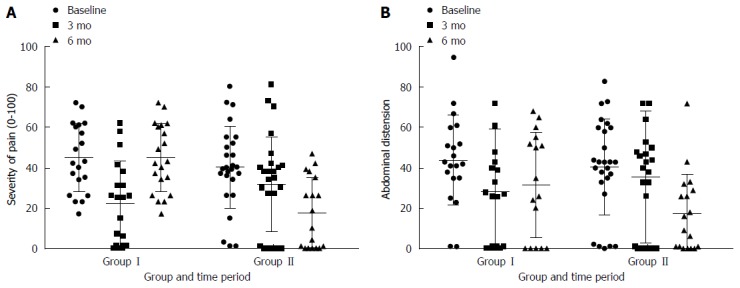
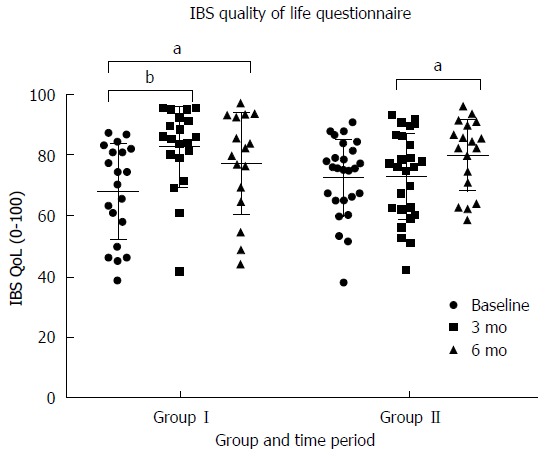
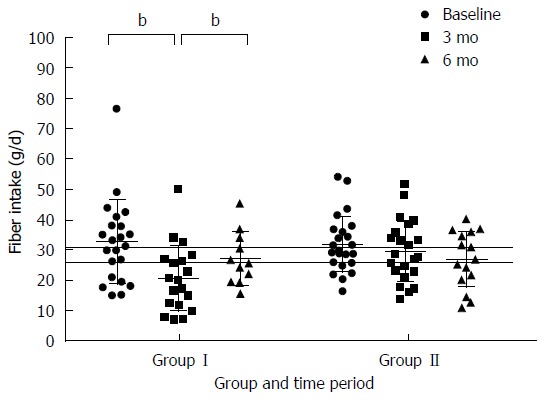
Verification
Claims the paper makes
The claims and statistics of this paper haven’t been checked yet.
Run the check — free, no account needed. It reads the open-access text and checks the sources it cites.
Claims other papers make about this one
Each is checked against this paper’s own text: does it say what the citing paper says it does?
The cited source doesn’t support the claim as written.
In the citing paper
“The effect of FODMAP reintroduction to tolerance on IBS symptoms is therefore unclear, although there have been open-label studies reporting the long-term efficacy of an adapted low FODMAP diet ranges somewhere between 50% and 60%.177 203”
From British Society of Gastroenterology guidelines on the management of irritable bowel syndrome (2021) · cites this paper as [177]
Checked by a reasoning model — may be wrong.
Experimental — accuracy not yet measuredThe source backs part of the claim, not all of it — or backs it for a different population, condition or comparison.
In the citing paper
“Beans, cruciferous vegetables and other high fodmap foods that are more prone to gas formation may be reduced in the diet and can be reintroduced slowly if patients are experiencing bloating or cramping similar to IBS [102].”
From Lifestyle Medicine for Obesity in the Era of Highly Effective Anti-Obesity Treatment (2025) · cites this paper as [102]
Experimental — accuracy not yet measuredThe source backs part of the claim, not all of it — or backs it for a different population, condition or comparison.
In the citing paper
“The effect of FODMAP reintroduction to tolerance on IBS symptoms is therefore unclear, although there have been open-label studies reporting the long-term efficacy of an adapted low FODMAP diet ranges somewhere between 50% and 60%.177 203”
From British Society of Gastroenterology guidelines on the management of irritable bowel syndrome (2021) · cites this paper as [177]
Experimental — accuracy not yet measured
Self-check
Percentages, sums and reported differences re-computed from the paper’s own numbers.
The self-check needs the paper’s full text.
Citations
Cites
1 retracted
Russo, I., Luciani, A., Cicco, P. D., Troncone, E., & Ciacci, C. (2012) · PLoS ONE · doi:10.1371/journal.pone.0032841 · Cited by 108
RetractedQIIME allows analysis of high-throughput community sequencing data
Caporaso, J. G., Kuczynski, J., Stombaugh, J., Bittinger, K., Bushman, F. D., Costello, E. K., Fierer, N., Peña, A. G., Goodrich, J. K., Gordon, J. I., et al. (2010) · Nature Methods · doi:10.1038/nmeth.f.303 · Cited by 34,887
Naive Bayesian Classifier for Rapid Assignment of rRNA Sequences into the New Bacterial Taxonomy
Wang, Q., Garrity, G. M., Tiedje, J. M., & Cole, J. R. (2007) · Applied and Environmental Microbiology · doi:10.1128/aem.00062-07 · Cited by 20,145
Longstreth, G. F., Thompson, W. G., Chey, W. D., Houghton, L. A., Mearin, F., & Spiller, R. C. (2006) · Gastroenterology · doi:10.1053/j.gastro.2005.11.061 · Cited by 4,856
Regulation of inflammatory responses by gut microbiota and chemoattractant receptor GPR43
Maslowski, K. M., Vieira, A. T., Ng, A., Kranich, J., Sierro, F., Yu, D., Schilter, H. C., Rolph, M. S., Mackay, F., Artis, D., et al. (2009) · Nature · doi:10.1038/nature08530 · Cited by 3,241
Global Prevalence of and Risk Factors for Irritable Bowel Syndrome: A Meta-analysis
Lovell, R. M., & Ford, A. C. (2012) · Clinical Gastroenterology and Hepatology · doi:10.1016/j.cgh.2012.02.029 · Cited by 2,155
FRANCIS, C. Y., MORRIS, J., & WHORWELL, P. J. (1997) · Alimentary Pharmacology & Therapeutics · doi:10.1046/j.1365-2036.1997.142318000.x · Cited by 1,708
Fernandes, A. D., Reid, J. N., Macklaim, J. M., McMurrough, T. A., Edgell, D. R., & Gloor, G. B. (2014) · Microbiome · doi:10.1186/2049-2618-2-15 · Cited by 1,329
A Diet Low in FODMAPs Reduces Symptoms of Irritable Bowel Syndrome
Halmos, E. P., Power, V. A., Shepherd, S. J., Gibson, P. R., & Muir, J. G. (2014) · Gastroenterology · doi:10.1053/j.gastro.2013.09.046 · Cited by 1,249
Rajilić–Stojanović, M., Biagi, E., Heilig, H. G. H. J., Kajander, K., Kekkonen, R. A., Tims, S., & de Vos, W. M. (2011) · Gastroenterology · doi:10.1053/j.gastro.2011.07.043 · Cited by 1,041
Research works printed but not linked: 1
- Shepherd SJ, Gibson P. Food intolerance management plan Australia: Penguin Group; 2011;.
Cited by
Sorted by citations
British Society of Gastroenterology guidelines on the management of irritable bowel syndrome
Vasant, D. H., Paine, P. A., Black, C. J., Houghton, L. A., Everitt, H. A., Corsetti, M., Agrawal, A., Aziz, I., Farmer, A. D., Eugenicos, M. P., et al. (2021) · Gut · doi:10.1136/gutjnl-2021-324598 · Cited by 592
Black, C. J., Staudacher, H. M., & Ford, A. C. (2021) · Gut · doi:10.1136/gutjnl-2021-325214 · Cited by 380
World Gastroenterology Organisation Global Guidelines
Hunt, R. H., Armstrong, D., Katelaris, P., Afihene, M., Bane, A., Bhatia, S. J., Chen, M., Choi, M., de Melo, A. C., Fock, K. M., et al. (2017) · Journal of Clinical Gastroenterology · doi:10.1097/mcg.0000000000000854 · Cited by 306
Low FODMAP Diet: Evidence, Doubts, and Hopes
Bellini, M., Tonarelli, S., Nagy, A., Pancetti, A., Costa, F., Ricchiuti, A., de Bortoli, N., Mosca, M., Marchi, S., & Rossi, A. (2020) · Nutrients · doi:10.3390/nu12010148 · Cited by 239
Tuck, C. J., Biesiekierski, J. R., Schmid‐Grendelmeier, P., & Pohl, D. (2019) · Nutrients · doi:10.3390/nu11071684 · Cited by 156
van Lanen, A., de Bree, A., & Greyling, A. (2021) · European Journal of Nutrition · doi:10.1007/s00394-020-02473-0 · Cited by 151
Staudacher, H. M., Ralph, F. S. E., Irving, P. M., Whelan, K., & Lomer, M. C. E. (2019) · Journal of the Academy of Nutrition and Dietetics · doi:10.1016/j.jand.2019.01.017 · Cited by 132
Understanding the Connection between Gut Homeostasis and Psychological Stress
Zhang, H., Wang, Z., Wang, G., Song, X., Qian, Y., Liao, Z., Sui, L., Ai, L., & Xia, Y. (2023) · Journal of Nutrition · doi:10.1016/j.tjnut.2023.01.026 · Cited by 134
Review article: FODMAPS, prebiotics and gut health‐the FODMAP hypothesis revisited
Gibson, P. R., Halmos, E. P., & Muir, J. G. (2020) · Alimentary Pharmacology & Therapeutics · doi:10.1111/apt.15818 · Cited by 119
Singh, P., Tuck, C. J., Gibson, P. R., & Chey, W. D. (2022) · The American Journal of Gastroenterology · doi:10.14309/ajg.0000000000001767 · Cited by 119
Controversies and reality of the FODMAP diet for patients with irritable bowel syndrome
Halmos, E. P., & Gibson, P. R. (2019) · Journal of Gastroenterology and Hepatology · doi:10.1111/jgh.14650 · Cited by 112
Goyal, O., Batta, S., Nohria, S., Kishore, H., Goyal, P., Sehgal, R., & Sood, A. (2021) · Journal of Gastroenterology and Hepatology · doi:10.1111/jgh.15410 · Cited by 109
Randomised clinical trial: yoga vs a low‐ FODMAP diet in patients with irritable bowel syndrome
Schumann, D., Langhorst, J., Dobos, G. J., & Cramer, H. (2017) · Alimentary Pharmacology & Therapeutics · doi:10.1111/apt.14400 · Cited by 110
Tuck, C. J., Reed, D. E., Muir, J. G., & Vanner, S. J. (2019) · Neurogastroenterology & Motility · doi:10.1111/nmo.13730 · Cited by 85
Mitchell, H., Porter, J. A., Gibson, P. R., Barrett, J. S., & Garg, M. (2018) · Alimentary Pharmacology & Therapeutics · doi:10.1111/apt.15079 · Cited by 86
Vandeputte, D., & Joossens, M. (2020) · Microorganisms · doi:10.3390/microorganisms8111638 · Cited by 86
Staudacher, H. M., Rossi, M., Kaminski, T. W., Dimidi, E., Ralph, F. S. E., Wilson, B., Martin, L. D., Louis, P., Lomer, M. C. E., Irving, P. M., et al. (2021) · Neurogastroenterology & Motility · doi:10.1111/nmo.14241 · Cited by 83
So, D., Loughman, A., & Staudacher, H. M. (2022) · American Journal of Clinical Nutrition · doi:10.1093/ajcn/nqac176 · Cited by 85
Bellini, M., Tonarelli, S., Barracca, F., Morganti, R., Pancetti, A., Bertani, L., de Bortoli, N., Costa, F., Mosca, M., Marchi, S., et al. (2020) · Nutrients · doi:10.3390/nu12082360 · Cited by 57
Italian guidelines for the management of irritable bowel syndrome
Barbara, G., Cremon, C., Bellini, M., Corsetti, M., di Nardo, G., Falangone, F., Fuccio, L., Galeazzi, F., Iovino, P., Sarnelli, G., et al. (2022) · Digestive and Liver Disease · doi:10.1016/j.dld.2022.11.015 · Cited by 69
Eswaran, S. L., Dolan, R. D., Ball, S. C., Jackson, K., & Chey, W. D. (2019) · Journal of the Academy of Nutrition and Dietetics · doi:10.1016/j.jand.2019.03.003 · Cited by 73
How to Implement the 3-Phase FODMAP Diet Into Gastroenterological Practice
Sultan, N., Varney, J. E., Halmos, E. P., Biesiekierski, J. R., Yao, C. K., Muir, J. G., Gibson, P. R., & Tuck, C. J. (2022) · Journal of Neurogastroenterology and Motility · doi:10.5056/jnm22035 · Cited by 77
Dietary Interventions in Inflammatory Bowel Disease
Godala, M. M., Gaszyńska, E., Zatorski, H., & Małecka-Wojciesko, E. (2022) · Nutrients · doi:10.3390/nu14204261 · Cited by 82
So, D., Gibson, P. R., Muir, J. G., & Yao, C. K. (2021) · Gut · doi:10.1136/gutjnl-2021-324891 · Cited by 77
Low-FODMAP Diet for Irritable Bowel Syndrome: What We Know and What We Have Yet to Learn
Liu, J. T., Chey, W. D., Haller, E., & Eswaran, S. L. (2020) · Annual Review of Medicine · doi:10.1146/annurev-med-050218-013625 · Cited by 74
Dietary fibre definition revisited - The case of low molecular weight carbohydrates
Stribling, P., & Ibrahim, F. (2023) · Clinical Nutrition ESPEN · doi:10.1016/j.clnesp.2023.04.014 · Cited by 73
Nutritional Considerations of the Gluten-Free Diet
Dennis, M. D., Lee, A. R., & McCarthy, T. (2018) · Gastroenterology Clinics of North America · doi:10.1016/j.gtc.2018.09.002 · Cited by 62
The role of diet in irritable bowel syndrome: implications for dietary advice
Rej, A., Aziz, I., Tornblom, H., Sanders, D. S., & Simrén, M. (2019) · Journal of Internal Medicine · doi:10.1111/joim.12966 · Cited by 61
Linsalata, M., Riezzo, G., Orlando, A., D’Attoma, B., Prospero, L., Tutino, V., Notarnicola, M., & Russo, F. (2021) · Nutrients · doi:10.3390/nu13031011 · Cited by 58
Dietary therapies for functional bowel symptoms: Recent advances, challenges, and future directions
Tuck, C. J., & Vanner, S. J. (2018) · Neurogastroenterology & Motility · doi:10.1111/nmo.13238 · Cited by 52
Cuffe, M. S., Staudacher, H. M., Aziz, I., Adame, E. C., Krieger‐Grübel, C., Madrid, A. M., Ohlsson, B., Black, C. J., & Ford, A. C. (2025) · The Lancet. Gastroenterology & hepatology · doi:10.1016/s2468-1253(25)00054-8 · Cited by 62
The low FODMAP diet in clinical practice: where are we and what are the long-term considerations?
Lomer, M. C. E. (2023) · Proceedings of The Nutrition Society · doi:10.1017/s0029665123003579 · Cited by 49
Wilson, B., Cox, S. R., & Whelan, K. (2021) · Proceedings of the Nutrition Society · doi:10.1017/s0029665120006990 · Cited by 47
Wielgosz-Grochowska, J. P., Domański, N., & Drywień, M. E. (2022) · Nutrients · doi:10.3390/nu14163382 · Cited by 44
Weynants, A., Goossens, L., Genetello, M., Looze, D. A. D., & Winckel, M. V. (2019) · Journal of Human Nutrition and Dietetics · doi:10.1111/jhn.12706 · Cited by 43
All that a physician should know about FODMAPs
Mehtab, W., Agarwal, A. K., Singh, N., Malhotra, A., & Makharia, G. K. (2019) · Indian Journal of Gastroenterology · doi:10.1007/s12664-019-01002-0 · Cited by 42
Testa, A., Imperatore, N., Rispo, A., Rea, M., Tortora, R., Nardone, O. M., Lucci, L., Accarino, G., Caporaso, N., & Castiglione, F. (2018) · Digestive Diseases · doi:10.1159/000489487 · Cited by 42
Kortlever, T. L., Huinink, S. T. B., Offereins, M. S. L., Hebblethwaite, C., O’Brien, L., Leeper, J., Mulder, C. J. J., Barrett, J. S., & Gearry, R. B. (2019) · Nutrition in Clinical Practice · doi:10.1002/ncp.10233 · Cited by 46
The low FODMAP diet for IBS; A multicentre UK study assessing long term follow up
Rej, A., Shaw, C. C., Buckle, R. L., Trott, N., Agrawal, A., Mosey, K., Sanders, K., Allen, R., Martin, S., Newton, A., et al. (2021) · Digestive and Liver Disease · doi:10.1016/j.dld.2021.05.004 · Cited by 42
Application of The FODMAP Diet in a Paediatric Setting
Rhys-Jones, D. R., Varney, J. E., Muir, J. G., Gibson, P. R., & Halmos, E. P. (2022) · Nutrients · doi:10.3390/nu14204369 · Cited by 38
Eetemadi, A., & Tagkopoulos, I. (2021) · Clinical Nutrition · doi:10.1016/j.clnu.2020.12.041 · Cited by 36
Hahn, J., Choi, J., & Chang, M. J. (2021) · Nutrients · doi:10.3390/nu13072460 · Cited by 40
Zhang, W.-X., Zhang, Y., Qin, G., Li, K.-M., Wei, W., Li, S.-Y., & Yao, S.-K. (2019) · World Journal of Gastroenterology · doi:10.3748/wjg.v25.i43.6416 · Cited by 32
Low fermentable oligosaccharides, disaccharides, monosaccharides, and polyols diet in children
Fodor, I., Man, S. C., & Dumitrascu, D. L. (2019) · World Journal of Clinical Cases · doi:10.12998/wjcc.v7.i18.2666 · Cited by 31
Gravina, A. G., Dallio, M., Romeo, M., Somma, A. D., Cotticelli, G., Loguercio, C., & Federico, A. (2020) · Nutrients · doi:10.3390/nu12040928 · Cited by 32
Aslam, H., Trakman, G., Dissanayake, T., Todd, E., Harrison, P., Alby, C., Jabeen, T., Gamage, E., Travica, N., Marshall, S., et al. (2026) · Journal of Translational Medicine · doi:10.1186/s12967-025-07428-9 · Cited by 30
Clinical Application of Dietary Therapies in Irritable Bowel Syndrome
Rej, A., Avery, A., Ford, A. C., Holdoway, A., Kurien, M., McKenzie, Y. A., Thompson, J., Trott, N., Whelan, K., Williams, M., et al. (2018) · Journal of Gastrointestinal and Liver Diseases · doi:10.15403/jgld.2014.1121.273.avy · Cited by 31
Pensabene, L., Salvatore, S., Turco, R., Tarsitano, F., Concolino, D., Baldassarre, M. E., Borrelli, O., Thapar, N., Vandenplas, Y., Staiano, A., et al. (2019) · Jornal de Pediatria · doi:10.1016/j.jped.2019.03.004 · Cited by 30
Harer, K. N., & Eswaran, S. L. (2020) · Gastroenterology Clinics of North America · doi:10.1016/j.gtc.2020.10.002 · Cited by 30
Seamark, L., Barclay, Y., Marchant, C., Williams, M., & Hickson, M. (2021) · Journal of Human Nutrition and Dietetics · doi:10.1111/jhn.12860 · Cited by 30
Long‐term personalized low FODMAP diet in IBS
Palma, G. D., & Berčík, P. (2022) · Neurogastroenterology & Motility · doi:10.1111/nmo.14356 · Cited by 28
2025 Seoul Consensus on Clinical Practice Guidelines for Irritable Bowel Syndrome
Choi, Y., Youn, Y. H., Kang, S. J., Shin, J. E., Cho, Y. S., Jung, Y. S., Shin, S. Y., Huh, C. W., Lee, Y. J., Koo, H. S., et al. (2025) · Journal of Neurogastroenterology and Motility · doi:10.5056/jnm25007 · Cited by 36
Yan, R., Andrew, L., Marlow, E., Kunaratnam, K., Devine, A., Dunican, I. C., & Christophersen, C. T. (2021) · Nutrients · doi:10.3390/nu13072159 · Cited by 29
Biesiekierski, J. R., Manning, L. P., Murray, H. B., Vlaeyen, J. W. S., Ljótsson, B., & Oudenhove, L. V. (2022) · Alimentary Pharmacology & Therapeutics · doi:10.1111/apt.17111 · Cited by 28
Diet as a therapeutic tool in chronic gastrointestinal disorders: Lessons from the FODMAP journey
Gibson, P. R., Halmos, E. P., So, D., Yao, C. K., Varney, J. E., & Muir, J. G. (2022) · Journal of Gastroenterology and Hepatology · doi:10.1111/jgh.15772 · Cited by 59
Vakil, N. B. (2018) · Nutrition in Clinical Practice · doi:10.1002/ncp.10108 · Cited by 29
Givehki, R., Afshar, H., Goli, F., Scheidt, C. E., Omidi, A., & Davoudi, M. (2018) · Electronic physician · doi:10.19082/7008 · Cited by 26
Lifestyle Medicine for Obesity in the Era of Highly Effective Anti-Obesity Treatment
Sannidhi, D., Abeles, R., Andrew, W., Bonnet, J. P., Vitale, K., Niranjan, V., Gulati, M., Pauly, K., Moran, R., Alexander, L., et al. (2025) · Nutrients · doi:10.3390/nu17142382 · Cited by 29
“Beans, cruciferous vegetables and other high fodmap foods that are more prone to gas formation may be reduced in the diet and can be reintroduced slowly if patients are experiencing bloating or cramping similar to IBS [102].”
O’Brien, L., Skidmore, P. M. L., Wall, C. L., WILKINSON, T. J., Muir, J. G., Frampton, C., & Gearry, R. B. (2020) · Nutrients · doi:10.3390/nu12103002 · Cited by 26
Plaidum, S., Patcharatrakul, T., Promjampa, W., & Gonlachanvit, S. (2022) · Nutrients · doi:10.3390/nu14091755 · Cited by 26
Effects of Low-FODMAPS Diet on Irritable Bowel Syndrome Symptoms and Gut Microbiome
Su, H., Li, Y., Heitkemper, M. M., & Zia, J. K. (2019) · Gastroenterology Nursing · doi:10.1097/sga.0000000000000428 · Cited by 24
Bellini, M., Tonarelli, S., Mumolo, M. G., Bronzini, F., Pancetti, A., Bertani, L., Costa, F., Ricchiuti, A., de Bortoli, N., Marchi, S., et al. (2020) · Nutrients · doi:10.3390/nu12113368 · Cited by 24
Is a low FODMAP diet dangerous?
Bellini, M., & Rossi, A. (2018) · Techniques in Coloproctology · doi:10.1007/s10151-018-1835-9 · Cited by 24
Thomas, A., Thomas, A., & Butler-Sanchez, M. (2021) · American Journal of Lifestyle Medicine · doi:10.1177/15598276211012968 · Cited by 25
Evolution, adaptation, and new applications of the FODMAP diet
O’Brien, L., Kasti, A. N., Halmos, E. P., Tuck, C. J., & Varney, J. E. (2024) · JGH Open · doi:10.1002/jgh3.13066 · Cited by 21
Implantación de la dieta baja en FODMAP para el dolor abdominal funcional
Castro, M. L. B., Arnal, I. R., Romero, R. G., Martínez, G. R., & Sainz, E. U. (2019) · Anales de Pediatría · doi:10.1016/j.anpedi.2018.02.025 · Cited by 21
Sikaroudi, M. K., Soltani, S., Ghoreishy, S. M., Ebrahimi, Z., Shidfar, F., & Dehnad, A. (2024) · Food & Function · doi:10.1039/d3fo03717g · Cited by 27
Ribichini, E., Scalese, G., Mocci, C., & Severi, C. (2024) · Nutrients · doi:10.3390/nu16203515 · Cited by 23
Nutritional implications of dietary interventions for managing gastrointestinal disorders
Staudacher, H. M., Kurien, M., & Whelan, K. (2017) · Current Opinion in Gastroenterology · doi:10.1097/mog.0000000000000421 · Cited by 19
Kasti, A. N., Katsas, K., Pavlidis, D., Stylianakis, E., Petsis, K., Lambrinou, S., Nikolaki, M. D., Papanikolaou, I. S., Hatziagelaki, E. E., Papadimitriou, K., et al. (2025) · Nutrients · doi:10.3390/nu17091545 · Cited by 25
Arora, R., & Chandel, A. K. (2023) · Food Research International · doi:10.1016/j.foodres.2023.113425 · Cited by 18
Bardacke, J. A., Yarrow, L., & Rosenkranz, S. K. (2023) · Current Developments in Nutrition · doi:10.1016/j.cdnut.2023.101997 · Cited by 20
Implementation of a low FODMAP diet for functional abdominal pain
Castro, M. L. B., Arnal, I. R., Romero, R. G., Martínez, G. R., & Sainz, E. U. (2019) · Anales de Pediatría (English Edition) · doi:10.1016/j.anpede.2018.02.014 · Cited by 18
Kuźmin, L., Kubiak, K., & Lange, E. (2025) · Nutrients · doi:10.3390/nu17122045 · Cited by 17
Chojnacki, C. J., Popławski, T., Błońska, A., Konrad, P., Chojnacki, J., & Błasiak, J. (2023) · Nutrients · doi:10.3390/nu15081837 · Cited by 18
Izquierdo-Veraza, D., Calderón, G., Jansson‐Knodell, C. L., Aljaras, R., Foster, E. D., Xu, H., Biruete, A., & Shin, A. (2023) · Neurogastroenterology & Motility · doi:10.1111/nmo.14698 · Cited by 17
Jent, S., Bez, N. S., Haddad, J., Catalano, L., Egger, K. S., Raia, M., Tedde, G. S., & Rogler, G. (2024) · Clinical Nutrition · doi:10.1016/j.clnu.2024.05.014 · Cited by 16
Bousdouni, P., Kandyliari, A., & Koutelidakis, A. Ε. (2022) · Gastrointestinal Disorders · doi:10.3390/gidisord4010005 · Cited by 14
Ustaoğlu, T., Tek, N. A., & Yıldırım, A. E. (2023) · Journal of Human Nutrition and Dietetics · doi:10.1111/jhn.13194 · Cited by 13
Non-pharmaceutical treatments for irritable bowel syndrome
Wang, X., Thakur, E. R., & Shapiro, J. M. (2024) · BMJ · doi:10.1136/bmj-2023-075777 · Cited by 13
Yiannakou, Y., Agrawal, A., Allen, P. B., Arebi, N., Brown, S. R., Eugenicos, M. P., Farmer, A. D., McLain-Smith, S., McLaughlin, J., Sanders, D. S., et al. (2018) · Therapeutic Advances in Gastroenterology · doi:10.1177/1756284818798791 · Cited by 12
Herfindal, A. M., van Megen, F., Gilde, M. K. O., Valeur, J., Rudi, K., Skodje, G. I., Lundin, K. E. A., Henriksen, C., & Bøhn, S. K. (2023) · British Journal Of Nutrition · doi:10.1017/s0007114523001253 · Cited by 13
Vo, T. D., Phuc, N. N., & Quynh, B. T. H. (2020) · JGH Open · doi:10.1002/jgh3.12477 · Cited by 9
Schmidt, M. P., & Raczyk, M. (2023) · Critical Reviews in Food Science and Nutrition · doi:10.1080/10408398.2023.2195026 · Cited by 10
Linsalata, M., Riezzo, G., Orlando, A., D’Attoma, B., Prospero, L., Ignazzi, A., Losurdo, G., Leo, A. D., Giannelli, G., & Russo, F. (2023) · Nutrients · doi:10.3390/nu15214683 · Cited by 10
Consensus document on exclusion diets in irritable bowel syndrome (IBS)
Casellas, F., Burgos, R., Marcos, A., Santos, J., Ríos, C. C. D. L., García‐Manzanares, Á., Polanco, I., Portillo, M. P., Villarino, A. L., Lema-Marqués, B., et al. (2018) · Revista Española de Enfermedades Digestivas · doi:10.17235/reed.2018.5941/2018 · Cited by 18
Turan, B., Bengı, G., Çehreli, R., Akpınar, H., & Soytürk, M. (2021) · World Journal of Clinical Cases · doi:10.12998/wjcc.v9.i25.7417 · Cited by 11
Rej, A., Aziz, I., & Sanders, D. S. (2018) · Proceedings of The Nutrition Society · doi:10.1017/s0029665118002549 · Cited by 10
Khan, Z. U., Muhammad, S. A., Amin, M. S., & Gul, A. (2025) · Cureus · doi:10.7759/cureus.77053 · Cited by 10
Rexwinkel, R., Vermeijden, N. K., Zeevenhooven, J., Kelder, J. C., Groeneweg, M., Hummel, T., Goede, J., van Wering, H. M., Stapelbroek, J. M., Benninga, M. A., et al. (2025) · European Journal of Pediatrics · doi:10.1007/s00431-025-05999-9 · Cited by 9
A 5Ad Dietary Protocol for Functional Bowel Disorders
Ibrahim, F., & Stribling, P. (2019) · Nutrients · doi:10.3390/nu11081938 · Cited by 10
What is the optimal FODMAP threshold in IBS?
Rej, A., Sanders, D., Buckle, R. L., Trott, N., Aziz, I., & Shaw, C. (2021) · Journal of Gastroenterology and Hepatology · doi:10.1111/jgh.15470 · Cited by 9
Iribarren, C., Maasfeh, L., Öhman, L., & Simrén, M. (2022) · Gut Microbiome · doi:10.1017/gmb.2022.6 · Cited by 9
Zanzer, Y. C., & Theis, S. (2023) · Journal of Functional Foods · doi:10.1016/j.jff.2023.105914 · Cited by 9
Covello, C., Becherucci, G., Scaldaferri, F., Laterza, L., Gasbarrini, A., & Mentella, M. C. (2024) · Polskie Archiwum Medycyny Wewnętrznej · doi:10.20452/pamw.16659 · Cited by 9
Dean, G. D., Chey, S. W., Singh, P. P., & Chey, W. D. (2024) · Neurogastroenterology & Motility · doi:10.1111/nmo.14845 · Cited by 8
Existing differences between available lists of FODMAP containing foods
Martín, I. S. M., Vilar, E. G., Oliva, S. L., & Rojo, S. S. (2022) · Revista Española de Enfermedades Digestivas · doi:10.17235/reed.2022.8463/2021 · Cited by 8
Easing Concerns About the Low FODMAP Diet in Patients With Irritable Bowel Syndrome
Gibson, P. R., & Burgell, R. (2017) · Gastroenterology · doi:10.1053/j.gastro.2017.08.055 · Cited by 8
Lambiase, C., Rossi, A., Morganti, R., Cancelli, L., Grosso, A., Tedeschi, R., Rettura, F., Mosca, M., de Bortoli, N., & Bellini, M. (2024) · Nutrients · doi:10.3390/nu16193419 · Cited by 7
Martin, L. D., & Patel, P. S. (2024) · Journal of Human Nutrition and Dietetics · doi:10.1111/jhn.13381 · Cited by 7
Metadata
- Authors
- Harvie, R. M., Chisholm, A. W., Bisanz, J. E., Burton, J. P., Herbison, P., Schultz, K., & Schultz, M.
- Affiliations
- Western University (CA)
- Corresponding author
- Schultz, Michael
- Venue
- World Journal of Gastroenterology
- Publisher
- Baishideng Publishing Group Inc.
- Published
- 2017
- Volume
- 23
- Issue
- 25
- Pages
- 4632
- ISSN
- 1007-9327 (ISSN-L)
- PMC
- PMC5504379
- OpenAlex
- W2730702691
- Cited by
- 143
- References
- 70
- Citations by year
- 2026: 12 · 2025: 15 · 2024: 14 · 2023: 12 · 2022: 21 · 2021: 18 · 2020: 13 · 2019: 23 · 2018: 10 · 2017: 5
- FWCI
- 14.60
- Type
- journal article
- Language
- en
- Open access
- hybrid
- doi.org
- Licence
- cc-by-nc
- Locations
- World Journal of Gastroenterology (publishedVersion, cc-by-nc)
- Europe PMC (PubMed Central) (publishedVersion, cc-by-nc)
- PubMed Central (publishedVersion, cc-by-nc)
- PubMed (publishedVersion)
- Topics
- Health Sciences › Medicine › Gastroenterology › Gastrointestinal motility and disorders
- Life Sciences › Biochemistry, Genetics and Molecular Biology › Molecular Biology › Gut microbiota and health
- Health Sciences › Medicine › Pediatrics, Perinatology and Child Health › Infant Health and Development
- Keywords
- irritable bowel syndrome, low FODMAP diet, nutrition education, symptom severity, quality of life, gut microbiota, dietary fiber intake
- MeSH terms
- Gastrointestinal Microbiome, Adult, Colon, Disaccharides, Female, Fermentation, Humans, Male, Middle Aged, Patient Education as Topic, Quality of Life, Surveys and Questionnaires, Severity of Illness Index, Sugar Alcohols, Irritable Bowel Syndrome, Diet, Carbohydrate-Restricted
About these checks
Registry, retraction, Cites and statistics results are computed, not judged, with one exception: a printed reference that no index lists is read once by a model before it counts as a citation error. Claims are extracted by a model and kept only when their quote appears verbatim in the text; each cited source is then checked, with a model’s help, for whether it says what the claim relies on. Those verdicts can be wrong — read the claim’s quote and the cited source before relying on one.
Statistics and arithmetic are recomputed, not judged.
Confidence bands are shown only for fields calibrated on our annotated test set. None is calibrated yet, so no band is shown.
What counts as a claim ›How we measure confidence ›How we check this ›
Are you an author, or do you see a problem with this page? Request a review
