Cited by 71

The DOI matches its Crossref record; 2 of the 2 references it cites were found in a registry or an index.

MiRNA-128 regulates the proliferation and neurogenesis of neural precursors by targeting PCM1 in the developing cortex

Zhang, Wei, Kim, Paul Jong, Chen, Zhongcan, Lokman, Hidayat, Qiu, Lifeng, Zhang, Ke, Rozen, Steven George, Tan, Eng King, Je, Hyunsoo Shawn, Zeng, Li·2016·eLife

Abstract

During the development, tight regulation of the expansion of neural progenitor cells (NPCs) and their differentiation into neurons is crucial for normal cortical formation and function. In this study, we demonstrate that microRNA (miR)-128 regulates the proliferation and differentiation of NPCs by repressing pericentriolar material 1 (PCM1). Specifically, overexpression of miR-128 reduced NPC proliferation but promoted NPC differentiation into neurons both in vivo and in vitro. In contrast, the reduction of endogenous miR-128 elicited the opposite effects. Overexpression of miR-128 suppressed the translation of PCM1, and knockdown of endogenous PCM1 phenocopied the observed effects of miR-128 overexpression. Furthermore, concomitant overexpression of PCM1 and miR-128 in NPCs rescued the phenotype associated with miR-128 overexpression, enhancing neurogenesis but inhibiting proliferation, both in vitro and in utero. Taken together, these results demonstrate a novel mechanism by which miR-128 regulates the proliferation and differentiation of NPCs in the developing neocortex.

Overview

The claims and statistics of this paper haven’t been checked yet.

Run the check — free, no account needed. It reads the open-access text and checks the sources it cites.

A few free checks a day · papers already verified open instantly · results are public

Integrity signals

Registry

Crossref · 10.7554/elife.11324

Cites

2 of 2 references verified0 citation errors · 0 not checkable

Statistics

Figures
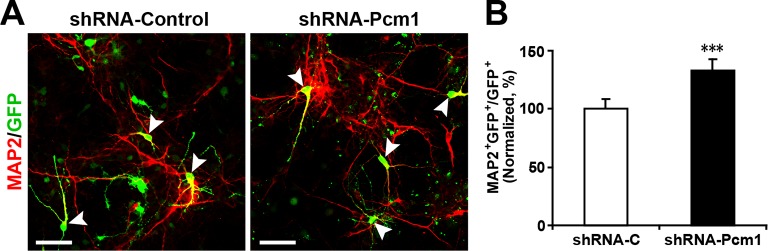
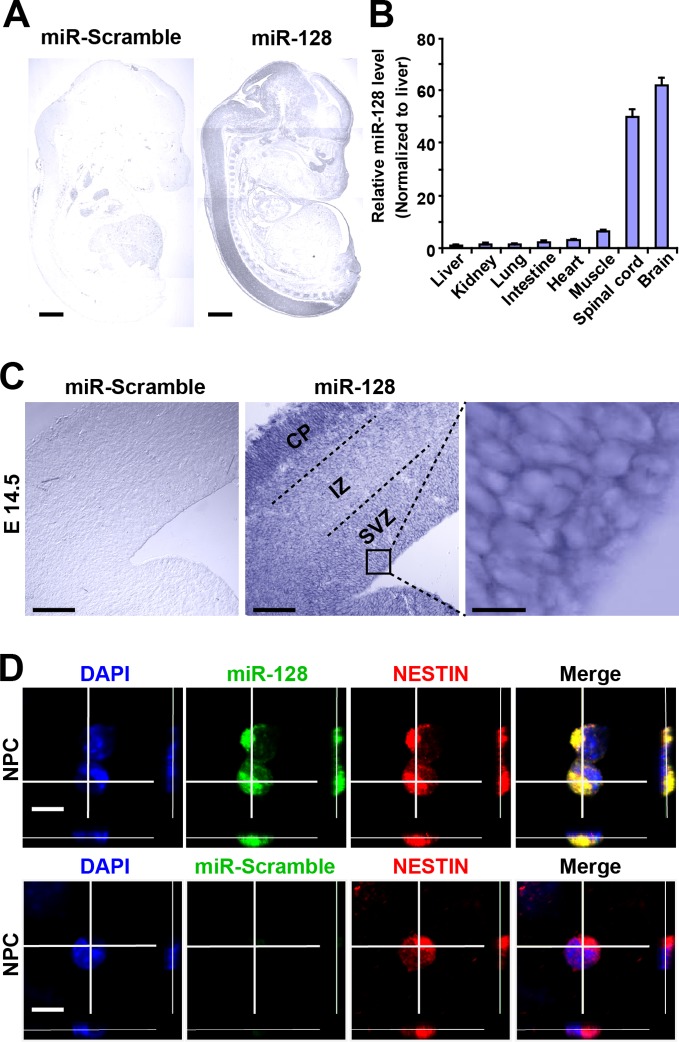
Figure 1. miR-128 expression in the developing cerebral cortex. (A) ISH was performed in an E17.5 mouse embryo with a miR-128 LNA detection probe. A sagittal section shows that miR-128 is expressed in the CNS. The left-side section was probed with a miR scramble control. Scale bars, 1 mm. (B) Real-time qPCR analyses of miR-128 from various tissues at E17.5, showing that miR-128 is highly expressed in the brain and spinal cord. miR-128 expression was measured and normalized to that of U6 and is shown relative to the liver expression level. The values represent the mean ± s.d. (n = 3). (C) miR-128 expression in the cortex. ISH was performed in an E14.5 mouse embryo brain coronal section with a miR-128 LNA detection probe. The left-side section was probed with a miR scramble control. Scale bars, 50 µm, and 5 µm in the higher magnification image (right-most panel). (D) miR-128 expression in NPCs in vitro. miR-128 LNA in situ hybridization followed by immunofluorescence analysis of the neural stem cell marker NESTIN in NPCs. DAPI staining indicates the location of cell nuclei. Scale bars, 10 µm. DOI: http://dx.doi.org/10.7554/eLife.11324.003
Figure 1. miR-128 expression in the developing cerebral cortex. (A) ISH was performed in an E17.5 mouse embryo with a miR-128 LNA detection probe. A sagittal section shows that miR-128 is expressed in the CNS. The left-side section was probed with a miR scramble control. Scale bars, 1 mm. (B) Real-time qPCR analyses of miR-128 from various tissues at E17.5, showing that miR-128 is highly expressed in the brain and spinal cord. miR-128 expression was measured and normalized to that of U6 and is shown relative to the liver expression level. The values represent the mean ± s.d. (n = 3). (C) miR-128 expression in the cortex. ISH was performed in an E14.5 mouse embryo brain coronal section with a miR-128 LNA detection probe. The left-side section was probed with a miR scramble control. Scale bars, 50 µm, and 5 µm in the higher magnification image (right-most panel). (D) miR-128 expression in NPCs in vitro. miR-128 LNA in situ hybridization followed by immunofluorescence analysis of the neural stem cell marker NESTIN in NPCs. DAPI staining indicates the location of cell nuclei. Scale bars, 10 µm. DOI: http://dx.doi.org/10.7554/eLife.11324.003CC BY · PubMed Central
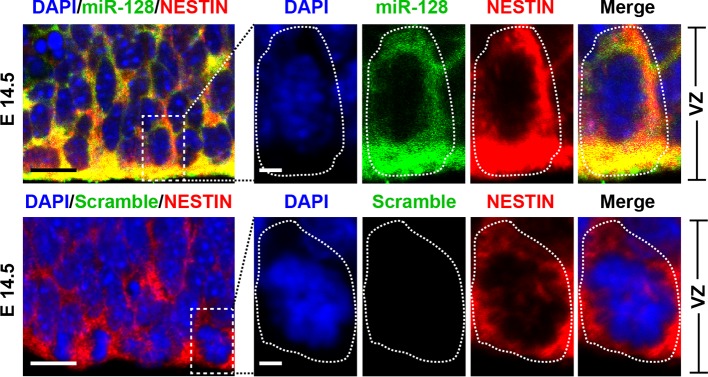
Figure 1—figure supplement 1. miR-128 expression in the developing CNS. miR-128 expression in the NPCs of the VZ at E14.5. miR-128 LNA in situ hybridization followed by immunofluorescence analysis of the neural stem cell marker NESTIN on E14.5 mouse embryo brain coronal sections. The micrographs in the bottom panels show slices probed with a miR scramble control. White dotted line outlines a single cell within the VZ. DAPI staining indicates the location of cell nuclei. Scale bars, 5 µm in left-most panel, 2 µm in all other panels. DOI: http://dx.doi.org/10.7554/eLife.11324.004
Figure 1—figure supplement 1. miR-128 expression in the developing CNS. miR-128 expression in the NPCs of the VZ at E14.5. miR-128 LNA in situ hybridization followed by immunofluorescence analysis of the neural stem cell marker NESTIN on E14.5 mouse embryo brain coronal sections. The micrographs in the bottom panels show slices probed with a miR scramble control. White dotted line outlines a single cell within the VZ. DAPI staining indicates the location of cell nuclei. Scale bars, 5 µm in left-most panel, 2 µm in all other panels. DOI: http://dx.doi.org/10.7554/eLife.11324.004CC BY · PubMed Central
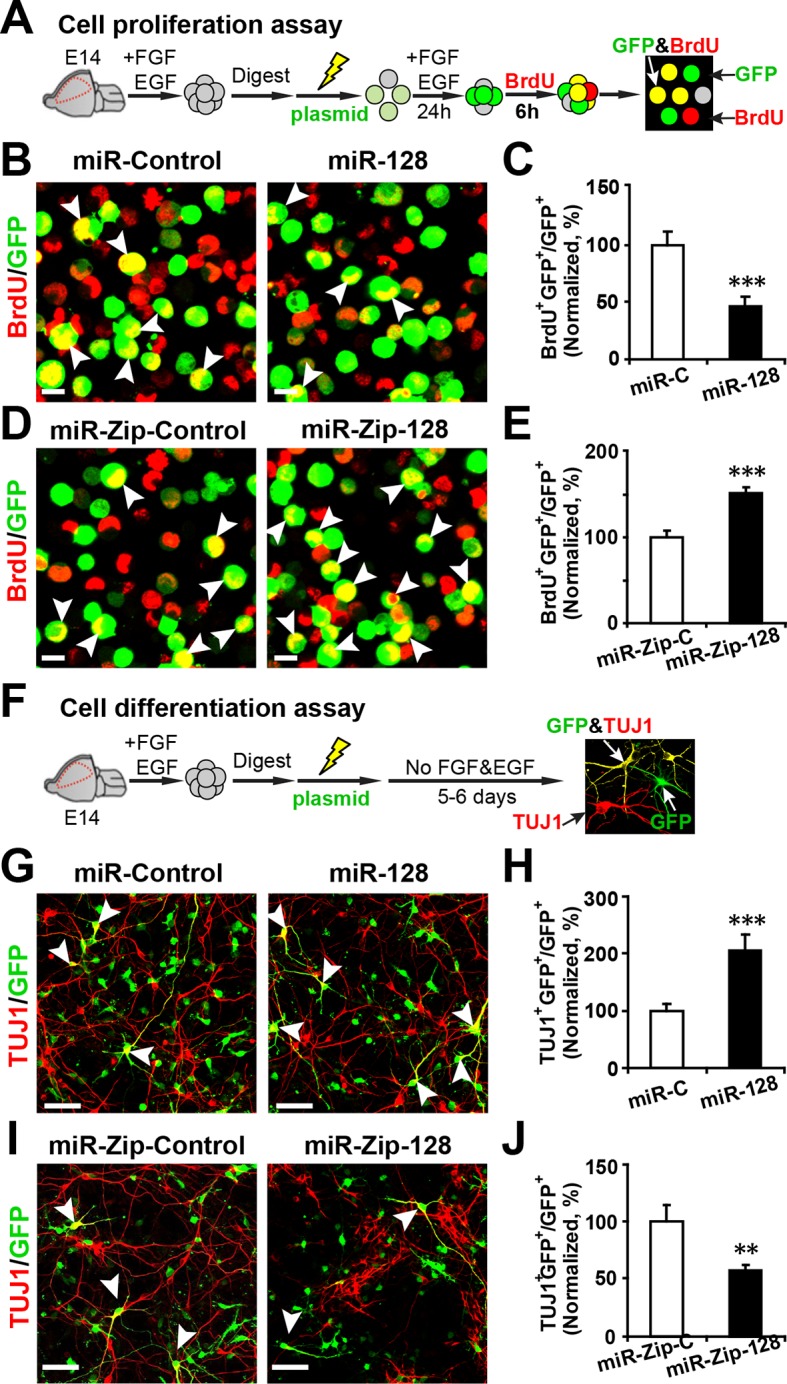
Figure 2. miR-128 modulates the proliferation and differentiation of NPCs in vitro. (A) Schematic representation of the cell proliferation assay procedures. (B-E) Ectopic expression of miR-128 decreases proliferation, while that of miR-Zip-128 increases NPC proliferation. NPCs were electroporated with the indicated plasmids and pulse-labeled with BrdU for 6 hr. NPCs were immunostained with an antibody against BrdU. The arrowheads indicate BrdU and GFP double-positive cells. Scale bars, 10 µm. Quantification of the number of GFP-BrdU double-positive cells relative to the total number of GFP-positive cells (C, E). (F) Schematic representation of the cell differentiation assay procedures. (G-J) Ectopic expression of miR-128 increases neurogenesis, while that of miR-Zip-128 decreases the neurogenesis of NPCs. NPCs were electroporated with the indicated plasmids and immunostained with antibodies against TUJ1. The arrowheads indicate TUJ1+GFP+ cells. Scale bars, 50 µm. Quantification of the number of the GFP-TUJ1 double-positive cells relative to the number of GFP-positive cells (H, J). More than 1500 GFP-positive cells were counted for each condition. At least three sets of independent experiments were performed. The values represent the mean ± s.d. (n = 3). Student’s t-test, differences were considered significant at ***p<0.001 and **p<0.01. DOI: http://dx.doi.org/10.7554/eLife.11324.005
Figure 2. miR-128 modulates the proliferation and differentiation of NPCs in vitro. (A) Schematic representation of the cell proliferation assay procedures. (B-E) Ectopic expression of miR-128 decreases proliferation, while that of miR-Zip-128 increases NPC proliferation. NPCs were electroporated with the indicated plasmids and pulse-labeled with BrdU for 6 hr. NPCs were immunostained with an antibody against BrdU. The arrowheads indicate BrdU and GFP double-positive cells. Scale bars, 10 µm. Quantification of the number of GFP-BrdU double-positive cells relative to the total number of GFP-positive cells (C, E). (F) Schematic representation of the cell differentiation assay procedures. (G-J) Ectopic expression of miR-128 increases neurogenesis, while that of miR-Zip-128 decreases the neurogenesis of NPCs. NPCs were electroporated with the indicated plasmids and immunostained with antibodies against TUJ1. The arrowheads indicate TUJ1+GFP+ cells. Scale bars, 50 µm. Quantification of the number of the GFP-TUJ1 double-positive cells relative to the number of GFP-positive cells (H, J). More than 1500 GFP-positive cells were counted for each condition. At least three sets of independent experiments were performed. The values represent the mean ± s.d. (n = 3). Student’s t-test, differences were considered significant at ***p<0.001 and **p<0.01. DOI: http://dx.doi.org/10.7554/eLife.11324.005CC BY · PubMed Central
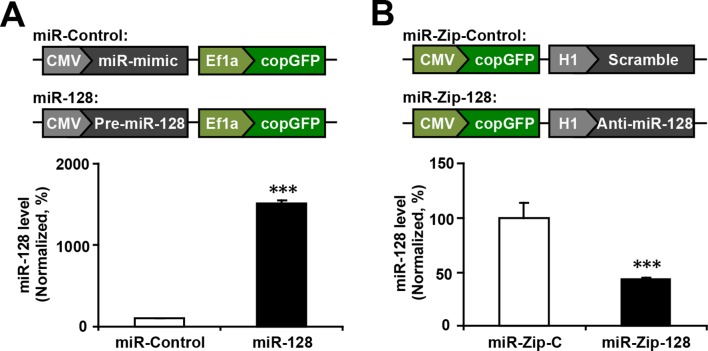
Figure 2—figure supplement 1. miR-128 overexpression and miR-128 knockdown constructs and their expression efficiency. (A) Premature miR-128-1 (pre-miR-128) was cloned into a dual expression construct. The corresponding control construct contained a random miR mimic sequence. (B) qPCR quantification of miR-128 levels in NPCs following transfection with the miR-128 constructs. (C) A shRNA sequence targeting mature miR-128 (anti-miR-128) was cloned into a dual expression construct. The corresponding control construct contained a scrambled shRNA sequence. (D) qPCR quantification of miR-128 levels in NPCs following transfection with the miR-Zip-128 constructs. The values represent the mean ± s.d. (n = 3). Student’s t-test, differences were considered significant at ***p<0.001. DOI: http://dx.doi.org/10.7554/eLife.11324.006
Figure 2—figure supplement 1. miR-128 overexpression and miR-128 knockdown constructs and their expression efficiency. (A) Premature miR-128-1 (pre-miR-128) was cloned into a dual expression construct. The corresponding control construct contained a random miR mimic sequence. (B) qPCR quantification of miR-128 levels in NPCs following transfection with the miR-128 constructs. (C) A shRNA sequence targeting mature miR-128 (anti-miR-128) was cloned into a dual expression construct. The corresponding control construct contained a scrambled shRNA sequence. (D) qPCR quantification of miR-128 levels in NPCs following transfection with the miR-Zip-128 constructs. The values represent the mean ± s.d. (n = 3). Student’s t-test, differences were considered significant at ***p<0.001. DOI: http://dx.doi.org/10.7554/eLife.11324.006CC BY · PubMed Central
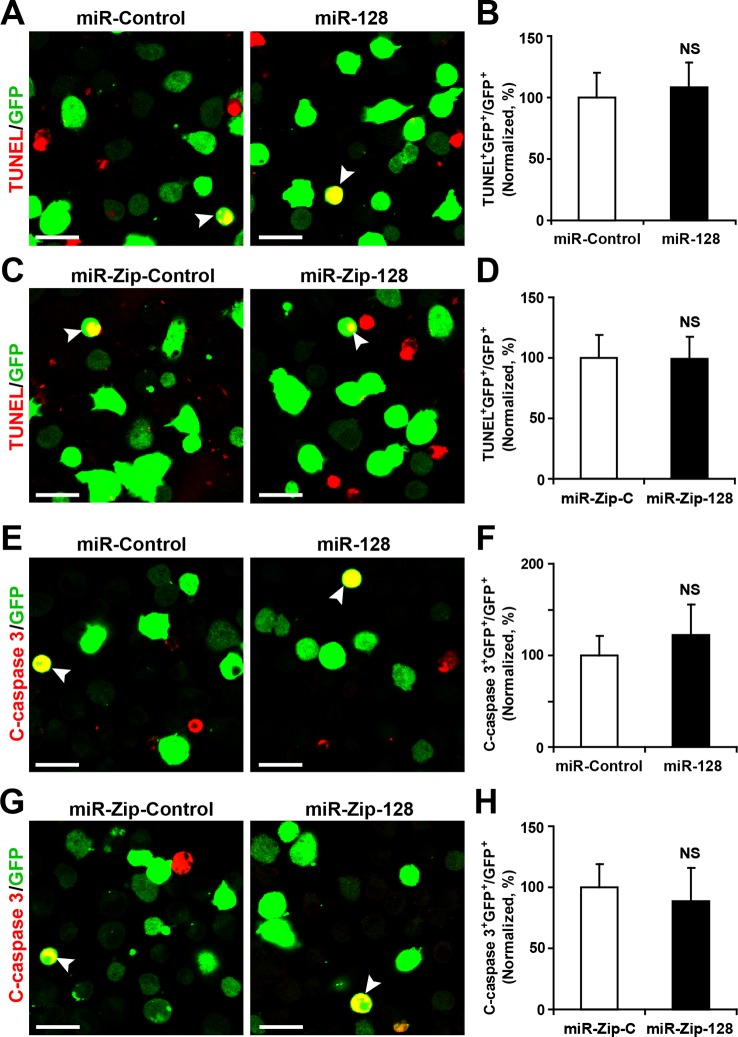
Figure 2—figure supplement 2. miR-128 overexpression and knockdown does not affect NPC apoptosis. (A-D) Ectopic expression of miR-128 and miR-Zip-128 does not affect TUNEL staining. Quantification of the number of GFP-TUNEL double-positive cells relative to the total number of GFP-positive cells (B, D). (E-H) Ectopic expression of miR-128 and miR-Zip-128 does not affect cleaved caspase-3 (C-caspase 3) staining. Scale bars, 20 μm. Quantification of the number of GFP-C-caspase 3 double-positive cells relative to the total number of GFP-positive cells (B, D). More than 1500 GFP-positive cells were counted for each condition. At least three sets of independent experiments were performed. The values represent the mean ± s.d. (n = 3). Student’s t-test, differences were considered significant at *p<0.05. DOI: http://dx.doi.org/10.7554/eLife.11324.007
Figure 2—figure supplement 2. miR-128 overexpression and knockdown does not affect NPC apoptosis. (A-D) Ectopic expression of miR-128 and miR-Zip-128 does not affect TUNEL staining. Quantification of the number of GFP-TUNEL double-positive cells relative to the total number of GFP-positive cells (B, D). (E-H) Ectopic expression of miR-128 and miR-Zip-128 does not affect cleaved caspase-3 (C-caspase 3) staining. Scale bars, 20 μm. Quantification of the number of GFP-C-caspase 3 double-positive cells relative to the total number of GFP-positive cells (B, D). More than 1500 GFP-positive cells were counted for each condition. At least three sets of independent experiments were performed. The values represent the mean ± s.d. (n = 3). Student’s t-test, differences were considered significant at *p<0.05. DOI: http://dx.doi.org/10.7554/eLife.11324.007CC BY · PubMed Central
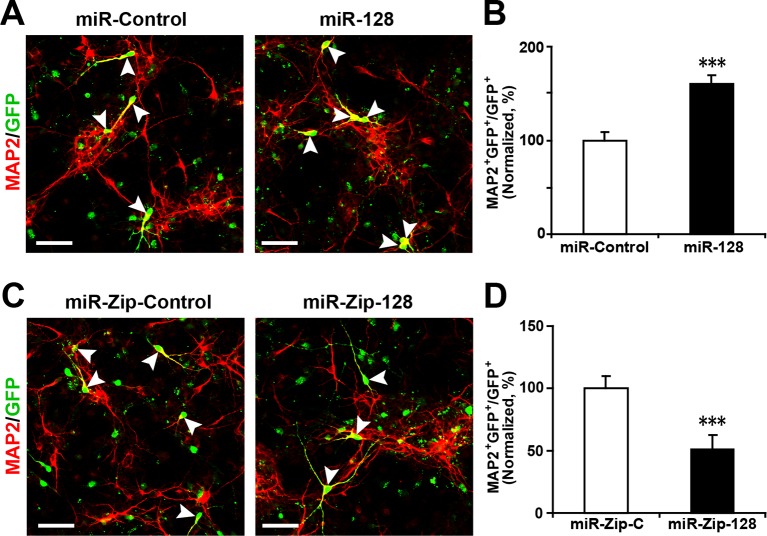
Figure 2—figure supplement 3. Ectopic expression of miR-128 increases neurogenesis, while that of miR-Zip-128 decreases neurogenesis. (A-D) NPCs were electroporated with the indicated plasmids and immunostained with antibodies against MAP2. The arrowheads indicate MAP2+GFP+ cells. Scale bars, 50 µm. Quantification of the number of GFP-MAP2 double-positive cells relative to the number of GFP-positive cells (B, D). More than 1500 GFP-positive cells were counted for each condition. At least three sets of independent experiments were performed. The values represent the mean ± s.d. (n = 3). Student’s t-test, differences were considered significant at ***p<0.001. DOI: http://dx.doi.org/10.7554/eLife.11324.008
Figure 2—figure supplement 3. Ectopic expression of miR-128 increases neurogenesis, while that of miR-Zip-128 decreases neurogenesis. (A-D) NPCs were electroporated with the indicated plasmids and immunostained with antibodies against MAP2. The arrowheads indicate MAP2+GFP+ cells. Scale bars, 50 µm. Quantification of the number of GFP-MAP2 double-positive cells relative to the number of GFP-positive cells (B, D). More than 1500 GFP-positive cells were counted for each condition. At least three sets of independent experiments were performed. The values represent the mean ± s.d. (n = 3). Student’s t-test, differences were considered significant at ***p<0.001. DOI: http://dx.doi.org/10.7554/eLife.11324.008CC BY · PubMed Central
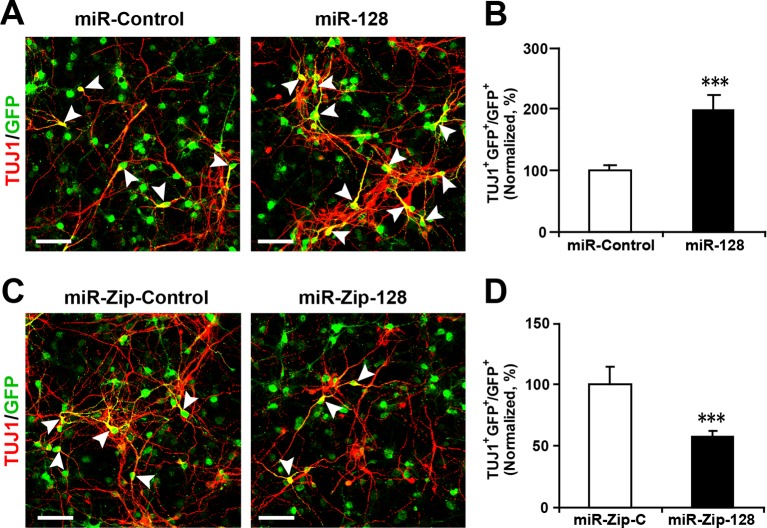
Figure 2—figure supplement 4. Lentivirus-mediated transduction of miR-128 and miR-Zip-128 increases and decreases neurogenesis, respectively. (A-D) NPCs were transduced with lentiviruses carrying the indicated plasmids and immunostained with antibodies against TUJ1. The arrowheads indicate TUJ1+GFP+ cells. Scale bars, 50 µm. Quantification of the number of GFP-TUJ1 double-positive cells relative to the number of GFP-positive cells (B, D). More than 1500 GFP-positive cells were counted for each condition. At least three sets of independent experiments were performed. The values represent the mean ± s.d. (n = 3). Student’s t-test, differences were considered significant at ***p<0.001. DOI: http://dx.doi.org/10.7554/eLife.11324.009
Figure 2—figure supplement 4. Lentivirus-mediated transduction of miR-128 and miR-Zip-128 increases and decreases neurogenesis, respectively. (A-D) NPCs were transduced with lentiviruses carrying the indicated plasmids and immunostained with antibodies against TUJ1. The arrowheads indicate TUJ1+GFP+ cells. Scale bars, 50 µm. Quantification of the number of GFP-TUJ1 double-positive cells relative to the number of GFP-positive cells (B, D). More than 1500 GFP-positive cells were counted for each condition. At least three sets of independent experiments were performed. The values represent the mean ± s.d. (n = 3). Student’s t-test, differences were considered significant at ***p<0.001. DOI: http://dx.doi.org/10.7554/eLife.11324.009CC BY · PubMed Central
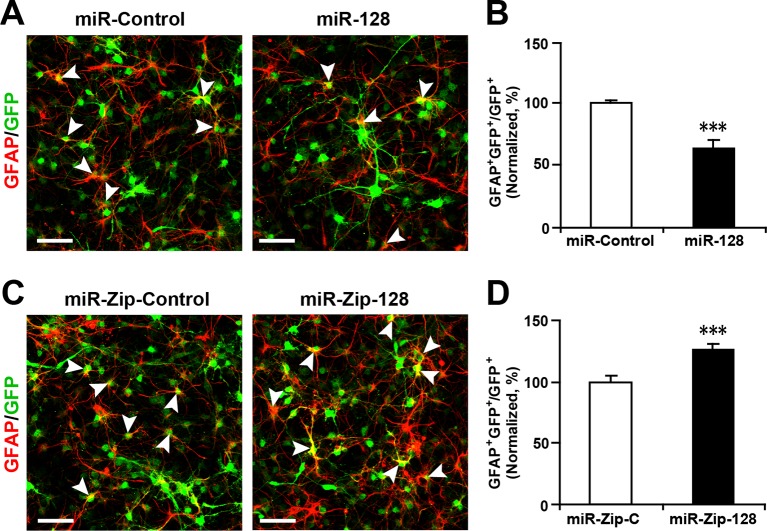
Figure 2—figure supplement 5. Ectopic expression of miR-128 decreases gliogenesis, while that of miR-Zip-128 increases gliogenesis. (A-D) NPCs were transduced with lentiviruses carrying the indicated plasmids and immunostained with antibodies against GFAP. The arrowheads indicate GFAP+GFP+ cells. Scale bars, 50 µm. Quantification of the number of GFP-GFAP double-positive cells relative to the number of GFP-positive cells (B, D). More than 1500 GFP-positive cells were counted for each condition. At least three sets of independent experiments were performed. The values represent the mean ± s.d. (n = 3). Student’s t-test, differences were considered significant at ***p<0.001. DOI: http://dx.doi.org/10.7554/eLife.11324.010
Figure 2—figure supplement 5. Ectopic expression of miR-128 decreases gliogenesis, while that of miR-Zip-128 increases gliogenesis. (A-D) NPCs were transduced with lentiviruses carrying the indicated plasmids and immunostained with antibodies against GFAP. The arrowheads indicate GFAP+GFP+ cells. Scale bars, 50 µm. Quantification of the number of GFP-GFAP double-positive cells relative to the number of GFP-positive cells (B, D). More than 1500 GFP-positive cells were counted for each condition. At least three sets of independent experiments were performed. The values represent the mean ± s.d. (n = 3). Student’s t-test, differences were considered significant at ***p<0.001. DOI: http://dx.doi.org/10.7554/eLife.11324.010CC BY · PubMed Central
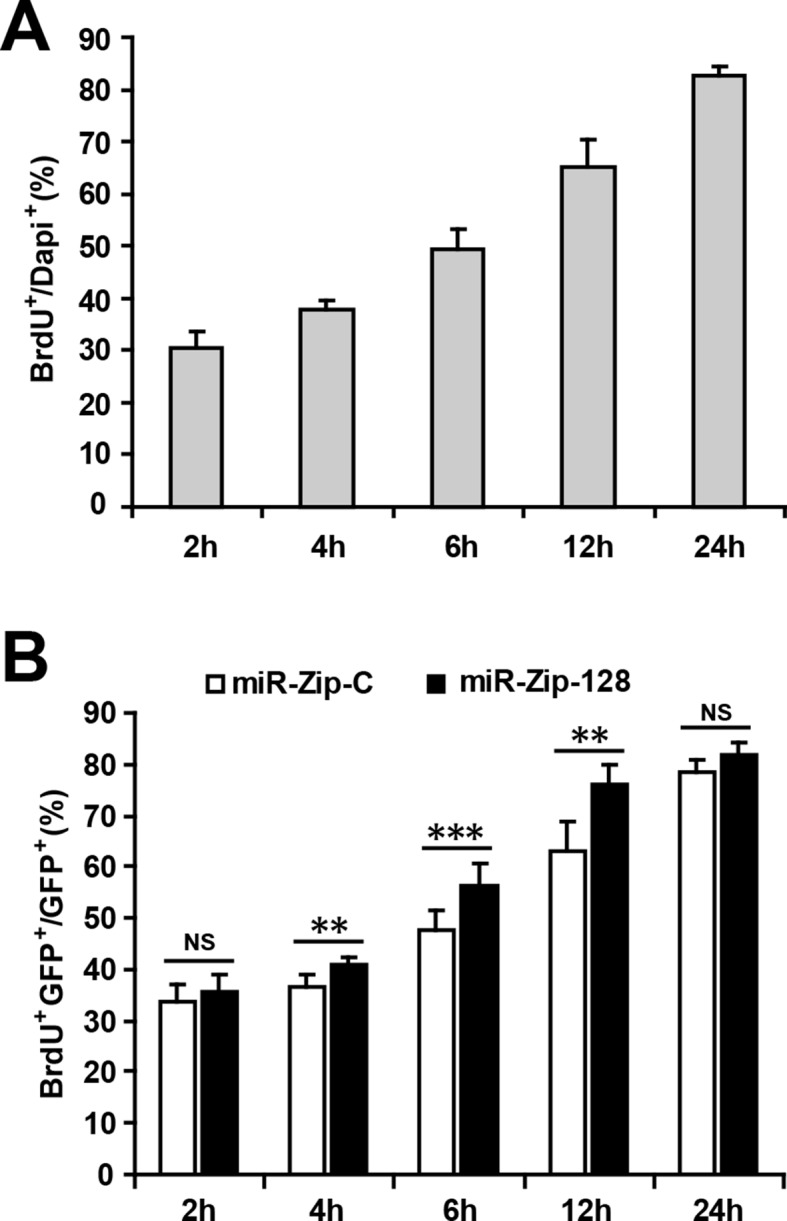
Figure 2—figure supplement 6. Optimizing the duration of BrdU pulse labeling for in vitro NPC proliferation assay. (A) NPCs were pulsed with BrdU for the indicated duration before fixation. Quantification of BrdU-positive cells over total DAPI-positive cells. (B) Following electroporation with either miR-128-ZIP or the control constructs NPCs were pulsed with BrdU for the indicated duration. Quantification of BrdU- GFP-double-positive cells over GFP-positive cells shows that after 4 hr of BrdU exposure, NPCs electroporated with miR-128-ZIP show significantly increased BrdU incorporation compared to control. At least 1500 cells were counted for each condition. The values represent the means ± s.d. (n = 3). Student’s t-test, differences were considered significant at ***p<0.001, **p<0.01. DOI: http://dx.doi.org/10.7554/eLife.11324.011
Figure 2—figure supplement 6. Optimizing the duration of BrdU pulse labeling for in vitro NPC proliferation assay. (A) NPCs were pulsed with BrdU for the indicated duration before fixation. Quantification of BrdU-positive cells over total DAPI-positive cells. (B) Following electroporation with either miR-128-ZIP or the control constructs NPCs were pulsed with BrdU for the indicated duration. Quantification of BrdU- GFP-double-positive cells over GFP-positive cells shows that after 4 hr of BrdU exposure, NPCs electroporated with miR-128-ZIP show significantly increased BrdU incorporation compared to control. At least 1500 cells were counted for each condition. The values represent the means ± s.d. (n = 3). Student’s t-test, differences were considered significant at ***p<0.001, **p<0.01. DOI: http://dx.doi.org/10.7554/eLife.11324.011CC BY · PubMed Central
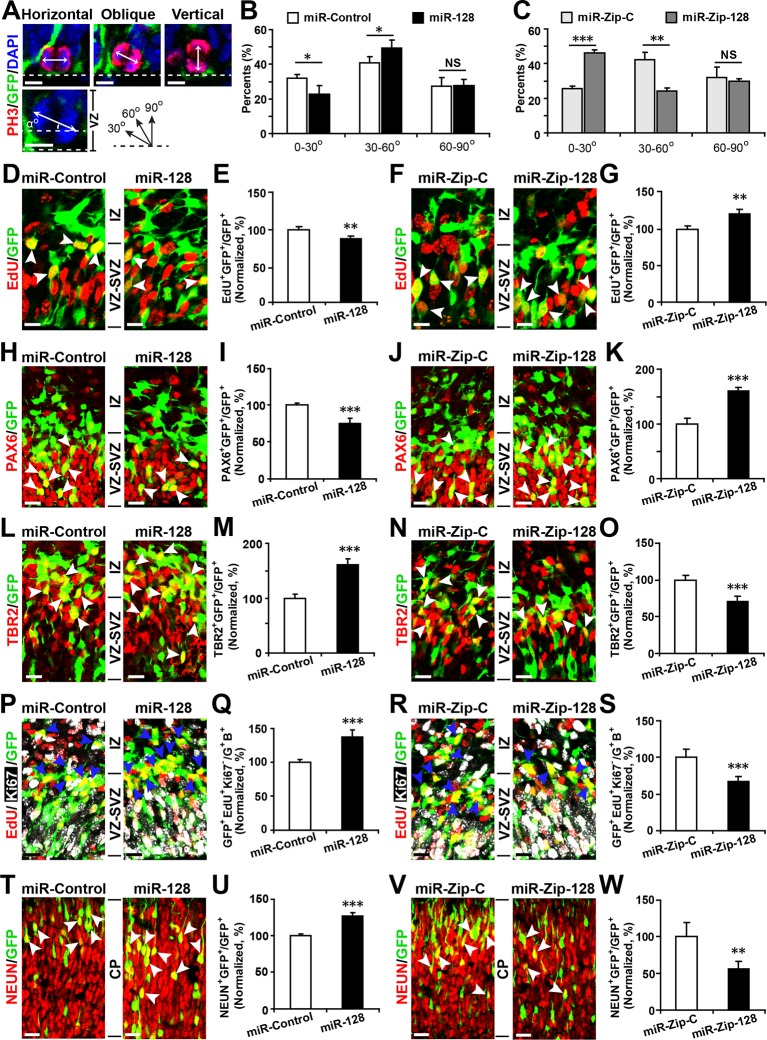
Figure 3. miR-128 regulates the proliferation and differentiation of NPCs in vivo. (A-C) miR-128 regulates the symmetric division of apical progenitors in the VZ/SVZ. Mouse embryos were electroporated at E13.5 with the indicated plasmids and sacrificed at E14.5. The nuclei of mitotic cells were labeled using antibodies against PH3. The orientation of the mitotic spindle relative to the ventricular surface was determined and categorized into horizontal (0–30°), oblique (30–60°), or vertical (60–90°) as pictured. Scale bars, 5 µm. (A). Percentage of GFP and PH3 double-positive cells with the indicated mitotic spindle orientation following miR-128 overexpression (B) and miR-128 knockdown (C). (D-G) miR-128 regulates the proliferation of apical progenitors in the VZ/SVZ. Mouse embryos were electroporated at E13.5 with the indicated constructs. Twenty-four hours post-electroporation, dividing cells were marked by EdU pulse-labeling for 2 hr and sacrificed. The arrowheads indicate EdU+GFP+ cells. Scale bars, 10 µm. Quantification of the number of GFP-EdU double-positive cells relative to the number of GFP-positive cells (E, G). (H–K) Ectopic expression of miR-128 decreases apical progenitors, while that of miR-Zip-128 increases apical progenitors. Mouse embryos were electroporated at E13.5 with the indicated constructs and sacrificed at E14.5. Brain sections were immunostained with antibodies against PAX6. The arrowheads indicate PAX6+GFP+ cells. Scale bars, 10 µm. Quantification of the number of GFP-PAX6 double-positive cells relative to the number of GFP-positive cells (I, K). (L–O) Ectopic expression of miR-128 increases basal progenitors, while that of miR-Zip-128 decreases basal progenitors. Mouse embryos were electroporated at E13.5 with the indicated constructs and sacrificed at E14.5. Brain sections were immunostained with antibodies against TBR2. The arrowheads indicate TBR2+GFP+ cells. Scale bars, 10 µm. Quantification of the number of GFP-TBR2 double-positive cells relative to the number of GFP-positive cells (M, O). (P-S) miR-128 promotes cell cycle exit, and miR-Zip-128 inhibits cell cycle exit. Mouse embryos were electroporated at E13.5 with the indicated constructs. Twenty-four hours post-electroporation, dividing cells were marked by EdU pulse-labeling for 24 hr and sacrificed. The brain sections were immunostained with antibodies against Ki67. The blue arrowheads indicate GFP+EdU+Ki67- cells that had exited the cell cycle. Scale bars, 10 µm. Quantification of the number of GFP-EdU double-positive, Ki67-negative cells relative to the number of GFP-BrdU double-positive cells (Q, S). (T-W) miR-128 promotes the differentiation of NPCs in vivo. Mouse embryos were electroporated at E13.5 with the indicated constructs and sacrificed at E17.5. Brain slices were immunostained for NEUN. Arrowheads indicate NEUN+GFP+ cells. Scale bars, 10 µm. Quantification of the number of GFP-NEUN double-positive cells relative to the number of GFP-positive cells (U, W). More than 1500 GFP-positive cells were counted for each condition. At least three sets of independent experiments were performed. The values represent the mean ± s.d. (n = 3). Student’s t-test, differences were considered significant at ***p<0.001, **p<0.01, and *p<0.05. DOI: http://dx.doi.org/10.7554/eLife.11324.012
Figure 3. miR-128 regulates the proliferation and differentiation of NPCs in vivo. (A-C) miR-128 regulates the symmetric division of apical progenitors in the VZ/SVZ. Mouse embryos were electroporated at E13.5 with the indicated plasmids and sacrificed at E14.5. The nuclei of mitotic cells were labeled using antibodies against PH3. The orientation of the mitotic spindle relative to the ventricular surface was determined and categorized into horizontal (0–30°), oblique (30–60°), or vertical (60–90°) as pictured. Scale bars, 5 µm. (A). Percentage of GFP and PH3 double-positive cells with the indicated mitotic spindle orientation following miR-128 overexpression (B) and miR-128 knockdown (C). (D-G) miR-128 regulates the proliferation of apical progenitors in the VZ/SVZ. Mouse embryos were electroporated at E13.5 with the indicated constructs. Twenty-four hours post-electroporation, dividing cells were marked by EdU pulse-labeling for 2 hr and sacrificed. The arrowheads indicate EdU+GFP+ cells. Scale bars, 10 µm. Quantification of the number of GFP-EdU double-positive cells relative to the number of GFP-positive cells (E, G). (H–K) Ectopic expression of miR-128 decreases apical progenitors, while that of miR-Zip-128 increases apical progenitors. Mouse embryos were electroporated at E13.5 with the indicated constructs and sacrificed at E14.5. Brain sections were immunostained with antibodies against PAX6. The arrowheads indicate PAX6+GFP+ cells. Scale bars, 10 µm. Quantification of the number of GFP-PAX6 double-positive cells relative to the number of GFP-positive cells (I, K). (L–O) Ectopic expression of miR-128 increases basal progenitors, while that of miR-Zip-128 decreases basal progenitors. Mouse embryos were electroporated at E13.5 with the indicated constructs and sacrificed at E14.5. Brain sections were immunostained with antibodies against TBR2. The arrowheads indicate TBR2+GFP+ cells. Scale bars, 10 µm. Quantification of the number of GFP-TBR2 double-positive cells relative to the number of GFP-positive cells (M, O). (P-S) miR-128 promotes cell cycle exit, and miR-Zip-128 inhibits cell cycle exit. Mouse embryos were electroporated at E13.5 with the indicated constructs. Twenty-four hours post-electroporation, dividing cells were marked by EdU pulse-labeling for 24 hr and sacrificed. The brain sections were immunostained with antibodies against Ki67. The blue arrowheads indicate GFP+EdU+Ki67- cells that had exited the cell cycle. Scale bars, 10 µm. Quantification of the number of GFP-EdU double-positive, Ki67-negative cells relative to the number of GFP-BrdU double-positive cells (Q, S). (T-W) miR-128 promotes the differentiation of NPCs in vivo. Mouse embryos were electroporated at E13.5 with the indicated constructs and sacrificed at E17.5. Brain slices were immunostained for NEUN. Arrowheads indicate NEUN+GFP+ cells. Scale bars, 10 µm. Quantification of the number of GFP-NEUN double-positive cells relative to the number of GFP-positive cells (U, W). More than 1500 GFP-positive cells were counted for each condition. At least three sets of independent experiments were performed. The values represent the mean ± s.d. (n = 3). Student’s t-test, differences were considered significant at ***p<0.001, **p<0.01, and *p<0.05. DOI: http://dx.doi.org/10.7554/eLife.11324.012CC BY · PubMed Central
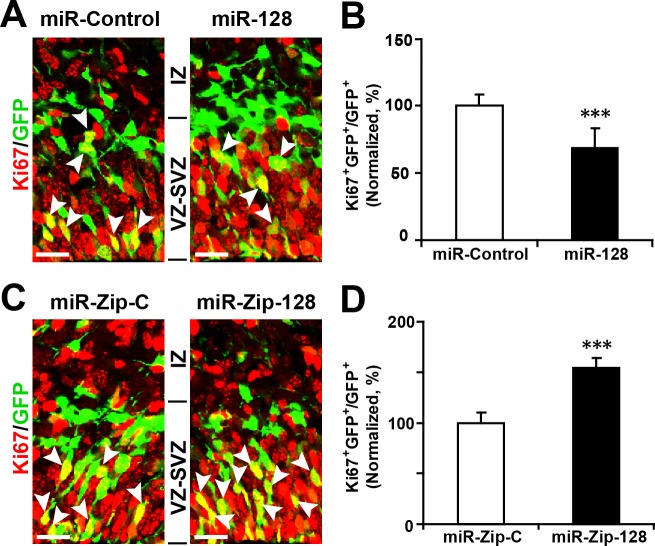
Figure 3—figure supplement 1. Ectopic expression of miR-128 decreases proliferation, while that of miR-Zip-128 increases proliferation in vivo. (A-D) Mouse embryos were electroporated at E13.5 with the indicated constructs and sacrificed at E14.5. Brain sections were immunostained with antibodies against Ki67. The arrowheads indicate Ki67+GFP+ cells. Scale bars, 10 µm. Quantification of the number of GFP-Ki67 double-positive cells relative to the number of GFP-positive cells (B, D). More than 1500 GFP-positive cells were counted for each condition. At least three sets of independent experiments were performed. The values represent the mean ± s.d. (n = 3). Student’s t-test, differences were considered significant at ***p<0.001. DOI: http://dx.doi.org/10.7554/eLife.11324.013
Figure 3—figure supplement 1. Ectopic expression of miR-128 decreases proliferation, while that of miR-Zip-128 increases proliferation in vivo. (A-D) Mouse embryos were electroporated at E13.5 with the indicated constructs and sacrificed at E14.5. Brain sections were immunostained with antibodies against Ki67. The arrowheads indicate Ki67+GFP+ cells. Scale bars, 10 µm. Quantification of the number of GFP-Ki67 double-positive cells relative to the number of GFP-positive cells (B, D). More than 1500 GFP-positive cells were counted for each condition. At least three sets of independent experiments were performed. The values represent the mean ± s.d. (n = 3). Student’s t-test, differences were considered significant at ***p<0.001. DOI: http://dx.doi.org/10.7554/eLife.11324.013CC BY · PubMed Central
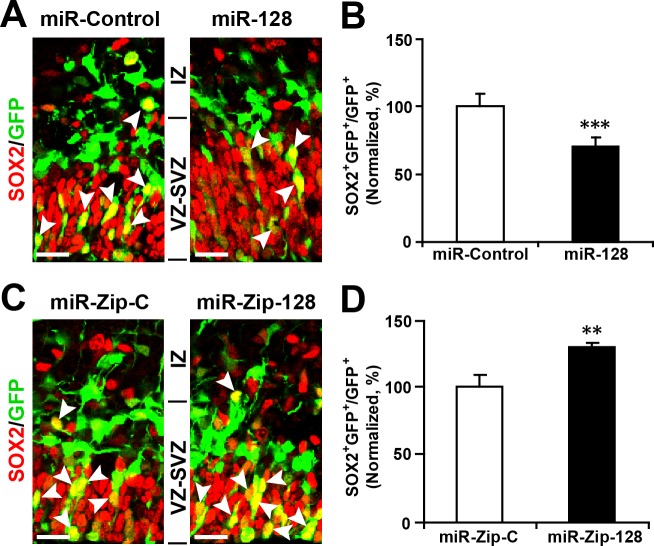
Figure 3—figure supplement 2. Ectopic expression of miR-128 decreases apical progenitors, while that of miR-Zip-128 increases apical progenitors. (A-D) Mouse embryos were electroporated at E13.5 with the indicated constructs and sacrificed at E14.5. Brain sections were immunostained with antibodies against SOX2. The arrowheads indicate SOX2+GFP+ cells. Scale bars, 10 µm. Quantification of the number of GFP-SOX2 double-positive cells relative to the number of GFP-positive cells (B, D). More than 1500 GFP-positive cells were counted for each condition. At least three sets of independent experiments were performed. The values represent the mean ± s.d. (n = 3). Student’s t-test, differences were considered significant at ***p<0.001 and **p<0.01. DOI: http://dx.doi.org/10.7554/eLife.11324.014
Figure 3—figure supplement 2. Ectopic expression of miR-128 decreases apical progenitors, while that of miR-Zip-128 increases apical progenitors. (A-D) Mouse embryos were electroporated at E13.5 with the indicated constructs and sacrificed at E14.5. Brain sections were immunostained with antibodies against SOX2. The arrowheads indicate SOX2+GFP+ cells. Scale bars, 10 µm. Quantification of the number of GFP-SOX2 double-positive cells relative to the number of GFP-positive cells (B, D). More than 1500 GFP-positive cells were counted for each condition. At least three sets of independent experiments were performed. The values represent the mean ± s.d. (n = 3). Student’s t-test, differences were considered significant at ***p<0.001 and **p<0.01. DOI: http://dx.doi.org/10.7554/eLife.11324.014CC BY · PubMed Central
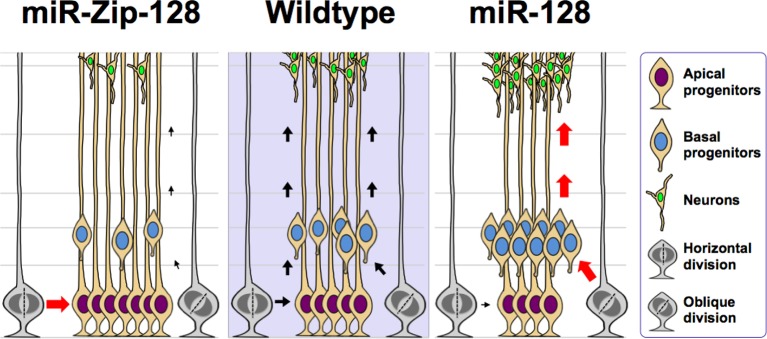
Figure 3—figure supplement 3. Model of the miR-128 in vivo phenotype. miR-128 overexpression in embryonic neural stem cells leads to two phenotypes that when combined together, ultimately results in amplified neurogenesis. First, an increase in the asymmetric cell division of apical progenitors occurs, which results in a relatively higher number of basal progenitors and a lower number of apical progenitors. Second, an increase in cell cycle exit occurs in the expanded basal progenitor pool, which leads to a greater number of neurons. miR-128 knockdown results in the opposite phenotypes, namely an increase in the symmetric cell division of apical progenitors, resulting in a relatively higher number of apical progenitors and a lower number of basal progenitors. In addition, the basal progenitors do not exit the cell cycle as readily, ultimately leading to a smaller number of neurons. DOI: http://dx.doi.org/10.7554/eLife.11324.015
Figure 3—figure supplement 3. Model of the miR-128 in vivo phenotype. miR-128 overexpression in embryonic neural stem cells leads to two phenotypes that when combined together, ultimately results in amplified neurogenesis. First, an increase in the asymmetric cell division of apical progenitors occurs, which results in a relatively higher number of basal progenitors and a lower number of apical progenitors. Second, an increase in cell cycle exit occurs in the expanded basal progenitor pool, which leads to a greater number of neurons. miR-128 knockdown results in the opposite phenotypes, namely an increase in the symmetric cell division of apical progenitors, resulting in a relatively higher number of apical progenitors and a lower number of basal progenitors. In addition, the basal progenitors do not exit the cell cycle as readily, ultimately leading to a smaller number of neurons. DOI: http://dx.doi.org/10.7554/eLife.11324.015CC BY · PubMed Central
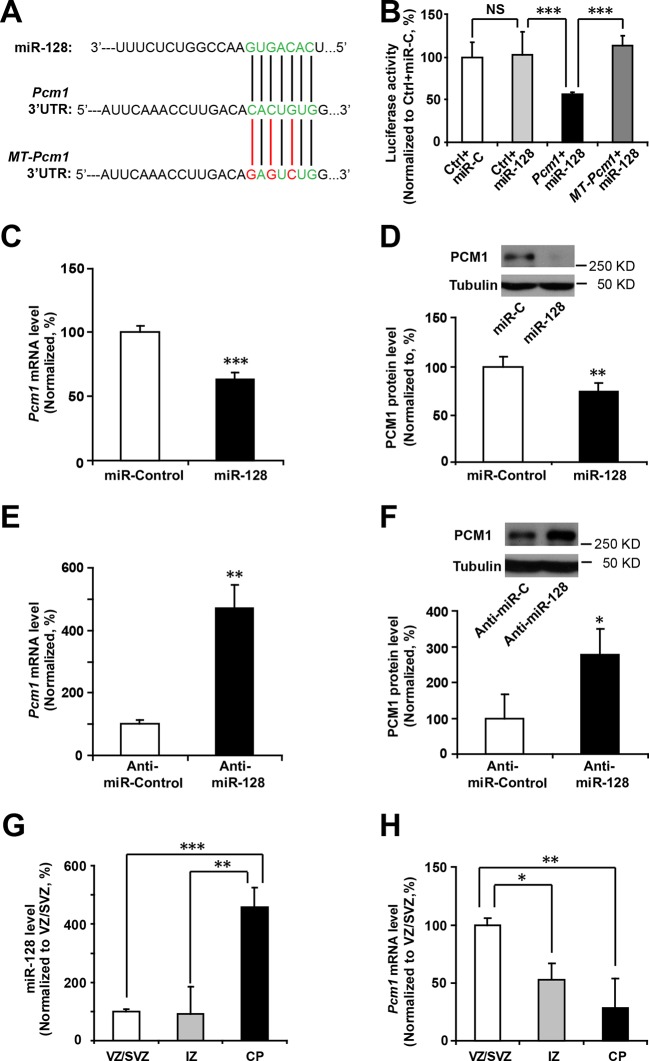
Figure 4. miR-128 regulates PCM1 expression in NPCs. (A) TargetScan analysis identified a miR-128 target site in the mouse Pcm1 3’-UTR region (highlighted in green). The mutant PCM1 is shown, with the seed binding sites highlighted in red. (B) PCM1 luciferase activity is suppressed by miR-128. HEK293T cells were co-transfected with miR-128 and the 3’-UTR of Pcm1 containing either the miRNA binding site (WT) or mutant (MT) versions of the Pcm1 seed binding sites for 2 days. The cells were harvested and lysed, and a luciferase activity assay was then performed. miR-128-mediated suppression of PCM1 luciferase activity was relieved upon mutation of the Pcm1 seed binding sites. (C,D) miR-128 overexpression in NPCs led to reduced endogenous Pcm1 mRNA levels, as determined by qPCR (C), and PCM1 protein expression, as demonstrated via densitometry analysis of western blots (D). (E,F) anti-miR-128 leads to increased endogenous Pcm1 mRNA levels, as demonstrated by qPCR (E), and protein expression of PCM1 (F). (G,H) LCM was used to isolate RNA from three specific cortical layers of E14.5 embryonic brains: the VZ/SVZ, IZ, and CP. qPCR quantification of miR-128 levels (G) and Pcm1 mRNA levels (H). At least three sets of independent experiments were performed. The values represent the mean ± s.d. (n = 3). Student’s t-test, differences were considered significant at ***p<0.001, **p<0.01, and *p<0.05 for all panels in the figure. ANOVA, differences were considered significant at ***p<0.001 and **p<0.01. DOI: http://dx.doi.org/10.7554/eLife.11324.016
Figure 4. miR-128 regulates PCM1 expression in NPCs. (A) TargetScan analysis identified a miR-128 target site in the mouse Pcm1 3’-UTR region (highlighted in green). The mutant PCM1 is shown, with the seed binding sites highlighted in red. (B) PCM1 luciferase activity is suppressed by miR-128. HEK293T cells were co-transfected with miR-128 and the 3’-UTR of Pcm1 containing either the miRNA binding site (WT) or mutant (MT) versions of the Pcm1 seed binding sites for 2 days. The cells were harvested and lysed, and a luciferase activity assay was then performed. miR-128-mediated suppression of PCM1 luciferase activity was relieved upon mutation of the Pcm1 seed binding sites. (C,D) miR-128 overexpression in NPCs led to reduced endogenous Pcm1 mRNA levels, as determined by qPCR (C), and PCM1 protein expression, as demonstrated via densitometry analysis of western blots (D). (E,F) anti-miR-128 leads to increased endogenous Pcm1 mRNA levels, as demonstrated by qPCR (E), and protein expression of PCM1 (F). (G,H) LCM was used to isolate RNA from three specific cortical layers of E14.5 embryonic brains: the VZ/SVZ, IZ, and CP. qPCR quantification of miR-128 levels (G) and Pcm1 mRNA levels (H). At least three sets of independent experiments were performed. The values represent the mean ± s.d. (n = 3). Student’s t-test, differences were considered significant at ***p<0.001, **p<0.01, and *p<0.05 for all panels in the figure. ANOVA, differences were considered significant at ***p<0.001 and **p<0.01. DOI: http://dx.doi.org/10.7554/eLife.11324.016CC BY · PubMed Central
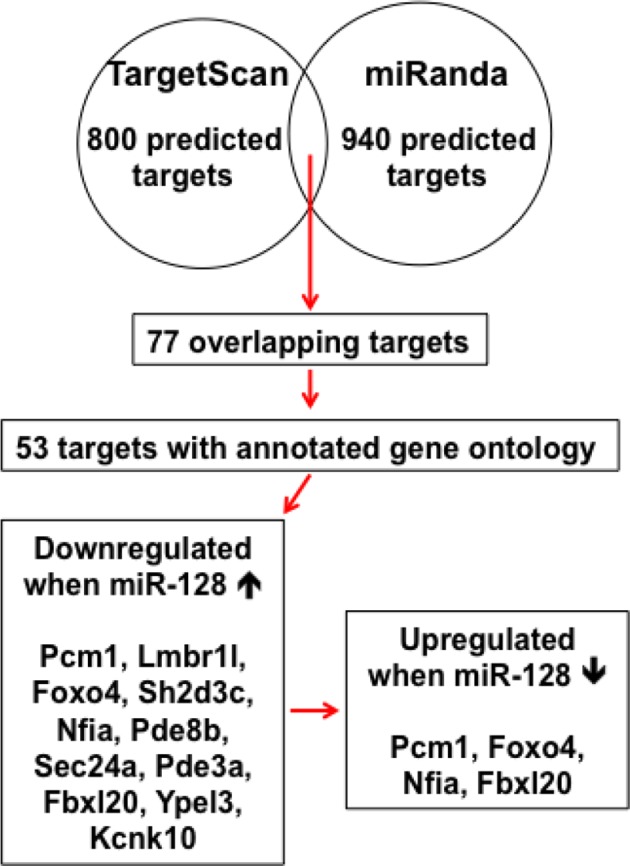
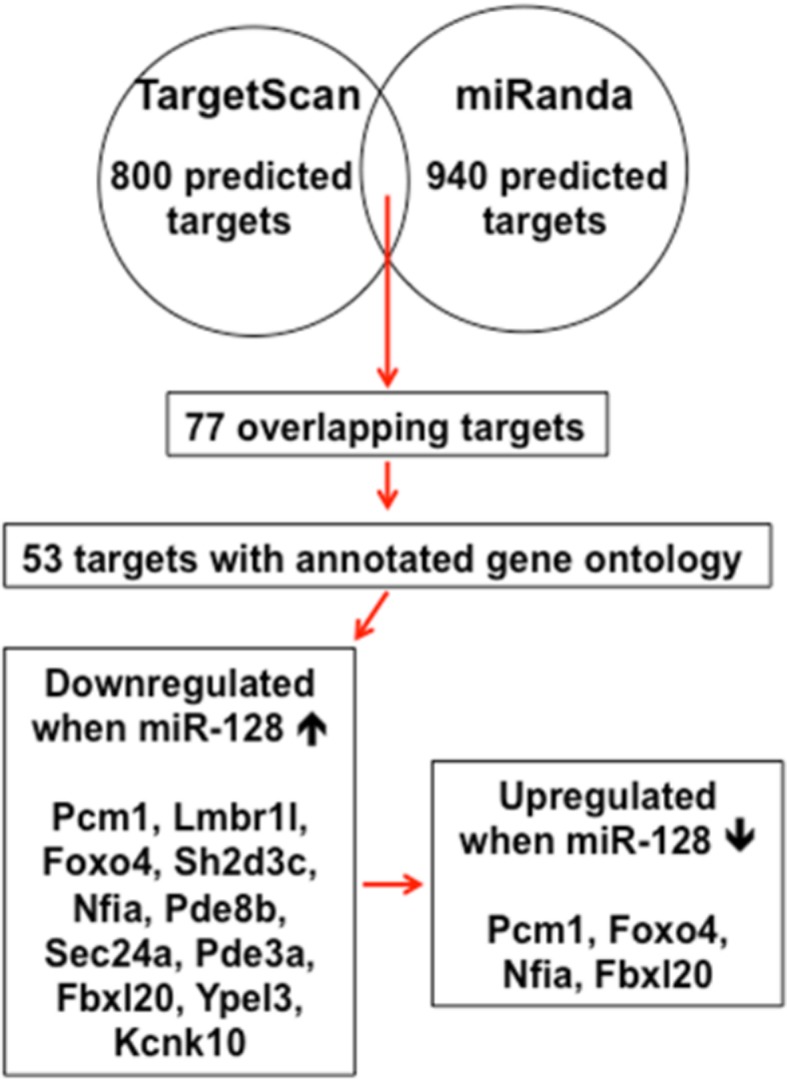
Figure 4—figure supplement 1. Schematic diagram outlines rationale of gene selection process. Two widely used in silico microRNA target prediction databases (TargetScan and miRanda) predicted 800 and 940 potential targets of miR-128 respectively. Among the 77 overlapping targets only 53 were annotated to have known biological function and only 11 out of the 53 genes exhibited consistent reduction in mRNA levels upon miR-128 overexpression in cultured mouse NPCs and were further tested for reciprocal upregulation when miR-128 was inhibited. Lastly, upon miR-128 inhibition in NPCs, only Pcm1, Nfia, Foxo4, and Fbxl20 were consistently upregulated. DOI: http://dx.doi.org/10.7554/eLife.11324.021
Figure 4—figure supplement 1. Schematic diagram outlines rationale of gene selection process. Two widely used in silico microRNA target prediction databases (TargetScan and miRanda) predicted 800 and 940 potential targets of miR-128 respectively. Among the 77 overlapping targets only 53 were annotated to have known biological function and only 11 out of the 53 genes exhibited consistent reduction in mRNA levels upon miR-128 overexpression in cultured mouse NPCs and were further tested for reciprocal upregulation when miR-128 was inhibited. Lastly, upon miR-128 inhibition in NPCs, only Pcm1, Nfia, Foxo4, and Fbxl20 were consistently upregulated. DOI: http://dx.doi.org/10.7554/eLife.11324.021CC BY · PubMed Central
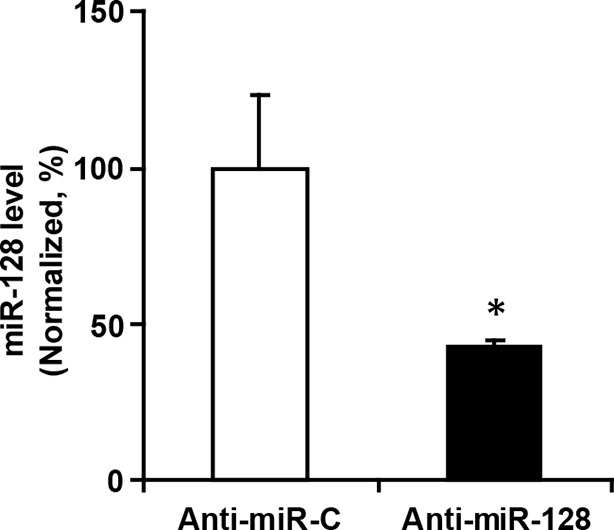
Figure 4—figure supplement 2. miR-128 inhibitor knockdown efficiency. qPCR quantification of miR-128 levels in NPCs following transfection with 2 µg miR-128 inhibitor (anti-miR-128) compared to the scramble control (anti-miR-control). The values represent the mean ± s.d. (n = 3). Student’s t-test, differences were considered significant at *p<0.05. DOI: http://dx.doi.org/10.7554/eLife.11324.022
Figure 4—figure supplement 2. miR-128 inhibitor knockdown efficiency. qPCR quantification of miR-128 levels in NPCs following transfection with 2 µg miR-128 inhibitor (anti-miR-128) compared to the scramble control (anti-miR-control). The values represent the mean ± s.d. (n = 3). Student’s t-test, differences were considered significant at *p<0.05. DOI: http://dx.doi.org/10.7554/eLife.11324.022CC BY · PubMed Central
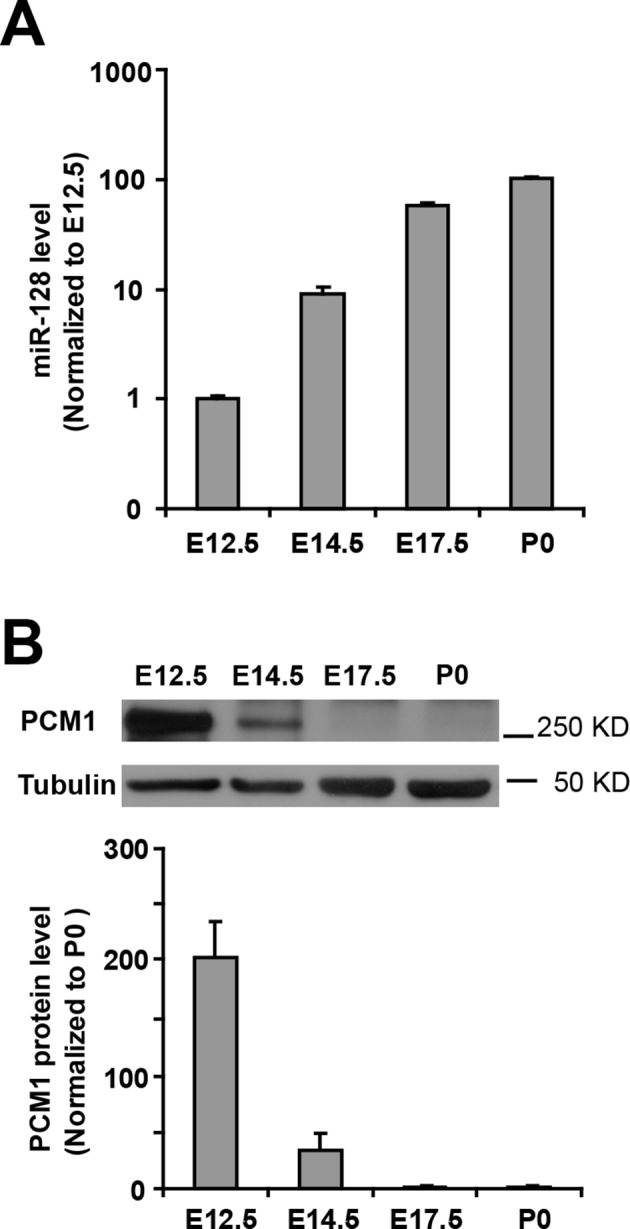
Figure 4—figure supplement 3. Inverse relationship between the temporal expression patterns of miR-128 and PCM1. (A) Real-time PCR analyses of miR-128 from brain tissues at various developmental stages. miR-128 expression was measured and normalized to that of U6 and is shown relative to the E12.5 expression level. The values represent the mean ± s.d. (n = 3). (B) Western blot of PCM1 expression in brain lysates prepared at various developmental stages with densitometry analysis. The values represent the mean ± s.d. (n = 3). Student’s t-test, differences were considered significant at *p<0.05. DOI: http://dx.doi.org/10.7554/eLife.11324.023
Figure 4—figure supplement 3. Inverse relationship between the temporal expression patterns of miR-128 and PCM1. (A) Real-time PCR analyses of miR-128 from brain tissues at various developmental stages. miR-128 expression was measured and normalized to that of U6 and is shown relative to the E12.5 expression level. The values represent the mean ± s.d. (n = 3). (B) Western blot of PCM1 expression in brain lysates prepared at various developmental stages with densitometry analysis. The values represent the mean ± s.d. (n = 3). Student’s t-test, differences were considered significant at *p<0.05. DOI: http://dx.doi.org/10.7554/eLife.11324.023CC BY · PubMed Central
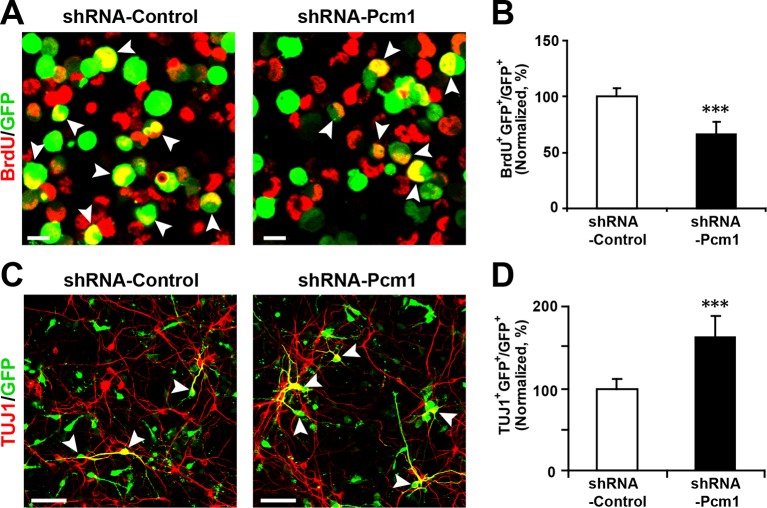
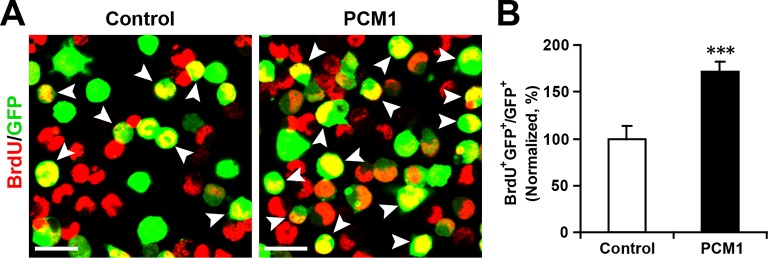
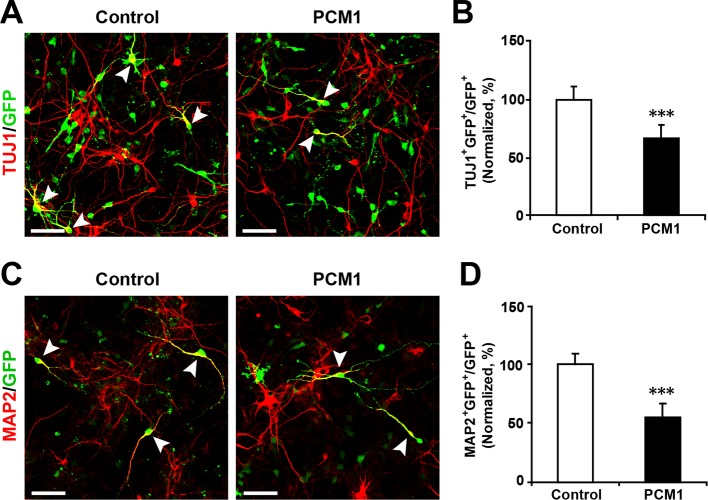
Figure 5. PCM1 knockdown decreases NPC neurogenesis. (A,B) PCM1 knockdown in NPCs decreases neural proliferation. NPCs were electroporated with a plasmid expressing PCM1 shRNA or with a control vector and pulse-labeled with BrdU for 6 hr. NPCs were immunostained with an antibody against BrdU. The arrowheads indicate BrdU and GFP double-positive cells. Scale bars, 10 µm. Quantification of the number of GFP-BrdU double-positive cells relative to the total number of GFP-positive cells (B). (C,D) PCM1 knockdown in NPCs increases neurogenesis. NPCs were electroporated with a plasmid expressing PCM1 shRNA or with a control vector and then immunostained with antibodies against TUJ1. The arrowheads indicate TUJ1+GFP+ cells. Scale bars, 50 µm. Quantification of the number of GFP-TUJ1 double-positive cells relative to the number of GFP-positive cells (D). More than 1500 GFP-positive cells were counted for each condition. At least three sets of independent experiments were performed. The values represent the mean ± s.d. (n = 3). Student’s t-test, differences were considered significant at ***p<0.001. DOI: http://dx.doi.org/10.7554/eLife.11324.024
Figure 5. PCM1 knockdown decreases NPC neurogenesis. (A,B) PCM1 knockdown in NPCs decreases neural proliferation. NPCs were electroporated with a plasmid expressing PCM1 shRNA or with a control vector and pulse-labeled with BrdU for 6 hr. NPCs were immunostained with an antibody against BrdU. The arrowheads indicate BrdU and GFP double-positive cells. Scale bars, 10 µm. Quantification of the number of GFP-BrdU double-positive cells relative to the total number of GFP-positive cells (B). (C,D) PCM1 knockdown in NPCs increases neurogenesis. NPCs were electroporated with a plasmid expressing PCM1 shRNA or with a control vector and then immunostained with antibodies against TUJ1. The arrowheads indicate TUJ1+GFP+ cells. Scale bars, 50 µm. Quantification of the number of GFP-TUJ1 double-positive cells relative to the number of GFP-positive cells (D). More than 1500 GFP-positive cells were counted for each condition. At least three sets of independent experiments were performed. The values represent the mean ± s.d. (n = 3). Student’s t-test, differences were considered significant at ***p<0.001. DOI: http://dx.doi.org/10.7554/eLife.11324.024CC BY · PubMed Central
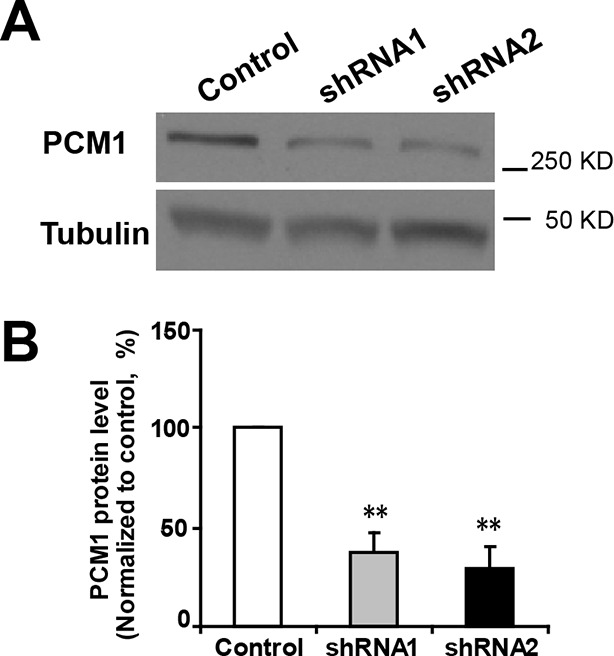
Figure 5—figure supplement 1. Efficient knockdown of PCM1. (A) PCM1 knockdown in N2A cells demonstrated by western blots. (B) Densitometry analysis of western blots presented in (A). PCM1 shRNA2 was used for further proliferation and neurogenesis analysis in NPCs. At least three sets of independent experiments were performed. The values represent the mean ± s.d. (n = 3). Student’s t-test, differences were considered significant at **p<0.01. DOI: http://dx.doi.org/10.7554/eLife.11324.025
Figure 5—figure supplement 1. Efficient knockdown of PCM1. (A) PCM1 knockdown in N2A cells demonstrated by western blots. (B) Densitometry analysis of western blots presented in (A). PCM1 shRNA2 was used for further proliferation and neurogenesis analysis in NPCs. At least three sets of independent experiments were performed. The values represent the mean ± s.d. (n = 3). Student’s t-test, differences were considered significant at **p<0.01. DOI: http://dx.doi.org/10.7554/eLife.11324.025CC BY · PubMed Central
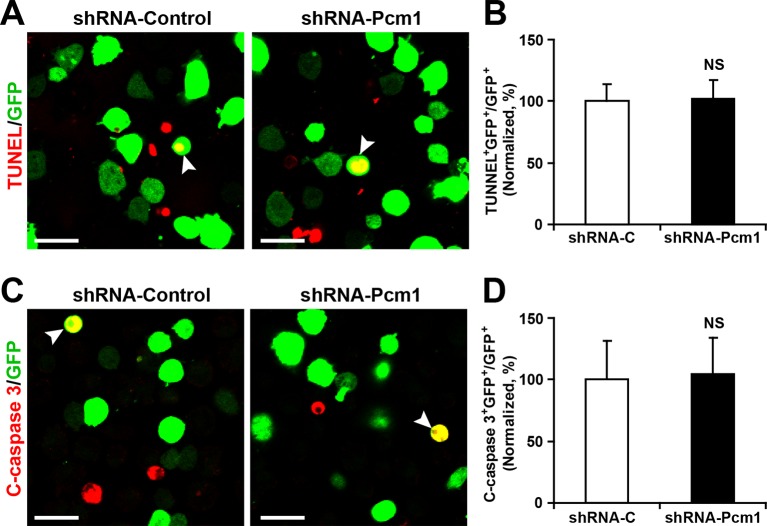
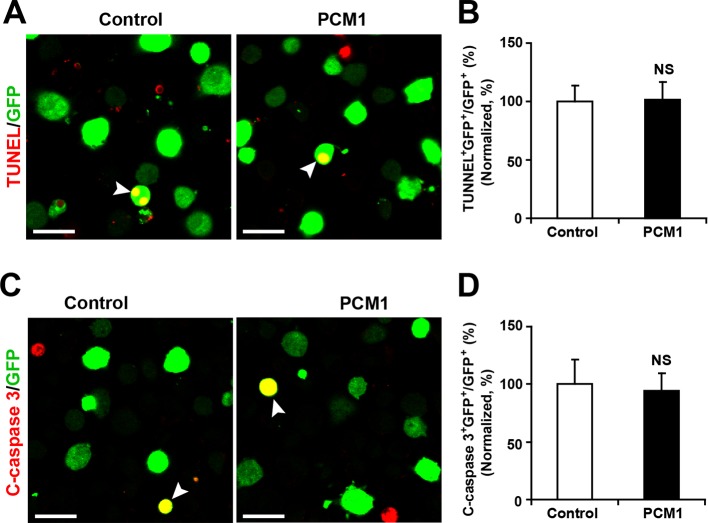
Figure 5—figure supplement 2. PCM1 knockdown in NPCs did not trigger apoptotic cell death. (A,B) Ectopic expression of PCM1 shRNA does not affect TUNEL staining. Quantification of the number of GFP-TUNEL double-positive cells relative to the total number of GFP-positive cells (B). (C,D) Ectopic expression of PCM1 shRNA does not affect cleaved caspase-3 (C-caspase 3) staining. Scale bars, 20 μm. Quantification of the number of GFP-C-caspase 3 double-positive cells relative to the total number of GFP-positive cells (D). More than 1500 GFP-positive cells were counted for each condition. At least three sets of independent experiments were performed. The values represent the mean ± s.d. (n = 3). Student’s t-test, differences were considered significant at *p<0.05. DOI: http://dx.doi.org/10.7554/eLife.11324.026
Figure 5—figure supplement 2. PCM1 knockdown in NPCs did not trigger apoptotic cell death. (A,B) Ectopic expression of PCM1 shRNA does not affect TUNEL staining. Quantification of the number of GFP-TUNEL double-positive cells relative to the total number of GFP-positive cells (B). (C,D) Ectopic expression of PCM1 shRNA does not affect cleaved caspase-3 (C-caspase 3) staining. Scale bars, 20 μm. Quantification of the number of GFP-C-caspase 3 double-positive cells relative to the total number of GFP-positive cells (D). More than 1500 GFP-positive cells were counted for each condition. At least three sets of independent experiments were performed. The values represent the mean ± s.d. (n = 3). Student’s t-test, differences were considered significant at *p<0.05. DOI: http://dx.doi.org/10.7554/eLife.11324.026CC BY · PubMed Central
Figure 5—figure supplement 3. PCM1 knockdown in NPCs increases neurogenesis. (A-,B) NPCs were electroporated with a plasmid expressing PCM1 shRNA or with a control vector and then immunostained with antibodies against MAP2. The arrowheads indicate MAP2+GFP+ cells. Scale bars, 50 µm. Quantification of the number of GFP-MAP2 double-positive cells relative to the number of GFP-positive cells (B). More than 1500 GFP-positive cells were counted for each condition. At least three sets of independent experiments were performed. The values represent the mean ± s.d. (n = 3). Student’s t-test, differences were considered significant at ***p<0.001. DOI: http://dx.doi.org/10.7554/eLife.11324.027
Figure 5—figure supplement 3. PCM1 knockdown in NPCs increases neurogenesis. (A-,B) NPCs were electroporated with a plasmid expressing PCM1 shRNA or with a control vector and then immunostained with antibodies against MAP2. The arrowheads indicate MAP2+GFP+ cells. Scale bars, 50 µm. Quantification of the number of GFP-MAP2 double-positive cells relative to the number of GFP-positive cells (B). More than 1500 GFP-positive cells were counted for each condition. At least three sets of independent experiments were performed. The values represent the mean ± s.d. (n = 3). Student’s t-test, differences were considered significant at ***p<0.001. DOI: http://dx.doi.org/10.7554/eLife.11324.027CC BY · PubMed Central
Figure 5—figure supplement 4. Overexpression of PCM1 increases NPC proliferation. (A,B) Overexpression of PCM1 increases NPC proliferation. NPCs were electroporated with a PCM1 overexpression construct or a control vector and pulse-labeled with BrdU for 6 hr. NPCs were immunostained with an antibody against BrdU. The arrowheads indicate BrdU and GFP double-positive cells. Scale bars, 10 µm. Quantification of the number of GFP-BrdU double-positive cells relative to the total number of GFP-positive cells (B). More than 1500 GFP-positive cells were counted for each condition. At least three sets of independent experiments were performed. The values represent the mean ± s.d. (n = 3). Student’s t-test, differences were considered significant at ***p<0.001. DOI: http://dx.doi.org/10.7554/eLife.11324.028
Figure 5—figure supplement 4. Overexpression of PCM1 increases NPC proliferation. (A,B) Overexpression of PCM1 increases NPC proliferation. NPCs were electroporated with a PCM1 overexpression construct or a control vector and pulse-labeled with BrdU for 6 hr. NPCs were immunostained with an antibody against BrdU. The arrowheads indicate BrdU and GFP double-positive cells. Scale bars, 10 µm. Quantification of the number of GFP-BrdU double-positive cells relative to the total number of GFP-positive cells (B). More than 1500 GFP-positive cells were counted for each condition. At least three sets of independent experiments were performed. The values represent the mean ± s.d. (n = 3). Student’s t-test, differences were considered significant at ***p<0.001. DOI: http://dx.doi.org/10.7554/eLife.11324.028CC BY · PubMed Central
Figure 5—figure supplement 5. Overexpression of PCM1 decreases NPC neuronal differentiation. (A,B) Ectopic expression of PCM1 decreases TUJ1 staining. NPCs were electroporated with a PCM1 overexpression construct or a control vector and immunostained with antibodies against TUJ1. The arrowheads indicate TUJ1+GFP+ cells. Scale bars, 50 µm. Quantification of the number of GFP-TUJ1 double-positive cells relative to the number of GFP-positive cells (B). (C,D) Ectopic expression of PCM1 decreases MAP2 staining. NPCs were electroporated with the indicated plasmids and immunostained with antibodies against MAP2. The arrowheads indicate MAP2+GFP+ cells. Scale bars, 50 µm. Quantification of the number of GFP-MAP2 double-positive cells relative to the number of GFP-positive cells (D). More than 1500 GFP-positive cells were counted for each condition. At least three sets of independent experiments were performed. The values represent the mean ± s.d. (n = 3). Student’s t-test, differences were considered significant at ***p<0.001. DOI: http://dx.doi.org/10.7554/eLife.11324.029
Figure 5—figure supplement 5. Overexpression of PCM1 decreases NPC neuronal differentiation. (A,B) Ectopic expression of PCM1 decreases TUJ1 staining. NPCs were electroporated with a PCM1 overexpression construct or a control vector and immunostained with antibodies against TUJ1. The arrowheads indicate TUJ1+GFP+ cells. Scale bars, 50 µm. Quantification of the number of GFP-TUJ1 double-positive cells relative to the number of GFP-positive cells (B). (C,D) Ectopic expression of PCM1 decreases MAP2 staining. NPCs were electroporated with the indicated plasmids and immunostained with antibodies against MAP2. The arrowheads indicate MAP2+GFP+ cells. Scale bars, 50 µm. Quantification of the number of GFP-MAP2 double-positive cells relative to the number of GFP-positive cells (D). More than 1500 GFP-positive cells were counted for each condition. At least three sets of independent experiments were performed. The values represent the mean ± s.d. (n = 3). Student’s t-test, differences were considered significant at ***p<0.001. DOI: http://dx.doi.org/10.7554/eLife.11324.029CC BY · PubMed Central
Figure 5—figure supplement 6. Overexpression of PCM1 in NPCs did not trigger apoptotic cell death. (A,B) Ectopic overexpression of PCM1 does not affect TUNEL staining. Quantification of the number of GFP-TUNEL double-positive cells relative to the total number of GFP-positive cells (B). (C,D) Ectopic overexpression of PCM1 does not affect cleaved caspase-3 (C-caspase 3) staining. Scale bars, 20 μm. Quantification of the number of GFP-C-caspase 3 double-positive cells relative to the total number of GFP-positive cells (D). More than 1500 GFP-positive cells were counted for each condition. At least three sets of independent experiments were performed. The values represent the mean ± s.d. (n = 3). Student’s t-test, differences were considered significant at *p<0.05. DOI: http://dx.doi.org/10.7554/eLife.11324.030
Figure 5—figure supplement 6. Overexpression of PCM1 in NPCs did not trigger apoptotic cell death. (A,B) Ectopic overexpression of PCM1 does not affect TUNEL staining. Quantification of the number of GFP-TUNEL double-positive cells relative to the total number of GFP-positive cells (B). (C,D) Ectopic overexpression of PCM1 does not affect cleaved caspase-3 (C-caspase 3) staining. Scale bars, 20 μm. Quantification of the number of GFP-C-caspase 3 double-positive cells relative to the total number of GFP-positive cells (D). More than 1500 GFP-positive cells were counted for each condition. At least three sets of independent experiments were performed. The values represent the mean ± s.d. (n = 3). Student’s t-test, differences were considered significant at *p<0.05. DOI: http://dx.doi.org/10.7554/eLife.11324.030CC BY · PubMed Central
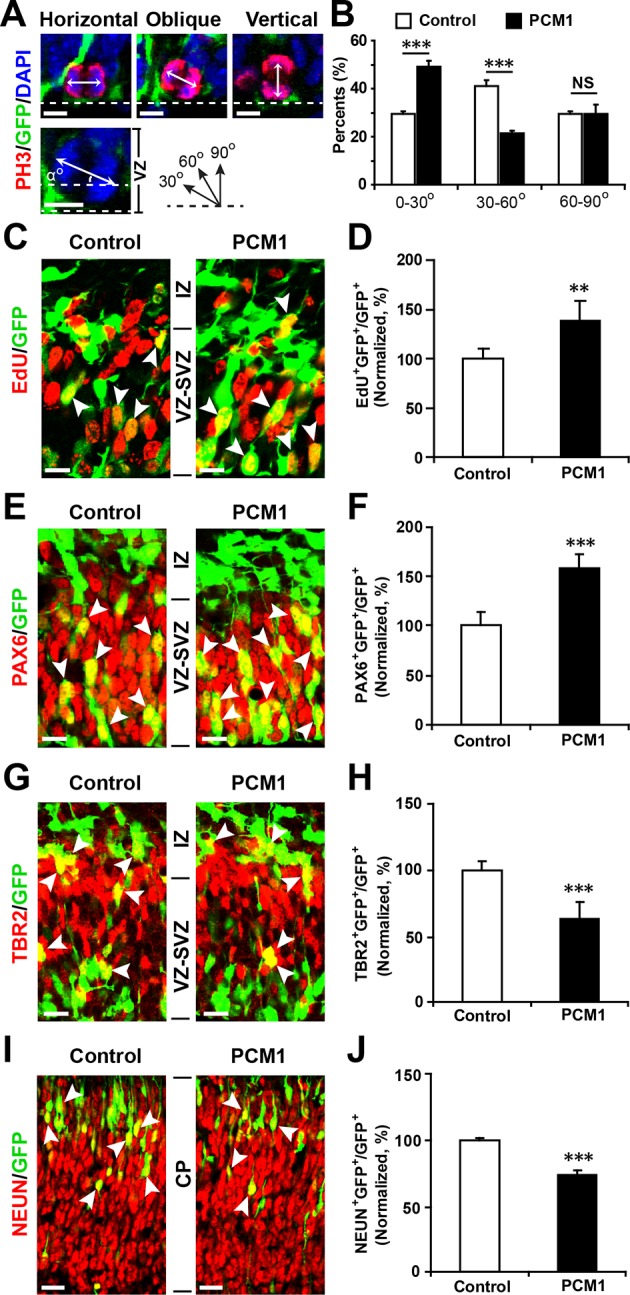
Figure 5—figure supplement 7. PCM1 regulates NPC proliferation and differentiation in vivo. (A,B) PCM1 regulates the symmetric division of apical progenitors in the VZ/SVZ. Mouse embryos were electroporated at E13.5 with the indicated plasmids and sacrificed at E14.5. The nuclei of mitotic cells were labeled using antibodies against PH3. The orientation of the mitotic spindle relative to the ventricular surface was determined and categorized into horizontal (0–30°), oblique (30–60°), or vertical (60–90°) as pictured. Scale bars, 5 µm (A). Percentage of GFP and PH3 double-positive cells with the indicated mitotic spindle orientation following PCM1 overexpression (B). (C,D) Overexpression of PCM1 increases NPC proliferation in vivo compared to vector-only control treatment. Mouse embryos were electroporated at E13.5 with the indicated constructs. Twenty-four hours post-electroporation, dividing cells were marked by EdU pulse-labeling for 2 hr and sacrificed. The arrowheads indicate EdU+GFP+ cells. Scale bars, 10 µm. Quantification of the number of GFP-EdU double-positive cells relative to the number of GFP-positive cells (D). (E,F) Overexpression of PCM1 increases apical progenitors compared to vector-only control treatment. Mouse embryos were electroporated at E13.5 with the indicated constructs and sacrificed at E14.5. Brain sections were immunostained with antibodies against PAX6. The arrowheads indicate PAX6+GFP+ cells. Scale bars, 10 µm. Quantification of the number of GFP-PAX6 double-positive cells relative to the number of GFP-positive cells (F). (G,H) Overexpression of PCM1 decreases the number of basal progenitors compared to vector-only control treatment. Mouse embryos were electroporated at E13.5 with the indicated constructs and sacrificed at E14.5. Brain sections were immunostained with antibodies against TBR2. The arrowheads indicate TBR2+GFP+ cells. Scale bars, 10 µm. Quantification of the number of GFP-TBR2 double-positive cells relative to the number of GFP-positive cells (H). (I,J) Overexpression of PCM1 decreases neurogenesis compared to vector-only control treatment. Mouse embryos were electroporated at E13.5 with the indicated constructs and sacrificed at E17.5. Brain slices were immunostained for NEUN. Arrowheads indicate NEUN+GFP+ cells. Scale bars, 10 µm. Quantification of the number of GFP-NEUN double-positive cells relative to the number of GFP-positive cells (J). More than 1500 GFP-positive cells were counted for each condition. At least three sets of independent experiments were performed. The values represent the mean ± s.d. (n = 3). Student’s t-test, differences were considered significant at ***p<0.001. DOI: http://dx.doi.org/10.7554/eLife.11324.031
Figure 5—figure supplement 7. PCM1 regulates NPC proliferation and differentiation in vivo. (A,B) PCM1 regulates the symmetric division of apical progenitors in the VZ/SVZ. Mouse embryos were electroporated at E13.5 with the indicated plasmids and sacrificed at E14.5. The nuclei of mitotic cells were labeled using antibodies against PH3. The orientation of the mitotic spindle relative to the ventricular surface was determined and categorized into horizontal (0–30°), oblique (30–60°), or vertical (60–90°) as pictured. Scale bars, 5 µm (A). Percentage of GFP and PH3 double-positive cells with the indicated mitotic spindle orientation following PCM1 overexpression (B). (C,D) Overexpression of PCM1 increases NPC proliferation in vivo compared to vector-only control treatment. Mouse embryos were electroporated at E13.5 with the indicated constructs. Twenty-four hours post-electroporation, dividing cells were marked by EdU pulse-labeling for 2 hr and sacrificed. The arrowheads indicate EdU+GFP+ cells. Scale bars, 10 µm. Quantification of the number of GFP-EdU double-positive cells relative to the number of GFP-positive cells (D). (E,F) Overexpression of PCM1 increases apical progenitors compared to vector-only control treatment. Mouse embryos were electroporated at E13.5 with the indicated constructs and sacrificed at E14.5. Brain sections were immunostained with antibodies against PAX6. The arrowheads indicate PAX6+GFP+ cells. Scale bars, 10 µm. Quantification of the number of GFP-PAX6 double-positive cells relative to the number of GFP-positive cells (F). (G,H) Overexpression of PCM1 decreases the number of basal progenitors compared to vector-only control treatment. Mouse embryos were electroporated at E13.5 with the indicated constructs and sacrificed at E14.5. Brain sections were immunostained with antibodies against TBR2. The arrowheads indicate TBR2+GFP+ cells. Scale bars, 10 µm. Quantification of the number of GFP-TBR2 double-positive cells relative to the number of GFP-positive cells (H). (I,J) Overexpression of PCM1 decreases neurogenesis compared to vector-only control treatment. Mouse embryos were electroporated at E13.5 with the indicated constructs and sacrificed at E17.5. Brain slices were immunostained for NEUN. Arrowheads indicate NEUN+GFP+ cells. Scale bars, 10 µm. Quantification of the number of GFP-NEUN double-positive cells relative to the number of GFP-positive cells (J). More than 1500 GFP-positive cells were counted for each condition. At least three sets of independent experiments were performed. The values represent the mean ± s.d. (n = 3). Student’s t-test, differences were considered significant at ***p<0.001. DOI: http://dx.doi.org/10.7554/eLife.11324.031CC BY · PubMed Central
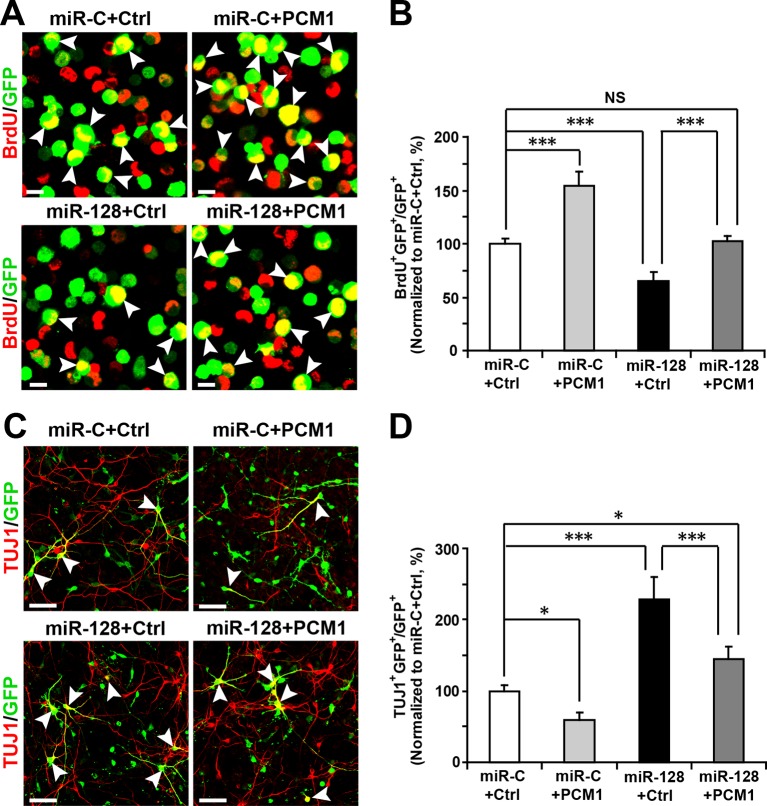
Figure 6. PCM1 is a functional target of miR-128 in vitro. (A,B) PCM1 antagonizes the effects of miR-128 on NPC proliferation in vitro. NPCs were electroporated with a miRNA control vector or with miR-128. Either a PCM1 expression construct or vector only control was co-electroporated in miR-128-expressing NPCs to examine the rescue effect of PCM1 in these cells. The cells were pulse-labeled with BrdU for 6 hr, and a proliferation assay was performed by immunostaining for BrdU (A). Scale bars, 10 µm. (B) Quantification of BrdU and GFP double-positive cells, demonstrating that PCM1 overexpression in the miR-128 cells rescued the reduced proliferation in the miR-128-expressing cells. (C,D) miR-128 antagonizes the function of PCM1 in neurogenesis in vitro. A neuronal differentiation assay was performed by immunostaining for TUJ1. The arrowheads indicate cells that are double-positive for TUJ1 and GFP (C). Scale bars, 50 µm. (D) Quantification of TUJ1 and GFP double-positive cells, demonstrating that PCM1 overexpression in the miR-128-expressing cells reverses the increased neurogenesis phenotype of the miR-128-expressing cells. More than 2000 GFP-positive cells were counted for each condition. At least three sets of independent experiments were performed. The values represent the mean ± s.d. (n = 3). ANOVA, differences were considered significant at ***p<0.001, **p<0.01 and *p<0.05. DOI: http://dx.doi.org/10.7554/eLife.11324.032
Figure 6. PCM1 is a functional target of miR-128 in vitro. (A,B) PCM1 antagonizes the effects of miR-128 on NPC proliferation in vitro. NPCs were electroporated with a miRNA control vector or with miR-128. Either a PCM1 expression construct or vector only control was co-electroporated in miR-128-expressing NPCs to examine the rescue effect of PCM1 in these cells. The cells were pulse-labeled with BrdU for 6 hr, and a proliferation assay was performed by immunostaining for BrdU (A). Scale bars, 10 µm. (B) Quantification of BrdU and GFP double-positive cells, demonstrating that PCM1 overexpression in the miR-128 cells rescued the reduced proliferation in the miR-128-expressing cells. (C,D) miR-128 antagonizes the function of PCM1 in neurogenesis in vitro. A neuronal differentiation assay was performed by immunostaining for TUJ1. The arrowheads indicate cells that are double-positive for TUJ1 and GFP (C). Scale bars, 50 µm. (D) Quantification of TUJ1 and GFP double-positive cells, demonstrating that PCM1 overexpression in the miR-128-expressing cells reverses the increased neurogenesis phenotype of the miR-128-expressing cells. More than 2000 GFP-positive cells were counted for each condition. At least three sets of independent experiments were performed. The values represent the mean ± s.d. (n = 3). ANOVA, differences were considered significant at ***p<0.001, **p<0.01 and *p<0.05. DOI: http://dx.doi.org/10.7554/eLife.11324.032CC BY · PubMed Central
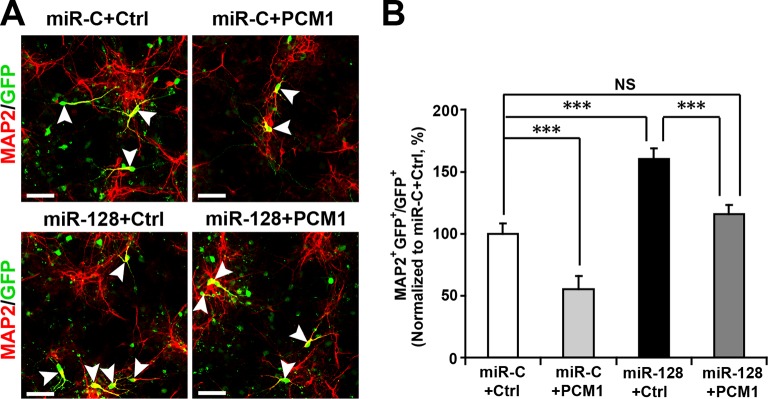
Figure 6—figure supplement 1. PCM1 is a functional target of miR-128 in vitro. NPCs were electroporated with a miRNA control vector or with miR-128. Either a PCM1 expression construct or vector only control was co-electroporated in miR-128-expressing NPCs to examine the rescue effect of PCM1 in these cells. A neuronal differentiation assay was performed by immunostaining for MAP2. The arrowheads indicate cells that are double-positive for MAP2 and GFP (A). Scale bars, 50 µm. (B) Quantification of MAP2 and GFP double-positive cells, demonstrating that PCM1 overexpression in the miR-128-expressing cells rescues the enhanced neurogenesis phenotype of the miR-128-expressing cells. More than 2000 GFP-positive cells were counted for each condition. At least three sets of independent experiments were performed. The values represent the mean ± s.d. (n = 3). ANOVA, differences were considered significant at ***p<0.001 and **p<0.01. DOI: http://dx.doi.org/10.7554/eLife.11324.033
Figure 6—figure supplement 1. PCM1 is a functional target of miR-128 in vitro. NPCs were electroporated with a miRNA control vector or with miR-128. Either a PCM1 expression construct or vector only control was co-electroporated in miR-128-expressing NPCs to examine the rescue effect of PCM1 in these cells. A neuronal differentiation assay was performed by immunostaining for MAP2. The arrowheads indicate cells that are double-positive for MAP2 and GFP (A). Scale bars, 50 µm. (B) Quantification of MAP2 and GFP double-positive cells, demonstrating that PCM1 overexpression in the miR-128-expressing cells rescues the enhanced neurogenesis phenotype of the miR-128-expressing cells. More than 2000 GFP-positive cells were counted for each condition. At least three sets of independent experiments were performed. The values represent the mean ± s.d. (n = 3). ANOVA, differences were considered significant at ***p<0.001 and **p<0.01. DOI: http://dx.doi.org/10.7554/eLife.11324.033CC BY · PubMed Central
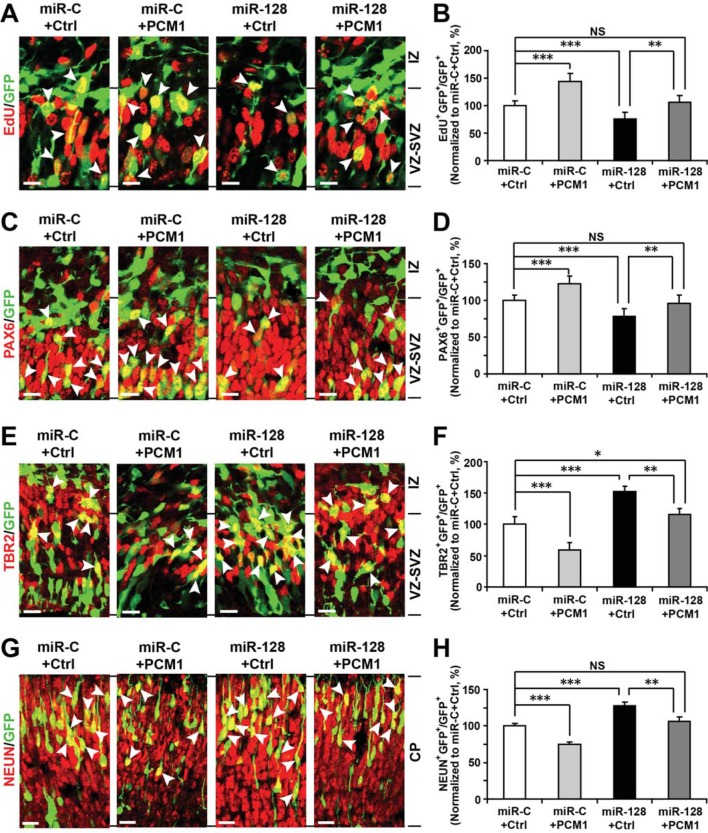
Figure 7. PCM1 is a downstream target of miR-128 during NPC proliferation and differentiation in vivo. (A,B) PCM1 antagonizes the effects of miR-128 on NPC proliferation in vivo. Mouse embryos were electroporated at E13.5 with a miRNA control vector or with miR-128. Either a PCM1 expression construct or vector only control was co-electroporated in miR-128-expressing NPCs to examine the rescue effect of PCM1 in these cells. Twenty-four hours post-electroporation, dividing cells were marked by EdU pulse-labeling for 2 hr and sacrificed. The arrowheads indicate EdU+GFP+ cells. Scale bars, 10 µm. Quantification of the number of GFP-EdU double-positive cells relative to the number of GFP-positive cells (B). (C,D) PCM1 overexpression rescues the miR-128-mediated decrease in the number of apical progenitors. Mouse embryos were electroporated at E13.5 with the indicated constructs and sacrificed at E14.5. Brain sections were immunostained with antibodies against PAX6. The arrowheads indicate PAX6+GFP+ cells. Scale bars, 10 µm. Quantification of the number of GFP-PAX6 double-positive cells relative to the number of GFP-positive cells (D). (E,F) PCM1 overexpression rescues the miR-128-mediated increase in the number of basal progenitors. Mouse embryos were electroporated at E13.5 with the indicated constructs and sacrificed at E14.5. Brain sections were immunostained with antibodies against TBR2. The arrowheads indicate TBR2+GFP+ cells. Scale bars, 10 µm. Quantification of the number of GFP-TBR2 double-positive cells relative to the number of GFP-positive cells (F). (G,H) PCM1 overexpression rescues the miR-128-mediated increase in neurogenesis. Mouse embryos were electroporated at E13.5 with the indicated constructs and sacrificed at E17.5. Brain slices were immunostained for NEUN. Arrowheads indicate NEUN+GFP+ cells. Scale bars, 10 µm. Quantification of the number of GFP-NEUN double-positive cells relative to the number of GFP-positive cells (H). More than 1500 GFP-positive cells were counted for each condition. At least three sets of independent experiments were performed. The values represent the mean ± s.d. (n = 3). ANOVA, differences were considered significant at ***p<0.001 and **p<0.01. DOI: http://dx.doi.org/10.7554/eLife.11324.034
Figure 7. PCM1 is a downstream target of miR-128 during NPC proliferation and differentiation in vivo. (A,B) PCM1 antagonizes the effects of miR-128 on NPC proliferation in vivo. Mouse embryos were electroporated at E13.5 with a miRNA control vector or with miR-128. Either a PCM1 expression construct or vector only control was co-electroporated in miR-128-expressing NPCs to examine the rescue effect of PCM1 in these cells. Twenty-four hours post-electroporation, dividing cells were marked by EdU pulse-labeling for 2 hr and sacrificed. The arrowheads indicate EdU+GFP+ cells. Scale bars, 10 µm. Quantification of the number of GFP-EdU double-positive cells relative to the number of GFP-positive cells (B). (C,D) PCM1 overexpression rescues the miR-128-mediated decrease in the number of apical progenitors. Mouse embryos were electroporated at E13.5 with the indicated constructs and sacrificed at E14.5. Brain sections were immunostained with antibodies against PAX6. The arrowheads indicate PAX6+GFP+ cells. Scale bars, 10 µm. Quantification of the number of GFP-PAX6 double-positive cells relative to the number of GFP-positive cells (D). (E,F) PCM1 overexpression rescues the miR-128-mediated increase in the number of basal progenitors. Mouse embryos were electroporated at E13.5 with the indicated constructs and sacrificed at E14.5. Brain sections were immunostained with antibodies against TBR2. The arrowheads indicate TBR2+GFP+ cells. Scale bars, 10 µm. Quantification of the number of GFP-TBR2 double-positive cells relative to the number of GFP-positive cells (F). (G,H) PCM1 overexpression rescues the miR-128-mediated increase in neurogenesis. Mouse embryos were electroporated at E13.5 with the indicated constructs and sacrificed at E17.5. Brain slices were immunostained for NEUN. Arrowheads indicate NEUN+GFP+ cells. Scale bars, 10 µm. Quantification of the number of GFP-NEUN double-positive cells relative to the number of GFP-positive cells (H). More than 1500 GFP-positive cells were counted for each condition. At least three sets of independent experiments were performed. The values represent the mean ± s.d. (n = 3). ANOVA, differences were considered significant at ***p<0.001 and **p<0.01. DOI: http://dx.doi.org/10.7554/eLife.11324.034CC BY · PubMed Central
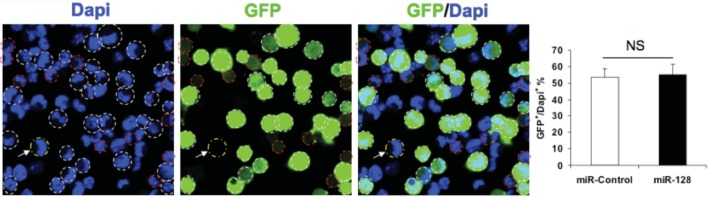
Author response image 1. Transfection efficiency of expression constucts. NPCs were electroporated with the indicated plasmids and the nuclei were counterstained with DAPI. White outlines indicate GFP+ cells and red outlines indicate cells have that borderline expression of GFP and considered GFP-negative. White arrow indicates a GFP-negative cell. Quantification of the ratio of GFP-positive cells over total DAPI counterstained cells show the transfection efficiency to be consistent between the miR-128 overexpression construct and its corresponding control. More than 1500 GFP-positive cells were counted for each condition. At least three sets of independent experiments were performed. The values represent the means ± s.d. (n=3). Student’s t-test, differences were considered significant at ***P<0.001. DOI: http://dx.doi.org/10.7554/eLife.11324.035
Author response image 1. Transfection efficiency of expression constucts. NPCs were electroporated with the indicated plasmids and the nuclei were counterstained with DAPI. White outlines indicate GFP+ cells and red outlines indicate cells have that borderline expression of GFP and considered GFP-negative. White arrow indicates a GFP-negative cell. Quantification of the ratio of GFP-positive cells over total DAPI counterstained cells show the transfection efficiency to be consistent between the miR-128 overexpression construct and its corresponding control. More than 1500 GFP-positive cells were counted for each condition. At least three sets of independent experiments were performed. The values represent the means ± s.d. (n=3). Student’s t-test, differences were considered significant at ***P<0.001. DOI: http://dx.doi.org/10.7554/eLife.11324.035CC BY · PubMed Central
Author response image 2. Schematic diagram outlines rationale of gene selection process. Two widely used in silico microRNA target prediction databases (TargetScan and miRanda)(Mi et al., 2013; Witkos et al., 2011) predicted 800 and 940 potential targets of miR-128, respectively. Among the 77 overlapping targets only 53 were annotated to have known biological function and only 11 out of the 53 genes exhibited consistent reduction in mRNA levels upon miR-128 overexpressionin cultured mouse NPCs and were further tested for reciprocal upregulation when miR-128 was inhibited. Lastly, upon miR-128 inhibition in NPCs, only Pcm1, Nfia, Foxo4, and Fbxl20 were consistently upregulated. DOI: http://dx.doi.org/10.7554/eLife.11324.036
Author response image 2. Schematic diagram outlines rationale of gene selection process. Two widely used in silico microRNA target prediction databases (TargetScan and miRanda)(Mi et al., 2013; Witkos et al., 2011) predicted 800 and 940 potential targets of miR-128, respectively. Among the 77 overlapping targets only 53 were annotated to have known biological function and only 11 out of the 53 genes exhibited consistent reduction in mRNA levels upon miR-128 overexpressionin cultured mouse NPCs and were further tested for reciprocal upregulation when miR-128 was inhibited. Lastly, upon miR-128 inhibition in NPCs, only Pcm1, Nfia, Foxo4, and Fbxl20 were consistently upregulated. DOI: http://dx.doi.org/10.7554/eLife.11324.036CC BY · PubMed Central
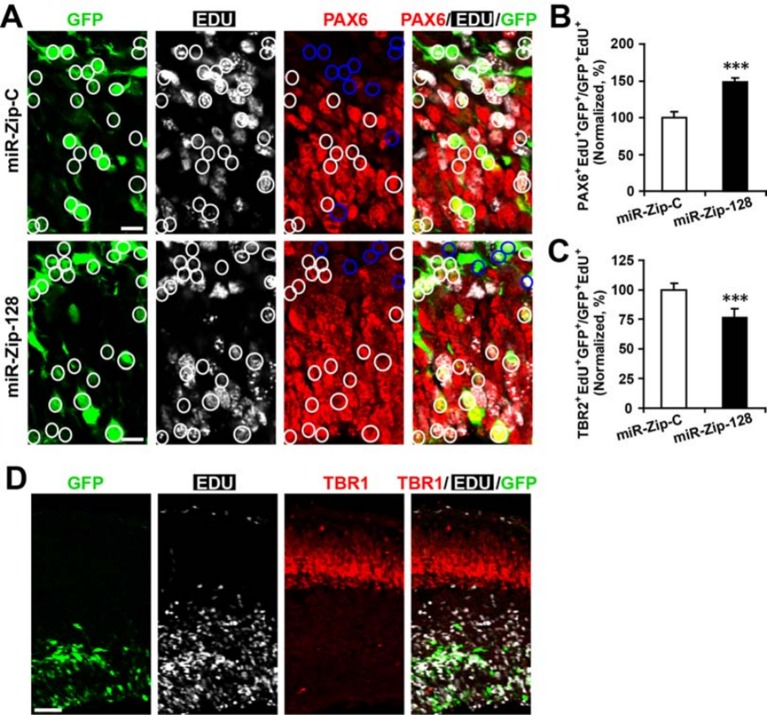
Author response image 3. Clonal analysis reveals the fate of progeny derived from electroporated progenitor cells. In utero electroporation was performed on E13.5 embryos to introduce either miR-128-ZIP or a control construct into NPCs lining the ependymal layer. Ependymal NPCs were further labeled with EdU immediately following electroporation. (A-C) At E14.5, tissue sections were acquired for EdU detection and immunostained with antibodies against PAX6 (A) and TBR2 (not shown). (B) Quantification of PAX6- EdU- GFP-triple-positive cells over EdU- GFP-double-positive cells shows significant increase of Pax6 positive cells in progeny from miR-128-ZIP electroporated NPCs compared to control. (C) Quantification of TBR2- EdU- GFP-triple-positive cells over EdU- GFP-double-positive cells shows significant decrease of TBR2-positive cells in progeny from miR-128-ZIP electroporated NPCs compared to control. (D) Tissue sections acquired at E14.5, and processed for EdU detection and immunostained with antibodies against TBR1revealed minimal overlap between EdU-positive cells and TBR1-positive cells. In (A), circles show GFP- EdU-double-positive cells, blue circles show PAX6-negative cells among GFP-EdU- double-positive cells. Scale bar, 10 um. (D) Scale bar, 100 um. More than 500 GFP-positive cells were counted for each condition. At least three sets of independent experiments were performed. The values represent the means ± s.d. (n=3). Student’s t-test, differences were considered significant at ***P<0.001. DOI: http://dx.doi.org/10.7554/eLife.11324.037
Author response image 3. Clonal analysis reveals the fate of progeny derived from electroporated progenitor cells. In utero electroporation was performed on E13.5 embryos to introduce either miR-128-ZIP or a control construct into NPCs lining the ependymal layer. Ependymal NPCs were further labeled with EdU immediately following electroporation. (A-C) At E14.5, tissue sections were acquired for EdU detection and immunostained with antibodies against PAX6 (A) and TBR2 (not shown). (B) Quantification of PAX6- EdU- GFP-triple-positive cells over EdU- GFP-double-positive cells shows significant increase of Pax6 positive cells in progeny from miR-128-ZIP electroporated NPCs compared to control. (C) Quantification of TBR2- EdU- GFP-triple-positive cells over EdU- GFP-double-positive cells shows significant decrease of TBR2-positive cells in progeny from miR-128-ZIP electroporated NPCs compared to control. (D) Tissue sections acquired at E14.5, and processed for EdU detection and immunostained with antibodies against TBR1revealed minimal overlap between EdU-positive cells and TBR1-positive cells. In (A), circles show GFP- EdU-double-positive cells, blue circles show PAX6-negative cells among GFP-EdU- double-positive cells. Scale bar, 10 um. (D) Scale bar, 100 um. More than 500 GFP-positive cells were counted for each condition. At least three sets of independent experiments were performed. The values represent the means ± s.d. (n=3). Student’s t-test, differences were considered significant at ***P<0.001. DOI: http://dx.doi.org/10.7554/eLife.11324.037CC BY · PubMed Central

Verification

Claims the paper makes

The claims and statistics of this paper haven’t been checked yet.

Run the check — free, no account needed. It reads the open-access text and checks the sources it cites.

A few free checks a day · papers already verified open instantly · results are public

Claims other papers make about this one

Each is checked against this paper’s own text: does it say what the citing paper says it does?

Self-check

Percentages, sums and reported differences re-computed from the paper’s own numbers.

The self-check needs the paper’s full text.

Citations

Cites

Show all 2 references

Research works printed but not linked: 42

  1. Abu-Elneel, 2008, Heterogeneous dysregulation of microRNAs across the autism spectrum, Neurogenetics, 9, 153, 10.1007/s10048-008-0133-5 · DOI · Paper page
  2. Adlakha, 2013, MiR-128 exerts pro-apoptotic effect in a p53 transcription-dependent and -independent manner via PUMA-bak axis, Cell Death and Disease, 4, e542, 10.1038/cddis.2013.46 · DOI
  3. Bartel, 2009, MicroRNAs: target recognition and regulatory functions, Cell, 136, 215, 10.1016/j.cell.2009.01.002 · DOI · Paper page
  4. Bez, 2003, Neurosphere and neurosphere-forming cells: morphological and ultrastructural characterization, Brain Research, 993, 18, 10.1016/j.brainres.2003.08.061 · DOI
  5. Cai, 2000, Misexpression of basic helix-loop-helix genes in the murine cerebral cortex affects cell fate choices and neuronal survival, Development, 127, 3021, 10.1242/dev.127.14.3021 · DOI
  6. Chen, 2009, Abeta40 promotes neuronal cell fate in neural progenitor cells, Cell Death and Differentiation, 16, 386, 10.1038/cdd.2008.94 · DOI · Paper page
  7. Ferreira, 1992, Expression of the class III beta-tubulin isotype in developing neurons in culture, Journal of Neuroscience Research, 32, 516, 10.1002/jnr.490320407 · DOI
  8. Franzoni, 2015, MiR-128 regulates neuronal migration, outgrowth and intrinsic excitability via the intellectual disability gene Phf6, eLife, 4, 10.7554/eLife.04263 · DOI · Paper page
  9. Furukawa-Hibi, 2005, FOXO transcription factors in cell-cycle regulation and the response to oxidative stress, Antioxidants & Redox Signaling, 7, 752, 10.1089/ars.2005.7.752 · DOI
  10. Ge, 2010, Hook3 interacts with PCM1 to regulate pericentriolar material assembly and the timing of neurogenesis, Neuron, 65, 191, 10.1016/j.neuron.2010.01.011 · DOI
  11. Guibinga, 2012, MicroRNA-mediated dysregulation of neural developmental genes in HPRT deficiency: clues for lesch-nyhan disease?, Human Molecular Genetics, 21, 609, 10.1093/hmg/ddr495 · DOI
  12. Gupta, 2002, Life is a journey: a genetic look at neocortical development, Nature Reviews Genetics, 3, 342, 10.1038/nrg799 · DOI
  13. Heng, 2010, Molecular layers underlying cytoskeletal remodelling during cortical development, Trends in Neurosciences, 33, 38, 10.1016/j.tins.2009.09.003 · DOI
  14. Hollis, 2009, Induction of corticospinal regeneration by lentiviral trkB-induced erk activation, Proceedings of the National Academy of Sciences of the United States of America, 106, 7215, 10.1073/pnas.0810624106 · DOI
  15. Huttner, 2005, Symmetric versus asymmetric cell division during neurogenesis in the developing vertebrate central nervous system, Current Opinion in Cell Biology, 17, 648, 10.1016/j.ceb.2005.10.005 · DOI
  16. Ishino, 2014, Bre1a, a histone H2B ubiquitin ligase, regulates the cell cycle and differentiation of neural precursor cells, Journal of Neuroscience, 34, 3067, 10.1523/JNEUROSCI.3832-13.2014 · DOI
  17. Kamiya, 2008, Recruitment of PCM1 to the centrosome by the cooperative action of DISC1 and BBS4, Archives of General Psychiatry, 65, 996, 10.1001/archpsyc.65.9.996 · DOI
  18. Kawahara, 2012, MicroRNAs in neural stem cells and neurogenesis, Frontiers in Neuroscience, 6, 10.3389/fnins.2012.00030 · DOI
  19. Krishnan, 2013, MicroRNA-182-5p targets a network of genes involved in DNA repair, RNA, 19, 230, 10.1261/rna.034926.112 · DOI
  20. Li, 2008, Characterization of excitability and voltage-gated ion channels of neural progenitor cells in rat hippocampus, Journal of Molecular Neuroscience, 35, 289, 10.1007/s12031-008-9065-7 · DOI
  21. Li, 2010, Roles of small regulatory RNAs in determining neuronal identity, Nature Reviews Neuroscience, 11, 329, 10.1038/nrn2739 · DOI · Paper page
  22. Ma, 2008, A TAG1-APP signalling pathway through Fe65 negatively modulates neurogenesis, Nature Cell Biology, 10, 283, 10.1038/ncb1690 · DOI
  23. Martínez-Cerdeño, 2006, The role of intermediate progenitor cells in the evolutionary expansion of the cerebral cortex, Cerebral Cortex, 16, i152, 10.1093/cercor/bhk017 · DOI
  24. Mi, 2013, Large-scale gene function analysis with the PANTHER classification system, Nature Protocols, 8, 1551, 10.1038/nprot.2013.092 · DOI
  25. Peruzzi, 2013, MicroRNA-128 coordinately targets polycomb repressor complexes in glioma stem cells, Neuro-Oncology, 15, 1212, 10.1093/neuonc/not055 · DOI · Paper page
  26. Postiglione, 2011, Mouse inscuteable induces apical-basal spindle orientation to facilitate intermediate progenitor generation in the developing neocortex, Neuron, 72, 269, 10.1016/j.neuron.2011.09.022 · DOI
  27. Qian, 1995, Chromosomal localization of the four genes (nFIA, b, c, and X) for the human transcription factor nuclear factor i by FISH, Genomics, 28, 66, 10.1006/geno.1995.1107 · DOI
  28. Schmidt, 2002, Cell cycle inhibition by FoxO forkhead transcription factors involves downregulation of cyclin D, Molecular and Cellular Biology, 22, 7842, 10.1128/MCB.22.22.7842-7852.2002 · DOI
  29. Scholzen, 2000, The ki-67 protein: from the known and the unknown, Journal of Cellular Physiology, 182, 311, 10.1002/(SICI)1097-4652(200003)182:3<311::AID-JCP1>3.0.CO;2-9 · DOI
  30. Shi, 2010, MicroRNA regulation of neural stem cells and neurogenesis, Journal of Neuroscience, 30, 14931, 10.1523/JNEUROSCI.4280-10.2010 · DOI
  31. Smrt, 2010, MicroRNA miR-137 regulates neuronal maturation by targeting ubiquitin ligase mind bomb-1, Stem Cells, 28, 1060, 10.1002/stem.431 · DOI · Paper page
  32. Sun, 2014, Growth and folding of the mammalian cerebral cortex: from molecules to malformations, Nature Reviews Neuroscience, 15, 217, 10.1038/nrn3707 · DOI
  33. Takagi, 2012, SCRAPPER regulates the thresholds of long-term Potentiation/Depression, the bidirectional synaptic plasticity in hippocampal CA3-CA1 synapses, Neural Plasticity, 2012, 1, 10.1155/2012/352829 · DOI
  34. Tan, 2013, MicroRNA-128 governs neuronal excitability and motor behavior in mice, Science, 342, 1254, 10.1126/science.1244193 · DOI · Paper page
  35. Tan, 2013, Neocortical neurogenesis and neuronal migration, Wiley Interdisciplinary Reviews: Developmental Biology, 2, 443, 10.1002/wdev.88 · DOI
  36. Vilchez, 2013, FOXO4 is necessary for neural differentiation of human embryonic stem cells, Aging Cell, 12, 518, 10.1111/acel.12067 · DOI
  37. Volvert, 2012, MicroRNAs tune cerebral cortical neurogenesis, Cell Death and Differentiation, 19, 1573, 10.1038/cdd.2012.96 · DOI
  38. Wang, 2009, High quality RNA from multiple brain regions simultaneously acquired by laser capture microdissection, BMC Molecular Biology, 10, 69, 10.1186/1471-2199-10-69 · DOI
  39. Wang, 2011, Orienting fate: spatial regulation of neurogenic divisions, Neuron, 72, 191, 10.1016/j.neuron.2011.10.003 · DOI
  40. M. Witkos, 2011, Practical aspects of microRNA target prediction, Current Molecular Medicine, 11, 93, 10.2174/156652411794859250 · DOI
  41. Yang, 2012, DOCK7 interacts with TACC3 to regulate interkinetic nuclear migration and cortical neurogenesis, Nature Neuroscience, 15, 1201, 10.1038/nn.3171 · DOI · Paper page
  42. Zhang, 2014, Amyloid precursor protein regulates neurogenesis by antagonizing miR-574-5p in the developing cerebral cortex, Nature Communications, 5, 10.1038/ncomms4330 · DOI

Cited by

Sorted by citations

Metadata

Authors
Zhang, W., Kim, P. J., Chen, Z., Lokman, H., Qiu, L., Zhang, K., Rozen, S. G., Tan, E. K., Je, H. S., & Zeng, L.
Affiliations
  • Neural Stem Cell Research Lab, Research Department, National Neuroscience Institute, Singapore, Singapore
  • Molecular Neurophysiology Laboratory, Signature Program in Neuroscience and Behavioral Disorders, Duke-NUS Graduate Medical School, Singapore, Singapore
  • Center for Computational Biology, Duke-NUS Graduate Medical School, Singapore, Singapore
  • Department of Neurology, National Neuroscience Institute, Singapore, Singapore
Venue
eLife
Published
2016-02-17
Volume
5
ISSN
2050-084X
Cited by
71
References
2
Language
en
Funders
  • Singapore A*Star (13/1/96/19/688)
  • Duke-NUS GMS Signature Research Program Grant
  • NNI Research Grant
  • Singapore Translational Research Investigator Award

About these checks

Registry, retraction, Cites and statistics results are computed, not judged, with one exception: a printed reference that no index lists is read once by a model before it counts as a citation error. Claims are extracted by a model and kept only when their quote appears verbatim in the text; each cited source is then checked, with a model’s help, for whether it says what the claim relies on. Those verdicts can be wrong — read the claim’s quote and the cited source before relying on one.

Statistics and arithmetic are recomputed, not judged.

Confidence bands are shown only for fields calibrated on our annotated test set. None is calibrated yet, so no band is shown.

What counts as a claim ›How we measure confidence ›How we check this ›

Are you an author, or do you see a problem with this page? Request a review