

The DOI matches its Crossref record; 91 of the 91 references it cites were found in a registry or an index.
NPTX2 and cognitive dysfunction in Alzheimer’s Disease
Open accessAbstract
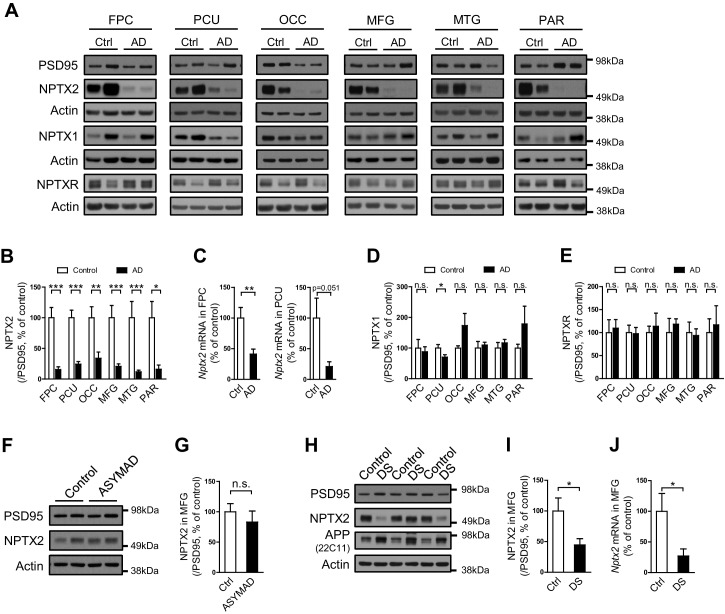
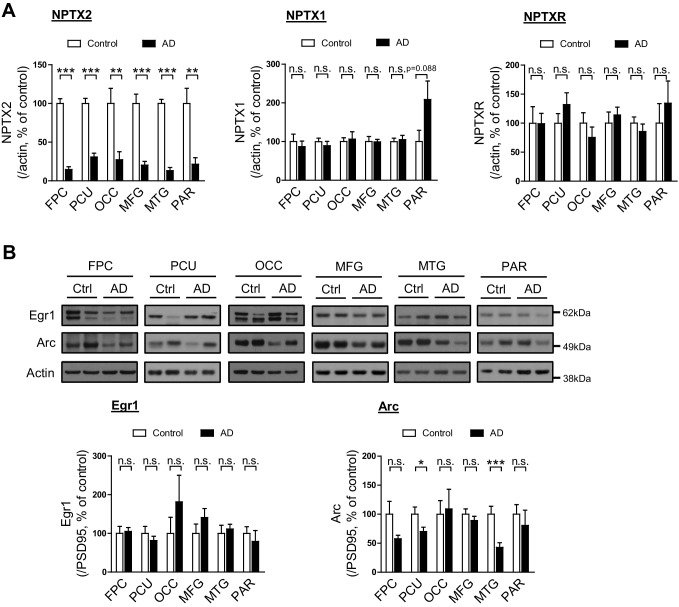
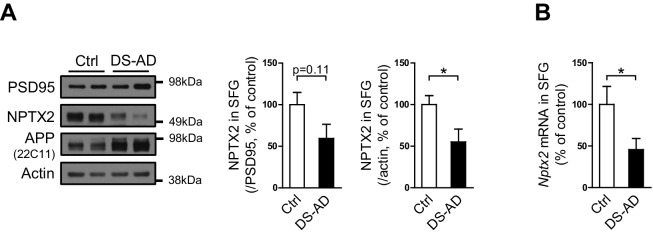
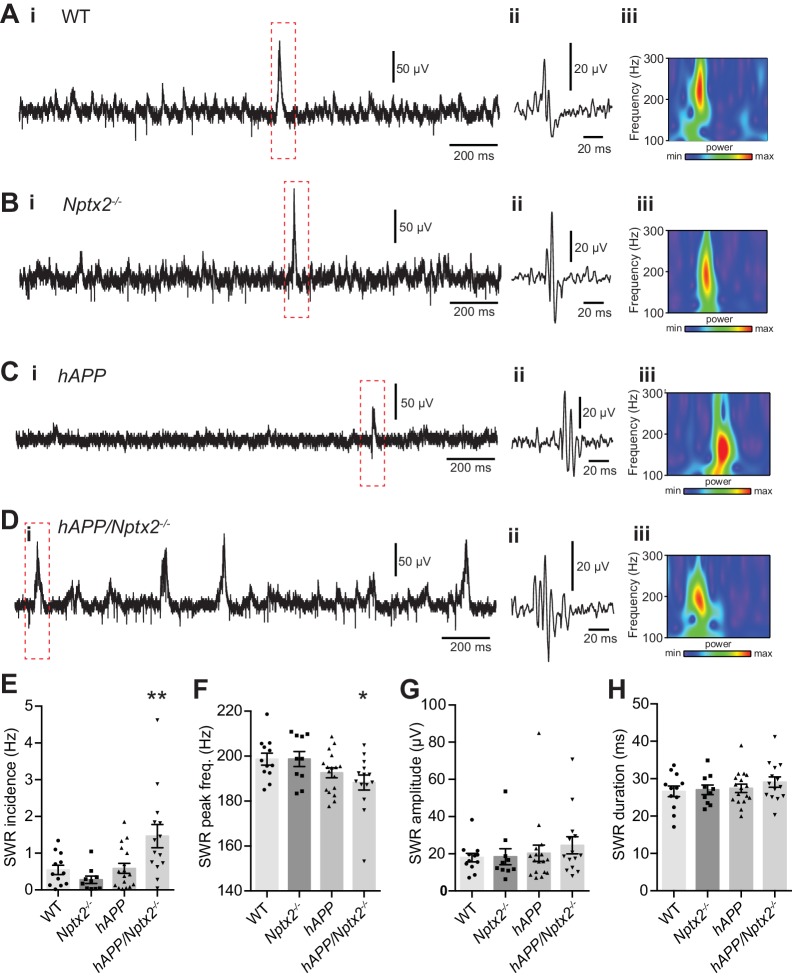
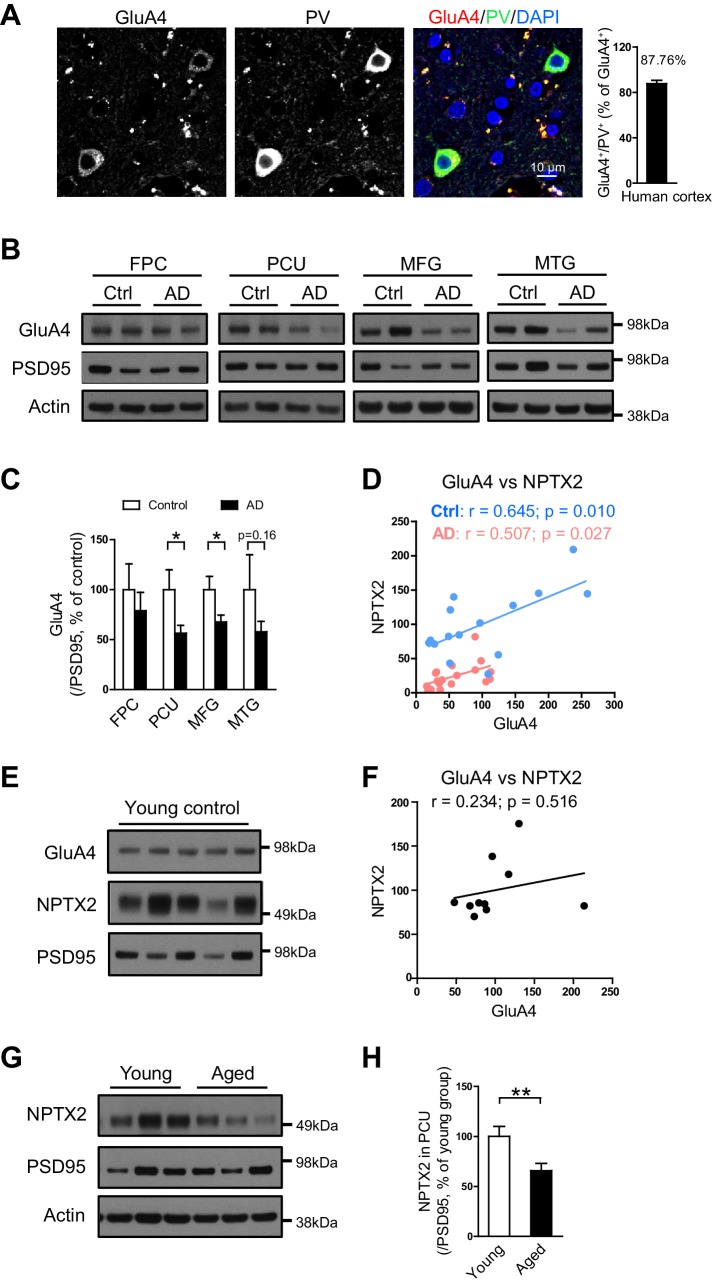
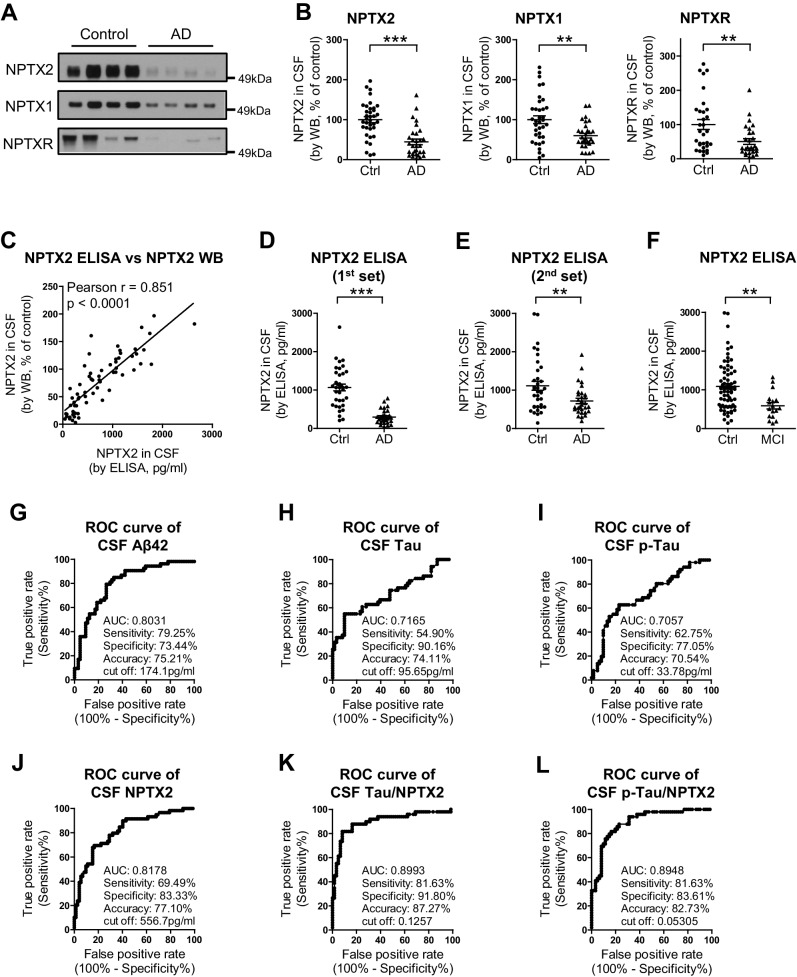
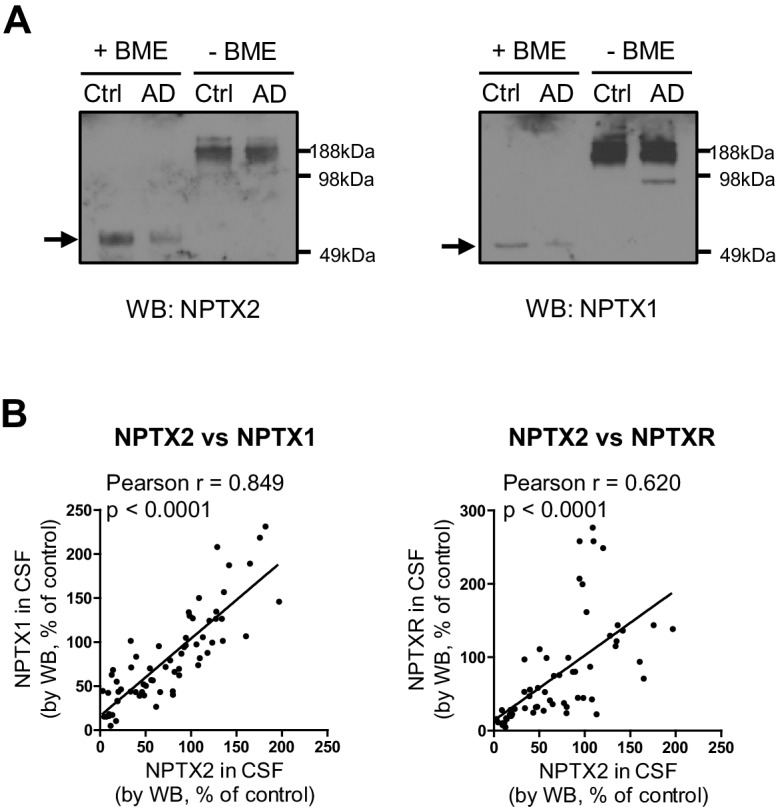
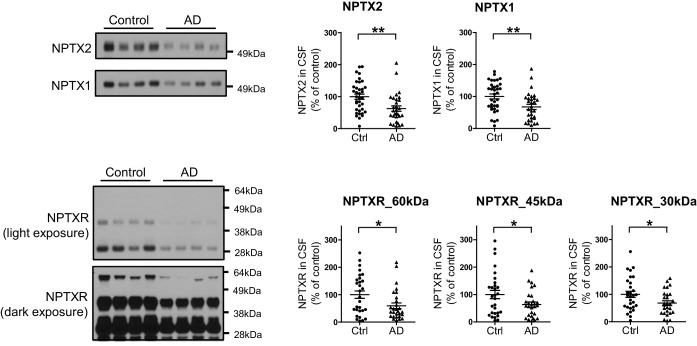
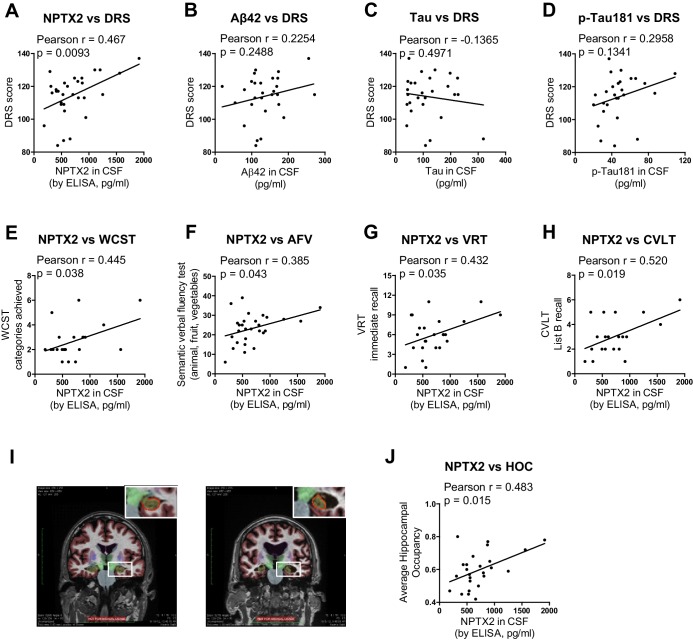
Memory loss in Alzheimer’s disease (AD) is attributed to pervasive weakening and loss of synapses. Here, we present findings supporting a special role for excitatory synapses connecting pyramidal neurons of the hippocampus and cortex with fast-spiking parvalbumin (PV) interneurons that control network excitability and rhythmicity. Excitatory synapses on PV interneurons are dependent on the AMPA receptor subunit GluA4, which is regulated by presynaptic expression of the synaptogenic immediate early gene NPTX2 by pyramidal neurons. In a mouse model of AD amyloidosis, Nptx2-/- results in reduced GluA4 expression, disrupted rhythmicity, and increased pyramidal neuron excitability. Postmortem human AD cortex shows profound reductions of NPTX2 and coordinate reductions of GluA4. NPTX2 in human CSF is reduced in subjects with AD and shows robust correlations with cognitive performance and hippocampal volume. These findings implicate failure of adaptive control of pyramidal neuron-PV circuits as a pathophysiological mechanism contributing to cognitive failure in AD.
Overview
The claims and statistics of this paper haven’t been checked yet.
Run the check — free, no account needed. It reads the open-access text and checks the sources it cites.
Integrity signals
Registry
Cites
Statistics
Figures
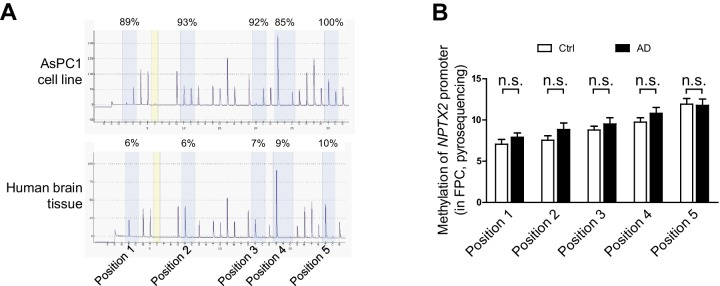
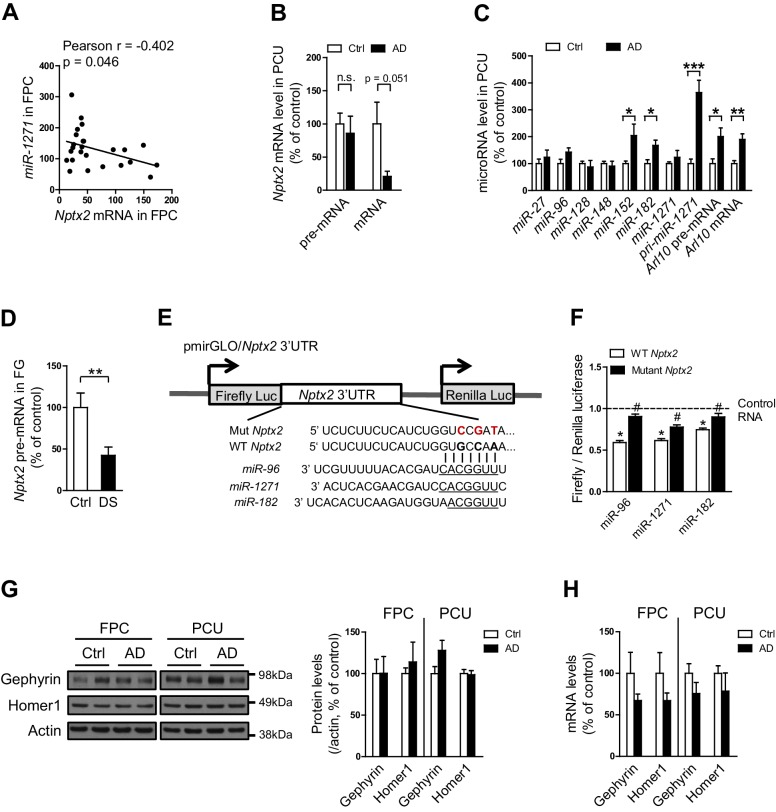
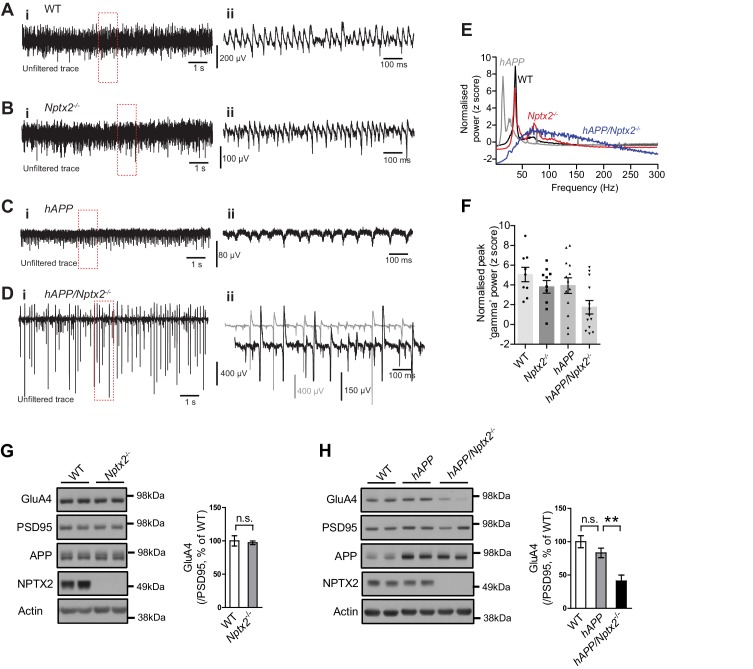
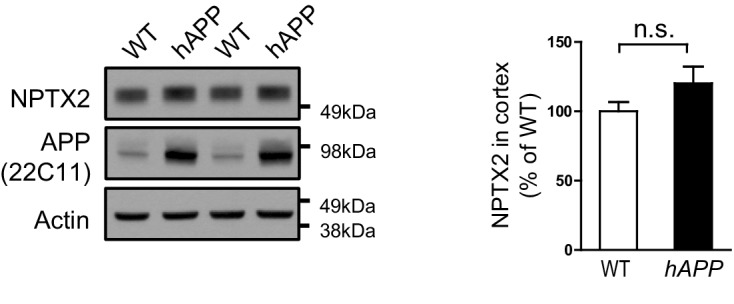
Verification
Claims the paper makes
The claims and statistics of this paper haven’t been checked yet.
Run the check — free, no account needed. It reads the open-access text and checks the sources it cites.
Claims other papers make about this one
Each is checked against this paper’s own text: does it say what the citing paper says it does?
The cited source says what the claim attributes to it.
In the citing paper
“Thus, they might be a good candidate biomarker for disease staging and cognitive prognosis (Galasko et al. 2019; Libiger et al. 2021; Nilsson et al. 2021; Swanson et al. 2016; Xiao et al. 2017).”
From Neuronal pentraxins as biomarkers of synaptic activity: from physiological functions to pathological changes in neurodegeneration (2022) · cites this paper as Xiao et al. 2017
In the citing paper
“NPTXs might be a selective marker for the imbalance of pyramidal neuron-interneuron microcircuits, thought to underlie cognitive impairment in AD (Xiao et al. 2017).”
From Neuronal pentraxins as biomarkers of synaptic activity: from physiological functions to pathological changes in neurodegeneration (2022) · cites this paper as Xiao et al. 2017
In the citing paper
“Deregulation of neuronal activity could explain changes in NPTXs and drive neurogenerative processes (Xiao et al. 2017).”
From Neuronal pentraxins as biomarkers of synaptic activity: from physiological functions to pathological changes in neurodegeneration (2022) · cites this paper as Xiao et al. 2017
In the citing paper
“The receiver operating characteristic (ROC) analysis concluded a similar test performance to distinguish AD from controls than that of the classical AD biomarkers (Xiao et al. 2017).”
From Neuronal pentraxins as biomarkers of synaptic activity: from physiological functions to pathological changes in neurodegeneration (2022) · cites this paper as Xiao et al. 2017
In the citing paper
“The subunit of AMPAR, GluA4, was also reduced in this study (both in the precuneus and medial frontal gyri) and correlated with NPTX2 in both control and AD group (Xiao et al. 2017).”
From Neuronal pentraxins as biomarkers of synaptic activity: from physiological functions to pathological changes in neurodegeneration (2022) · cites this paper as Xiao et al. 2017
In the citing paper
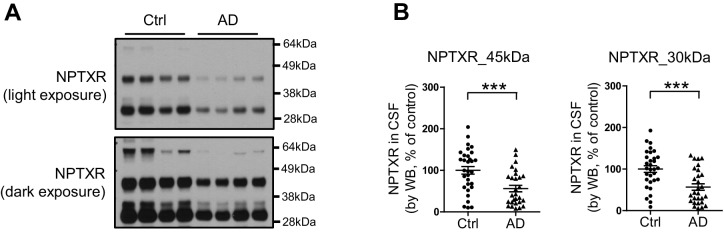
“CSF NPTXR levels, both the full length protein and the peptides resulting from TACE cleavage, were reduced in AD in comparison with controls (Xiao et al. 2017).”
From Neuronal pentraxins as biomarkers of synaptic activity: from physiological functions to pathological changes in neurodegeneration (2022) · cites this paper as Xiao et al. 2017
In the citing paper
“This was further sustained by studies that found NPTX2 correlating with medial temporal atrophy, hippocampal volume and cognitive impairment (Nilsson et al. 2021; Swanson et al. 2016; Xiao et al. 2017).”
From Neuronal pentraxins as biomarkers of synaptic activity: from physiological functions to pathological changes in neurodegeneration (2022) · cites this paper as Xiao et al. 2017
In the citing paper
“Consequently, the reduction of NPTX2 could be linked to the disruption of pyramidal neuron-PV interneuron microcircuit, contributing to cognitive failure in AD (Xiao et al. 2017).”
From Neuronal pentraxins as biomarkers of synaptic activity: from physiological functions to pathological changes in neurodegeneration (2022) · cites this paper as Xiao et al. 2017
In the citing paper
“NPTX2 was also decreased in post-mortem cortex from AD patients (hippocampus not analysed) (Xiao et al. 2017).”
From Neuronal pentraxins as biomarkers of synaptic activity: from physiological functions to pathological changes in neurodegeneration (2022) · cites this paper as Xiao et al. 2017
In the citing paper
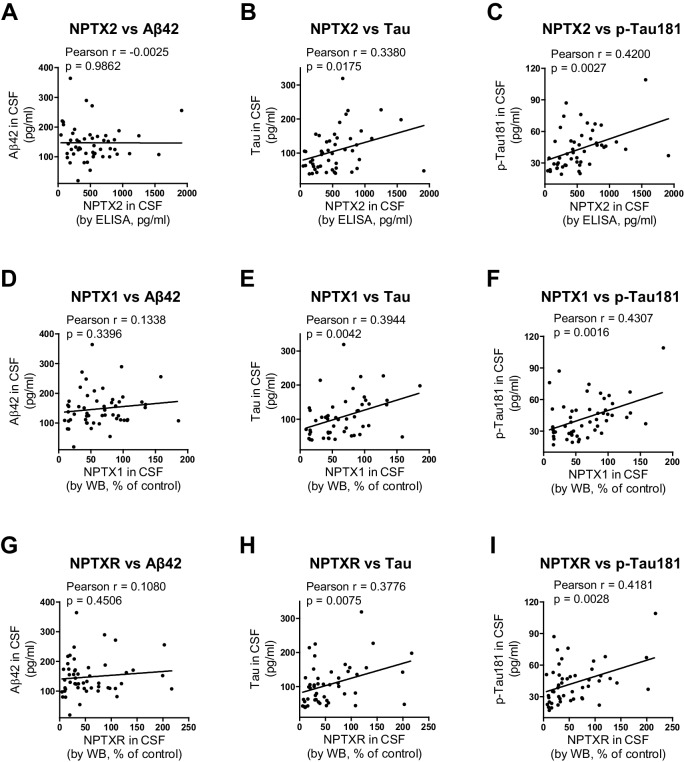
“NPTX2 exhibited a weak correlation with p-tau181 and total tau (Xiao et al. 2017).”
From Neuronal pentraxins as biomarkers of synaptic activity: from physiological functions to pathological changes in neurodegeneration (2022) · cites this paper as Xiao et al. 2017
In the citing paper
“NPTX1 and NPTXR did not correlate with Aβ42, but did weakly correlate with total tau and p-tau181 (Xiao et al. 2017).”
From Neuronal pentraxins as biomarkers of synaptic activity: from physiological functions to pathological changes in neurodegeneration (2022) · cites this paper as Xiao et al. 2017
In the citing paper
“NPTX1 and NPTXR did not correlate with Aβ42, but did weakly correlate with total tau and p-tau181 (Xiao et al. 2017).”
From Neuronal pentraxins as biomarkers of synaptic activity: from physiological functions to pathological changes in neurodegeneration (2022) · cites this paper as Xiao et al. 2017
In the citing paper
“Finally, CSF levels of the different NPTXs strongly correlated with each other in both AD and genetic FTLD, indicating an overall reduction of these proteins in CSF (Nilsson et al. 2021; van der Ende et al. 2020; Xiao et al. 2017).”
From Neuronal pentraxins as biomarkers of synaptic activity: from physiological functions to pathological changes in neurodegeneration (2022) · cites this paper as Xiao et al. 2017
In the citing paper
“Some authors described a weak correlation with Aβ42, mainly in MCI (Galasko et al. 2019; Nilsson et al. 2021), whereas others found no correlation (Xiao et al. 2017).”
From Neuronal pentraxins as biomarkers of synaptic activity: from physiological functions to pathological changes in neurodegeneration (2022) · cites this paper as Xiao et al. 2017
In the citing paper
“NPTXs may contribute to the cognitive decline in neurodegeneration and other diseases of the CNS by modifying the excitatory synaptic drive onto fast-spiking PV interneurons which leads to E/I imbalance.”
From Neuronal pentraxins as biomarkers of synaptic activity: from physiological functions to pathological changes in neurodegeneration (2022) · cites this paper as Xiao et al. 2017
In the citing paper
“This might promote or accelerate disease progression by increasing the demand in other compensatory mechanisms (Hu et al. 2010; Shepherd et al. 2006; Xiao et al. 2017).”
From Neuronal pentraxins as biomarkers of synaptic activity: from physiological functions to pathological changes in neurodegeneration (2022) · cites this paper as Xiao et al. 2017
In the citing paper
“NPTXs also showed an added role when combined with core AD biomarkers in predicting the progression from MCI to AD dementia and in discriminating AD and healthy controls, e.g., NPTX2 in ratio with either total tau or p-tau (Galasko et al. 2019; Xiao et al. 2017).”
From Neuronal pentraxins as biomarkers of synaptic activity: from physiological functions to pathological changes in neurodegeneration (2022) · cites this paper as Xiao et al. 2017
In the citing paper
“Unlike core biomarkers such as Aβ (Williams et al. 2011), CSF NPTXs levels correlated with cognitive scores in AD patients, even in the absence of brain pathology.”
From Neuronal pentraxins as biomarkers of synaptic activity: from physiological functions to pathological changes in neurodegeneration (2022) · cites this paper as Xiao et al. 2017
In the citing paper
“In the pre-symptomatic stage, NPTXs may act as a resilience factor keeping the integrity of the synapses, as previously hypothesised (Xiao et al. 2017).”
From Neuronal pentraxins as biomarkers of synaptic activity: from physiological functions to pathological changes in neurodegeneration (2022) · cites this paper as Xiao et al. 2017
Self-check
Percentages, sums and reported differences re-computed from the paper’s own numbers.
The self-check needs the paper’s full text.
Citations
Cites
Folstein, M. F., Folstein, S. E., & McHugh, P. R. (1975) · Journal of Psychiatric Research · doi:10.1016/0022-3956(75)90026-6 · Cited by 88,282
Hirono, N., Mori, E., Ikejiri, Y., Imamura, T., Shimomura, T., Hashimoto, M., Yamashita, H., & Ikeda, M. (1997) · PubMed · Cited by 21,012
Kok, J. S., Berg, I. J., & Scherder, E. J. A. (2013) · Dementia and Geriatric Cognitive Disorders Extra · doi:10.1159/000353441 · Cited by 20,589
Older Adults' Reasons for Using Technology while Aging in Place
Peek, S. T. M., Luijkx, K. G., Rijnaard, M. D., Nieboer, M. E., van der Voort, C. S., Aarts, S., van Hoof, J., Vrijhoef, H. J., & Wouters, E. (2015) · Gerontology · doi:10.1159/000430949 · Cited by 19,852
Sensitivity and False Alarm Rate of a Fall Sensor in Long-Term Fall Detection in the Elderly
Kangas, M., Korpelainen, R., Vikman, I., Nyberg, L., & Jämsä, T. J. (2014) · Gerontology · doi:10.1159/000362720 · Cited by 19,007
The Brain's Default Network: Anatomy, Function, and Relevance to Disease
Buckner, R. L., Andrews‐Hanna, J. R., & Schacter, D. L. (2008) · Annals of the New York Academy of Sciences · doi:10.1196/annals.1440.011 · Cited by 9,761
Basic principles of ROC analysis
Metz, C. E. (1978) · Seminars in Nuclear Medicine · doi:10.1016/s0001-2998(78)80014-2 · Cited by 6,122
Hypothetical model of dynamic biomarkers of the Alzheimer's pathological cascade
Jack, C. R., Knopman, D. S., Jagust, W. J., Shaw, L. M., Aisen, P. S., Weiner, M. W., Petersen, R. C., & Trojanowski, J. Q. (2010) · The Lancet Neurology · doi:10.1016/s1474-4422(09)70299-6 · Cited by 4,806
Kaplan, E., Goodglass, H., Weıntraub, S., & Segal, O. (2001) · Medical Entomology and Zoology · Cited by 4,378
The Alzheimer’s disease neuroimaging initiative (ADNI): MRI methods
Jack, C. R., Bernstein, M. A., Fox, N. C., Thompson, P., Alexander, G., Harvey, D., Borowski, B., Britson, P. J., L. Whitwell, J., Ward, C., et al. (2008) · Journal of Magnetic Resonance Imaging · doi:10.1002/jmri.21049 · Cited by 4,347
Blessed, G., Tomlinson, B. E., & Roth, M. (1968) · British Journal of Psychiatry · doi:10.1192/bjp.114.512.797 · Cited by 4,117
Shankar, G. M., Li, S., Mehta, T. H., Garcia-Munoz, A., Shepardson, N. E., Smith, I., Brett, F. M., Farrell, M. A., Rowan, M. J., Lemere, C. A., et al. (2008) · Nature Medicine · doi:10.1038/nm1782 · Cited by 3,685
Greicius, M. D., Srivastava, G., Reiss, A. L., & Menon, V. (2004) · Proceedings of the National Academy of Sciences · doi:10.1073/pnas.0308627101 · Cited by 3,684
Dynamic predictions: Oscillations and synchrony in top–down processing
Engel, A. K., Fries, P., & Singer, W. (2001) · Nature Reviews Neuroscience · doi:10.1038/35094565 · Cited by 3,454
The assessment of aphasia and related disorders
Goodglass, H., & Kaplan, E. (1972) · Medical Entomology and Zoology · Cited by 3,258
A Standardized Memory Scale for Clinical Use
Wechsler, D. (1945) · The Journal of Psychology · doi:10.1080/00223980.1945.9917223 · Cited by 2,949
Buckner, R. L., Sepulcre, J., Talukdar, T., Krienen, F. M., Liu, H., Hedden, T., Andrews-Hanna, J. R., Sperling, R. A., & Johnson, K. A. (2009) · The Journal of Neuroscience · doi:10.1523/jneurosci.5062-08.2009 · Cited by 2,862
Mechanisms of Gamma Oscillations
Buzsáki, G., & Wang, X.-J. (2012) · Annual Review of Neuroscience · doi:10.1146/annurev-neuro-062111-150444 · Cited by 2,796
A Modified Card Sorting Test Sensitive to Frontal Lobe Defects
Nelson, H. E. (1976) · Cortex · doi:10.1016/s0010-9452(76)80035-4 · Cited by 2,454
Assessment of Aphasia and Related Disorders
Sarno, M. T. (1973) · Physical Therapy · doi:10.1093/ptj/53.2.225b · Cited by 2,256
Buckner, R. L., Snyder, A. Z., Shannon, B. J., LaRossa, G., Sachs, R., Fotenos, A. F., Sheline, Y. I., Klunk, W. E., Mathis, C. A., Morris, J. C., et al. (2005) · The Journal of Neuroscience · doi:10.1523/jneurosci.2177-05.2005 · Cited by 2,140
The Cellular Phase of Alzheimer’s Disease
De Strooper, B., & Karran, E. (2016) · Cell · doi:10.1016/j.cell.2015.12.056 · Cited by 1,990
Palop, J. J., Chin, J., Roberson, E. D., Wang, J., Thwin, M. T., Bien-Ly, N., Yoo, J., Ho, K. O., Yu, G.-Q., Kreitzer, A., et al. (2007) · Neuron · doi:10.1016/j.neuron.2007.07.025 · Cited by 1,653
APP Processing and Synaptic Function
Kamenetz, F., Tomita, T., Hsieh, H., Seabrook, G., Borchelt, D., Iwatsubo, T., Sisodia, S., & Malinow, R. (2003) · Neuron · doi:10.1016/s0896-6273(03)00124-7 · Cited by 1,644
WAIS-R manual : Wechsler adult intelligence scale-revised
Wechsler, D. (1981) · Medical Entomology and Zoology · Cited by 1,559
Alzheimer’s Disease Neuroimaging Initiative
Mueller, S. G., Weiner, M. W., Thal, L. J., Petersen, R. C., Jack, C. R., Jagust, W. J., Trojanowski, J. Q., Toga, A. W., & Beckett, L. A. (2007) · Springer eBooks · doi:10.1007/978-0-387-72076-0_18 · Cited by 1,493
California Verbal Learning Test
Delis, D. C., Freeland, J., Kramer, J. H., & Kaplan, E. (1987) · PsycTESTS Dataset · doi:10.1037/t48844-000 · Cited by 1,450
Prediction of AD with MRI-based hippocampal volume in mild cognitive impairment
Jack, C. R., Petersen, R. C., Xu, Y. C., O’Brien, P. C., Smith, G. E., Ivnik, R. J., Boeve, B. F., Waring, S. C., Tangalos, E. G., & Kokmen, E. (1999) · Neurology · doi:10.1212/wnl.52.7.1397 · Cited by 1,404
Borkowski, J. G., Benton, A. L., & Spreen, O. (1967) · Neuropsychologia · doi:10.1016/0028-3932(67)90015-2 · Cited by 1,324
Geiger, J. R. P., Melcher, T., Koh, D.-S., Sakmann, B., Seeburg, P. H., Jonas, P., & Monyer, H. (1995) · Neuron · doi:10.1016/0896-6273(95)90076-4 · Cited by 1,260
Verret, L., Mann, E. O., Hang, G. B., Barth, A. M. I., Cobos, I., Ho, K., Devidze, N., Masliah, E., Kreitzer, A. C., Mody, I., et al. (2012) · Cell · doi:10.1016/j.cell.2012.02.046 · Cited by 1,216
Homeostatic Synaptic Plasticity: Local and Global Mechanisms for Stabilizing Neuronal Function
Turrigiano, G. (2012) · Cold Spring Harbor Perspectives in Biology · doi:10.1101/cshperspect.a005736 · Cited by 1,139 · cited 1×
“This adaptive strengthening of the pyramidal neuron-PV interneuron synapse mediates homeostatic scaling of the circuit, a process implicated in the ability of circuits to encode information (Turrigiano, 2012).”
BackgroundEnvironment-specific expression of the immediate-early gene Arc in hippocampal neuronal ensembles
Guzowski, J. F., McNaughton, B. L., Barnes, C. A., & Worley, P. F. (1999) · Nature Neuroscience · doi:10.1038/16046 · Cited by 1,032
Self-citationSperling, R. A., LaViolette, P. S., O'Keefe, K., O'Brien, J., Rentz, D. M., Pihlajamaki, M., Marshall, G., Hyman, B. T., Selkoe, D. J., Hedden, T., et al. (2009) · Neuron · doi:10.1016/j.neuron.2009.07.003 · Cited by 1,027
Borchelt, D. R., Ratovitski, T., van Lare, J., Lee, M. K., Gonzales, V., Jenkins, N. A., Copeland, N. G., Price, D. L., & Sisodia, S. S. (1997) · Neuron · doi:10.1016/s0896-6273(00)80974-5 · Cited by 1,023
Biomarker Modeling of Alzheimer’s Disease
Jack, C. R., & Holtzman, D. M. (2013) · Neuron · doi:10.1016/j.neuron.2013.12.003 · Cited by 1,002
Oscillatory coupling of hippocampal pyramidal cells and interneurons in the behaving rat
Csicsvari, J., Hirase, H., Czurkó, A., Mamiya, A., & Buzsáki, G. (1999) · The Journal of Neuroscience · doi:10.1523/jneurosci.19-01-00274.1999 · Cited by 966
Coherent spontaneous activity identifies a hippocampal-parietal memory network
Vincent, J. L., Snyder, A. Z., Fox, M. D., Shannon, B. J., Andrews, J. R., Raichle, M. E., & Buckner, R. L. (2006) · Journal of Neurophysiology · doi:10.1152/jn.00048.2006 · Cited by 959 · cited 2×
“(Buckner et al., 2008; Greicius et al., 2004; Vincent et al., 2006) and is notable for high levels of amyloid detected by PET in AD subjects and some aged control individuals (Sperling et al.”
BackgroundInfluentialCholinergic induction of network oscillations at 40 Hz in the hippocampus in vitro
Fisahn, A., Pike, F. G., Buhl, E. H., & Paulsen, O. (1998) · Nature · doi:10.1038/28179 · Cited by 884
Arc/Arg3.1 Mediates Homeostatic Synaptic Scaling of AMPA Receptors
Shepherd, J. D., Rumbaugh, G., Wu, J., Chowdhury, S., Plath, N., Kuhl, D., Huganir, R. L., & Worley, P. F. (2006) · Neuron · doi:10.1016/j.neuron.2006.08.034 · Cited by 779
Self-citationEpisodic and Semantic Memory: A Comparison of Amnesic and Demented Patients
Butters, N., Granholm, E. L., Salmon, D. P., Grant, I., & Wolfe, J. (1987) · Journal of Clinical and Experimental Neuropsychology · doi:10.1080/01688638708410764 · Cited by 596
Self-citationUm, J. W., Kaufman, A. C., Kostylev, M., Heiss, J. K., Stagi, M., Takahashi, H., Kerrisk, M. E., Vortmeyer, A., Wisniewski, T., Koleske, A. J., et al. (2013) · Neuron · doi:10.1016/j.neuron.2013.06.036 · Cited by 572
Coordinate Regulation of FOXO1 by miR-27a, miR-96, and miR-182 in Breast Cancer Cells
Reed, I. K. G., & White, B. A. (2009) · Journal of Biological Chemistry · doi:10.1074/jbc.m109.031427 · Cited by 569
Quantitative and qualitative analyses of clock drawings in Alzheimer's and Huntington's disease
Rouleau, I., Salmon, D. P., Butters, N., Kennedy, C. M., & McGuire, K. (1992) · Brain and Cognition · doi:10.1016/0278-2626(92)90112-y · Cited by 556
Self-citationFuchs, E. C., Zivkovic, A. R., Cunningham, M. O., Middleton, S., LeBeau, F. E. N., Bannerman, D. M., Rozov, A., Whittington, M. A., Traub, R. D., Rawlins, J. N. P., et al. (2007) · Neuron · doi:10.1016/j.neuron.2007.01.031 · Cited by 532
Detection and Staging of Dementia in Alzheimer's Disease
Welsh-Bohmer, K. A. (1992) · Archives of Neurology · doi:10.1001/archneur.1992.00530290030008 · Cited by 473
Synaptic clustering of AMPA receptors by the extracellular immediate-early gene product narp.
O’Brien, R. J., Xu, D., Petralia, R. S., Steward, O., Huganir, R. L., & Worley, P. (1999) · Neuron · doi:10.1016/s0896-6273(00)80782-5 · Cited by 471
Self-citationWeiner, M. W., Veitch, D. P., Aisen, P. S., Beckett, L. A., Cairns, N. J., Cedarbaum, J., Green, R. C., Harvey, D., Jack, C. R., Jagust, W., et al. (2015) · Alzheimer's & Dementia · doi:10.1016/j.jalz.2014.11.001 · Cited by 348
Sato, N., Fukushima, N., Maitra, A., Matsubayashi, H., Yeo, C. J., Cameron, J. L., Hruban, R. H., & Goggins, M. (2003) · PubMed · Cited by 328
Narp regulates homeostatic scaling of excitatory synapses on parvalbumin-expressing interneurons
Chang, M. C., Park, J. M., Pelkey, K. A., Grabenstatter, H. L., Xu, D., Linden, D. J., Sutula, T. P., McBain, C. J., & Worley, P. F. (2010) · Nature Neuroscience · doi:10.1038/nn.2621 · Cited by 316
Self-citationTsui, C., Copeland, N., Gilbert, D., Jenkins, N., Barnes, C., & Worley, P. (1996) · The Journal of Neuroscience · doi:10.1523/jneurosci.16-08-02463.1996 · Cited by 315
Self-citationVazdarjanova, A. I., McNaughton, B. L., Barnes, C. A., Worley, P. F., & Guzowski, J. F. (2002) · Journal of Neuroscience · doi:10.1523/jneurosci.22-23-10067.2002 · Cited by 307
Self-citationAlzheimer's disease in Down syndrome: Neurobiology and risk
Zigman, W. B., & Lott, I. T. (2007) · Mental Retardation and Developmental Disabilities Research Reviews · doi:10.1002/mrdd.20163 · Cited by 290
Xu, D., Hopf, C., Reddy, R., Cho, R. W., Guo, L., Lanahan, A., Petralia, R. S., Wenthold, R. J., O'Brien, R. J., & Worley, P. (2003) · Neuron · doi:10.1016/s0896-6273(03)00463-x · Cited by 265
Self-citationHomeostatic Scaling Requires Group I mGluR Activation Mediated by Homer1a
Hu, J.-H., Park, J. M., Park, S. J., Xiao, B., Dehoff, M. H., Kim, S., Hayashi, T., Schwarz, M. K., Huganir, R. L., Seeburg, P. H., et al. (2010) · Neuron · doi:10.1016/j.neuron.2010.11.008 · Cited by 263
Self-citationSannerud, R., Declerck, I., Peric, A., Raemaekers, T., Menéndez, G., Zhou, L., Baert, V., Coen, K., Munck, S., Strooper, B. D., et al. (2011) · Proceedings of the National Academy of Sciences · doi:10.1073/pnas.1100745108 · Cited by 249
Pelkey, K. A., Barksdale, E., Craig, M. T., Yuan, X., Sukumaran, M., Vargish, G. A., Mitchell, R. M., Wyeth, M. S., Petralia, R. S., Chittajallu, R., et al. (2015) · Neuron · doi:10.1016/j.neuron.2015.02.020 · Cited by 245
Self-citationArc/Arg3.1 Regulates an Endosomal Pathway Essential for Activity-Dependent β-Amyloid Generation
Wu, J., Petralia, R. S., Kurushima, H., Patel, H., Jung, M., Volk, L. J., Chowdhury, S., Shepherd, J. D., Dehoff, M. H., Li, Y., et al. (2011) · Cell · doi:10.1016/j.cell.2011.09.036 · Cited by 221
Self-citationComery, T. A., Martone, R. L., Aschmies, S., Atchison, K. P., Diamantidis, G., Gong, X., Zhou, H., Kreft, A. F., Pangalos, M. N., Sonnenberg‐Reines, J., et al. (2005) · Journal of Neuroscience · doi:10.1523/jneurosci.2693-05.2005 · Cited by 214
Fjell, A. M., Walhovd, K. B., Fennema‐Notestine, C., McEvoy, L. K., Hagler, D. J., Holland, D., Brewer, J. B., Dale, A. M., & Initiative, A. D. N. (2010) · Journal of Neuroscience · doi:10.1523/jneurosci.3785-09.2010 · Cited by 211
Self-citationPredicting MCI outcome with clinically available MRI and CSF biomarkers
Heister, D. S., Brewer, J. B., Magda, S., Blennow, K., McEvoy, L. K., & Initiative, A. D. N. (2011) · Neurology · doi:10.1212/wnl.0b013e3182343314 · Cited by 206
Self-citationSia, G.-M., Béïque, J.-C., Rumbaugh, G., Cho, R., Worley, P. F., & Huganir, R. L. (2007) · Neuron · doi:10.1016/j.neuron.2007.06.020 · Cited by 201
Self-citationA review of gamma oscillations in healthy subjects and in cognitive impairment
Başar, E. (2013) · International Journal of Psychophysiology · doi:10.1016/j.ijpsycho.2013.07.005 · Cited by 197
Reporting standards for studies of diagnostic test accuracy in dementia
Noel-Storr, A. H., McCleery, J. M., Richard, E., Ritchie, C. W., Flicker, L. A., Cullum, S. J., Davis, D. H. J., Quinn, T. J., Hyde, C., Rutjes, A. W., et al. (2014) · Neurology · doi:10.1212/wnl.0000000000000621 · Cited by 196
Brewer, J. B., Magda, S., Airriess, C. N., & Smith, M. E. (2008) · American Journal of Neuroradiology · doi:10.3174/ajnr.a1402 · Cited by 178
Self-citationTrafficking regulation of proteins in Alzheimer’s disease
Jiang, S., Li, Y., Zhang, X., Bu, G., Xu, H., & Zhang, Y. (2014) · Molecular Neurodegeneration · doi:10.1186/1750-1326-9-6 · Cited by 164
Priming of Hippocampal Population Bursts by Individual Perisomatic-Targeting Interneurons
Ellender, T. J., Nissen, W., Colgin, L. L., Mann, E. O., & Paulsen, O. (2010) · Journal of Neuroscience · doi:10.1523/jneurosci.3962-09.2010 · Cited by 163
O'Brien, R., Xu, D., Mi, R., Tang, X., Hopf, C., & Worley, P. (2002) · The Journal of Neuroscience · doi:10.1523/jneurosci.22-11-04487.2002 · Cited by 160
Self-citationHirata, H., Ueno, K., Shahryari, V., Deng, G., Tanaka, Y., Tabatabai, Z. L., Hinoda, Y., & Dahiya, R. (2013) · PLoS ONE · doi:10.1371/journal.pone.0055502 · Cited by 147
Kimura, R., Devi, L., & Ohno, M. (2010) · Journal of Neurochemistry · doi:10.1111/j.1471-4159.2010.06608.x · Cited by 147
Presynaptic neuronal pentraxin receptor organizes excitatory and inhibitory synapses
Lee, S.-J., Wei, M., Zhang, C., Maxeiner, S., Pak, C., Calado Botelho, S., Trotter, J., Sterky, F. H., & Südhof, T. C. (2017) · The Journal of Neuroscience · doi:10.1523/jneurosci.2768-16.2016 · Cited by 146
Angulo, M. C., Lambolez, B., Audinat, É., Hestrin, S., & Rossier, J. (1997) · Journal of Neuroscience · doi:10.1523/jneurosci.17-17-06685.1997 · Cited by 136
Impact of Alzheimer's pathology on cognitive trajectories in nondemented elderly
Driscoll, I., Resnick, S. M., Troncoso, J. C., An, Y., O'Brien, R., & Zonderman, A. B. (2006) · Annals of Neurology · doi:10.1002/ana.21031 · Cited by 132
Self-citationAsymptomatic Alzheimers Disease: A Prodrome or a State of Resilience?
Driscoll, I., & Troncoso, J. (2011) · Current Alzheimer Research · doi:10.2174/156720511795745348 · Cited by 130
Self-citationFunctional Connectivity in Autosomal Dominant and Late-Onset Alzheimer Disease
Thomas, J. B., Brier, M. R., Bateman, R. J., Snyder, A. Z., Benzinger, T. L., Xiong, C., Raichle, M., Holtzman, D. M., Sperling, R. A., Mayeux, R., et al. (2014) · JAMA Neurology · doi:10.1001/jamaneurol.2014.1654 · Cited by 129
Huang, Y. A., Ruiz, C. R., Eyler, E. C. H., Lin, K., & Meffert, M. K. (2012) · Cell · doi:10.1016/j.cell.2012.01.036 · Cited by 126
Cho, R. W., Park, J. M., Wolff, S. B. E., Xu, D., Hopf, C., Kim, J.-A., Reddy, R. C., Petralia, R. S., Perin, M. S., Linden, D. J., et al. (2008) · Neuron · doi:10.1016/j.neuron.2008.01.010 · Cited by 125
Self-citationObligatory Role for the Immediate Early Gene NARP in Critical Period Plasticity
Gu, Y., Huang, S., Chang, M., Worley, P. F., Kirkwood, A., & Quinlan, E. M. (2013) · Neuron · doi:10.1016/j.neuron.2013.05.016 · Cited by 124
Self-citationMikuni, T., Uesaka, N., Okuno, H., Hirai, H., Deisseroth, K. A., Bito, H., & Kano, M. (2013) · Neuron · doi:10.1016/j.neuron.2013.04.036 · Cited by 120
Chiang, C.-P., Hou, M., & Hung, W. (2013) · Biochimica et Biophysica Acta (BBA) - General Subjects · doi:10.1016/j.bbagen.2013.01.009 · Cited by 119
miR-96 regulates the progression of differentiation in mammalian cochlear inner and outer hair cells
Kuhn, S., Johnson, S. L., Furness, D. N., Chen, J., Ingham, N., Hilton, J. M., Steffes, G., Lewis, M. A., Zampini, V., Hackney, C. M., et al. (2011) · Proceedings of the National Academy of Sciences · doi:10.1073/pnas.1016646108 · Cited by 114
Demanuele, C., James, C. J., & Sonuga-Barke, E. J. S. (2007) · Behavioral and Brain Functions · doi:10.1186/1744-9081-3-62 · Cited by 92
Swanson, A., & Willette, A. A. (2016) · Brain, Behavior, and Immunity · doi:10.1016/j.bbi.2016.07.148 · Cited by 79
Inhibition of miR-96 expression reduces cell proliferation and clonogenicity of HepG2 hepatoma cells
Xu, D., He, X., Chang, Y., Xu, C., Jiang, X. W., Sun, S., & Lin, J. (2012) · Oncology Reports · doi:10.3892/or.2012.2138 · Cited by 70
Self-citationNelson, P. T., Abner, E. L., Scheff, S. W., Schmitt, F. A., Kryscio, R. J., Jicha, G. A., Smith, C. D., Patel, E., & Markesbery, W. R. (2009) · Neuroscience Letters · doi:10.1016/j.neulet.2008.11.006 · Cited by 70
Townsend, M., Qu, Y., Gray, A. J., Wu, Z., Seto, T., Hutton, M., Shearman, M. S., & Middleton, R. E. (2010) · Journal of Pharmacology and Experimental Therapeutics · doi:10.1124/jpet.109.163691 · Cited by 42
Human miR-1271 is a miR-96 paralog with distinct non-conserved brain expression pattern
Jensen, K. P., & Covault, J. (2010) · Nucleic Acids Research · doi:10.1093/nar/gkq798 · Cited by 38
Pelkey, K. A., Barksdale, E., Craig, M. T., Yuan, X., Sukumaran, M., Vargish, G. A., Mitchell, R. M., Wyeth, M. S., Petralia, R. S., Chittajallu, R., et al. (2016) · Neuron · doi:10.1016/j.neuron.2016.04.024 · Cited by 22
Self-citationZhang, L., Gao, J., Li, Z., & Gong, Y.-F. (2012) · Digestive Diseases and Sciences · doi:10.1007/s10620-012-2202-8 · Cited by 21
Longitudinal brain activity changes in asymptomatic Alzheimer disease
Codispoti, K.-E., Beason‐Held, L. L., Kraut, M. A., O’Brien, R., Rudow, G. L., Pletniková, O., Crain, B. J., Troncoso, J. C., & Resnick, S. M. (2012) · Brain and Behavior · doi:10.1002/brb3.47 · Cited by 14
Self-citation
Cited by
Sorted by citations
Antonarakis, S. E., Skotko, B. G., Rafii, M. S., Strydom, A., Pape, S. E., Bianchi, D. W., Sherman, S. L., & Reeves, R. H. (2020) · Nature Reviews Disease Primers · doi:10.1038/s41572-019-0143-7 · Cited by 964
Self-citationLópez, J. A., González, H. M., & Léger, G. C. (2019) · Handbook of clinical neurology · doi:10.1016/b978-0-12-804766-8.00013-3 · Cited by 887
Deep Multilayer Brain Proteomics Identifies Molecular Networks in Alzheimer’s Disease Progression
Bai, B., Wang, X., Li, Y., Chen, P.-C., Yu, K., Dey, K. K., Yarbro, J. M., Han, X., Lutz, B. M., Rao, S., et al. (2020) · Neuron · doi:10.1016/j.neuron.2019.12.015 · Cited by 565
“(F) Consistent protein changes of 8 proteins in AD brain tissue and CSF.”
BackgroundInfluentialSynaptic degeneration in Alzheimer disease
Tzioras, M., McGeachan, R. I., Durrant, C. S., & Spires-Jones, T. L. (2023) · Nature Reviews Neurology · doi:10.1038/s41582-022-00749-z · Cited by 504
Mathys, H., Peng, Z., Boix, C. A., Victor, M. B., Leary, N., Babu, S., Abdelhady, G., Jiang, X., Ng, A. P., Ghafari, K., et al. (2023) · Cell · doi:10.1016/j.cell.2023.08.039 · Cited by 495
Metadata
- Authors
- Xiao, M.-F., Xu, D., Craig, M. T., Pelkey, K. A., Chien, C.-C., Shi, Y., Zhang, J., Resnick, S., Pletnikova, O., Salmon, D., Brewer, J., Edland, S., Wegiel, J., Tycko, B., Savonenko, A., Reeves, R. H., Troncoso, J. C., McBain, C. J., Galasko, D., & Worley, P. F.
- Affiliations
- Johns Hopkins University (US)
- Eunice Kennedy Shriver National Institute of Child Health and Human Development (US)
- National Institute on Aging (US)
- Department of Pathology, Johns Hopkins University School of Medicine, Baltimore, United States
- University of California San Diego (US)
- Institute for Basic Research, New York City, United States
- Columbia University (US)
- Corresponding author
- Worley, Paul F
- ORCID
- Venue
- eLife
- Publisher
- eLife Sciences Publications, Ltd
- Published
- 2017-03-23
- Volume
- 6
- ISSN
- 2050-084X (ISSN-L)
- PMC
- PMC5404919
- OpenAlex
- W2606988847
- Cited by
- 316
- References
- 91
- Citations by year
- 2026: 26 · 2025: 35 · 2024: 43 · 2023: 28 · 2022: 27 · 2021: 49 · 2020: 49 · 2019: 37 · 2018: 18 · 2017: 4
- FWCI
- 14.45
- Type
- journal article
- Language
- en
- Open access
- gold
- doi.org
- Licence
- Locations
- eLife (publishedVersion, cc-by)
- PubMed Central (publishedVersion, cc-by)
- PubMed (publishedVersion)
- ENLIGHTEN (Jurnal Bimbingan dan Konseling Islam) (acceptedVersion)
- DOAJ (DOAJ: Directory of Open Access Journals) (submittedVersion, cc-by-sa)
- eScholarship (California Digital Library) (submittedVersion)
- eScholarship (California Digital Library) (submittedVersion, cc-by)
- Figshare (submittedVersion, cc-by)
- Open Research Exeter (University of Exeter) (submittedVersion, cc-by)
- Funders
- LuMind Research Down Syndrome Foundation
- National Institute on Aging (AG05131)
- National Institute of Mental Health (P50 AG005146-27, MH100024, R35 NS-097966)
- Alzheimer’s drug discovery foundation (20021106)
- Topics
- Life Sciences › Neuroscience › Cellular and Molecular Neuroscience › Neuroscience and Neuropharmacology Research
- Life Sciences › Neuroscience › Cellular and Molecular Neuroscience › Alzheimer's disease research and treatments
- Health Sciences › Medicine › Psychiatry and Mental health › Dementia and Cognitive Impairment Research
- Keywords
- NPTX2, Alzheimer's disease, cognitive impairment, GluA4, AMPA receptors, parvalbumin interneurons, fast-spiking interneurons, pyramidal neurons, hippocampus, cortical excitability, neural oscillations, amyloidosis, memory loss, cerebrospinal fluid biomarkers, hippocampal volume, synaptogenesis
- MeSH terms
- Pentraxins, Alzheimer Disease, Animals, C-Reactive Protein, Cerebral Cortex, Disease Models, Animal, Hippocampus, Humans, Nerve Tissue Proteins, Mice, Knockout, Mice, Cognitive Dysfunction
About these checks
Registry, retraction, Cites and statistics results are computed, not judged, with one exception: a printed reference that no index lists is read once by a model before it counts as a citation error. Claims are extracted by a model and kept only when their quote appears verbatim in the text; each cited source is then checked, with a model’s help, for whether it says what the claim relies on. Those verdicts can be wrong — read the claim’s quote and the cited source before relying on one.
Statistics and arithmetic are recomputed, not judged.
Confidence bands are shown only for fields calibrated on our annotated test set. None is calibrated yet, so no band is shown.
What counts as a claim ›How we measure confidence ›How we check this ›
Are you an author, or do you see a problem with this page? Request a review
