

The DOI matches its Crossref record; 103 of the 106 references it cites were found in a registry or an index, and 3 are not checked yet.
Support for a clade of Placozoa and Cnidaria in genes with minimal compositional bias
Open accessPublished version of a preprint
Abstract
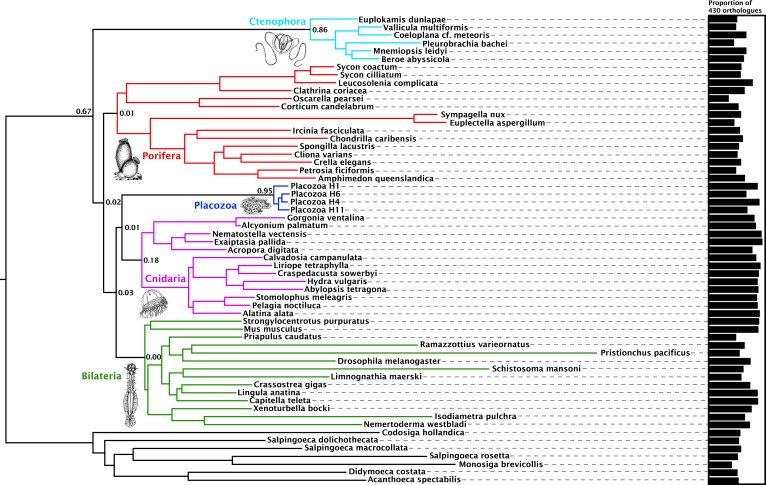
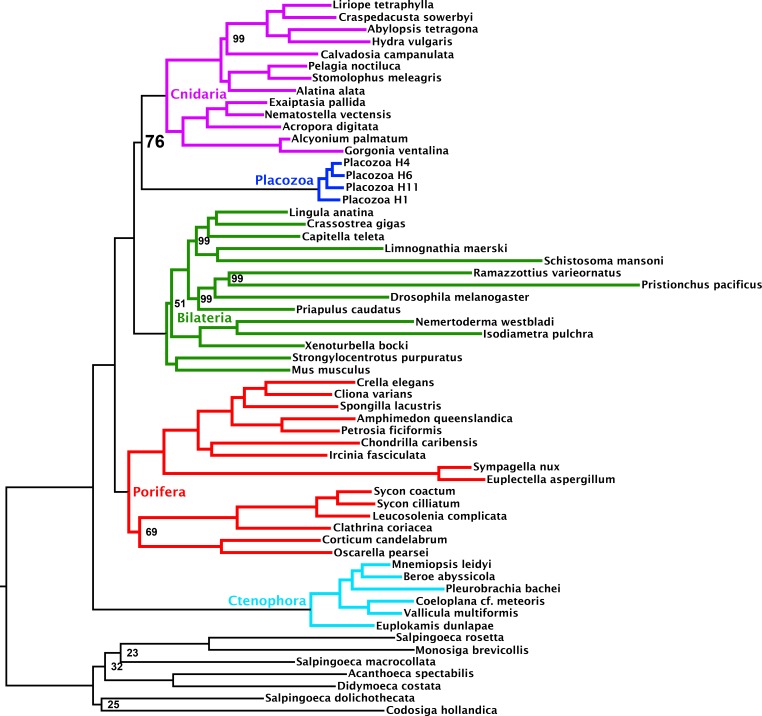
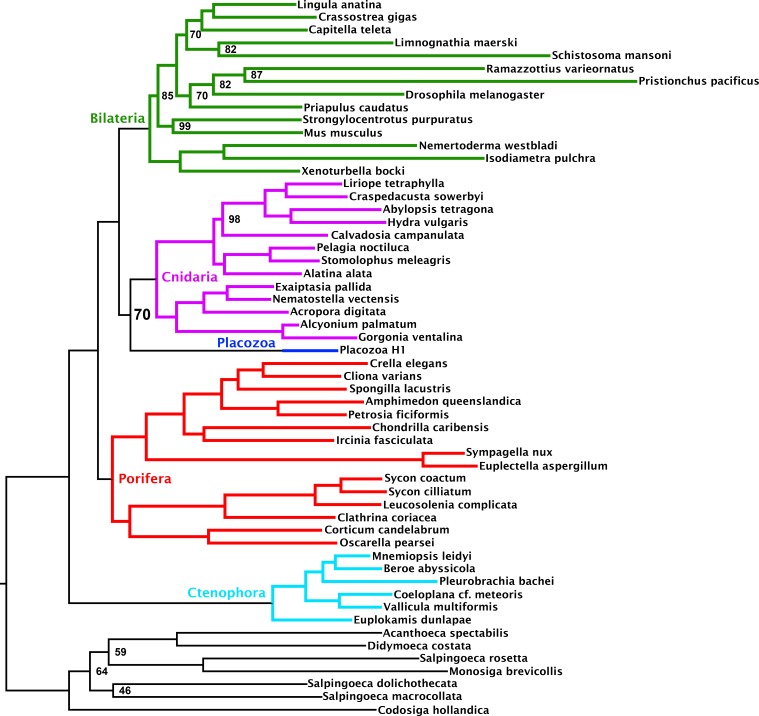
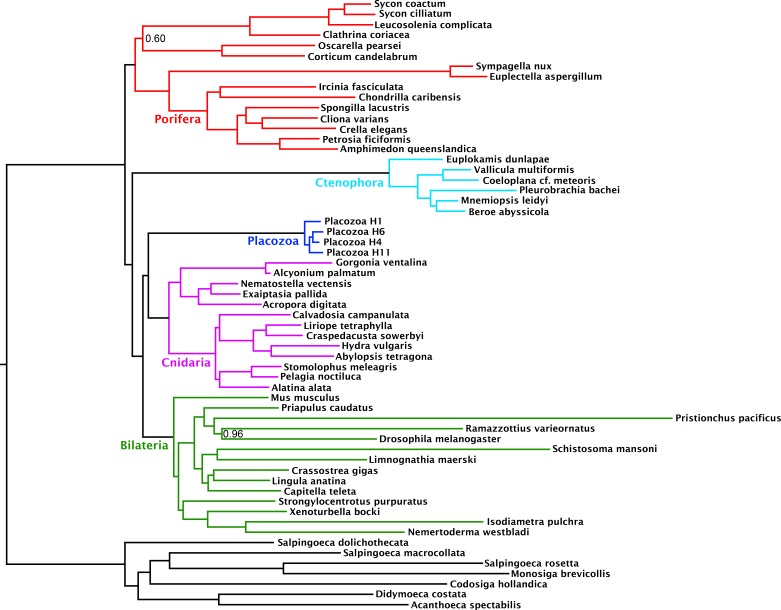
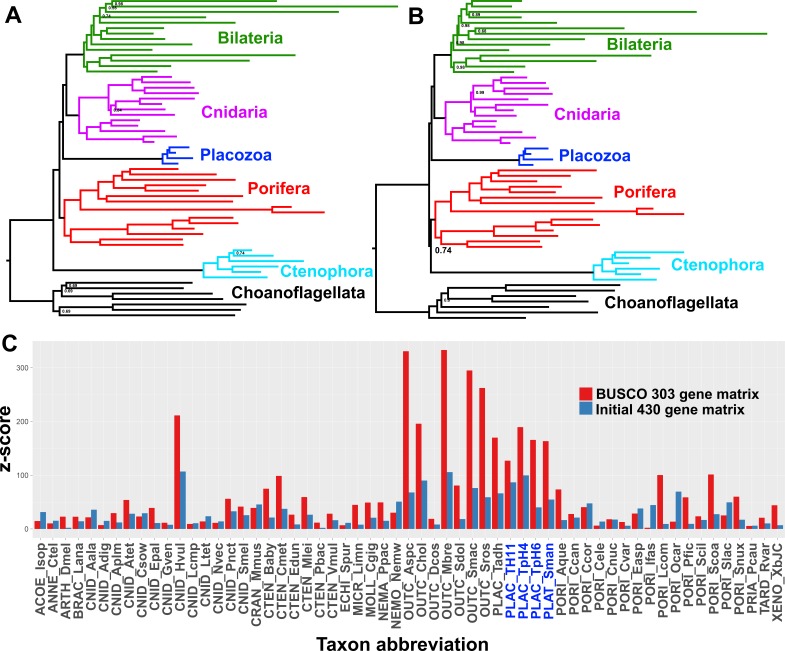
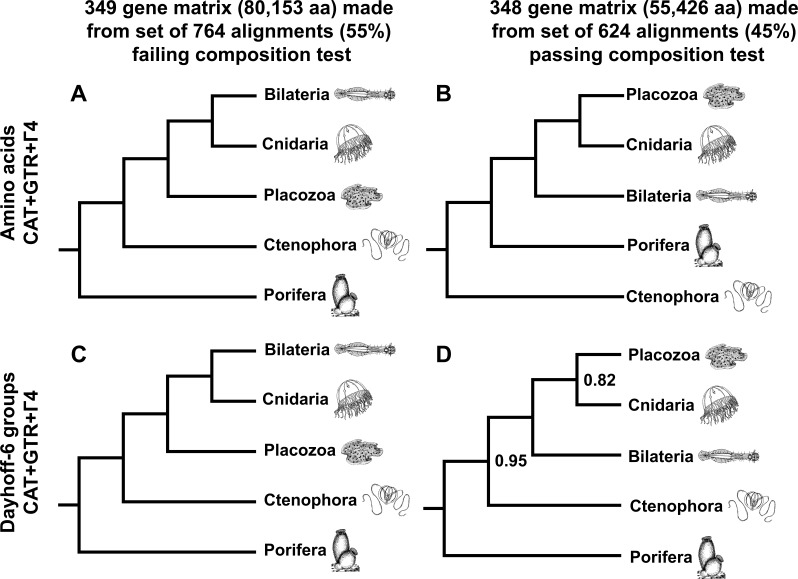
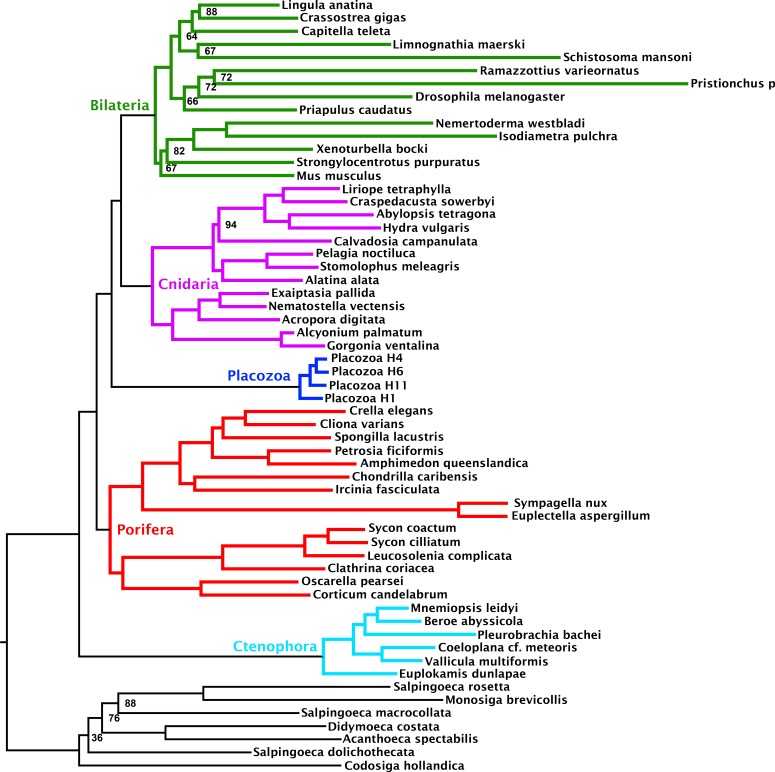
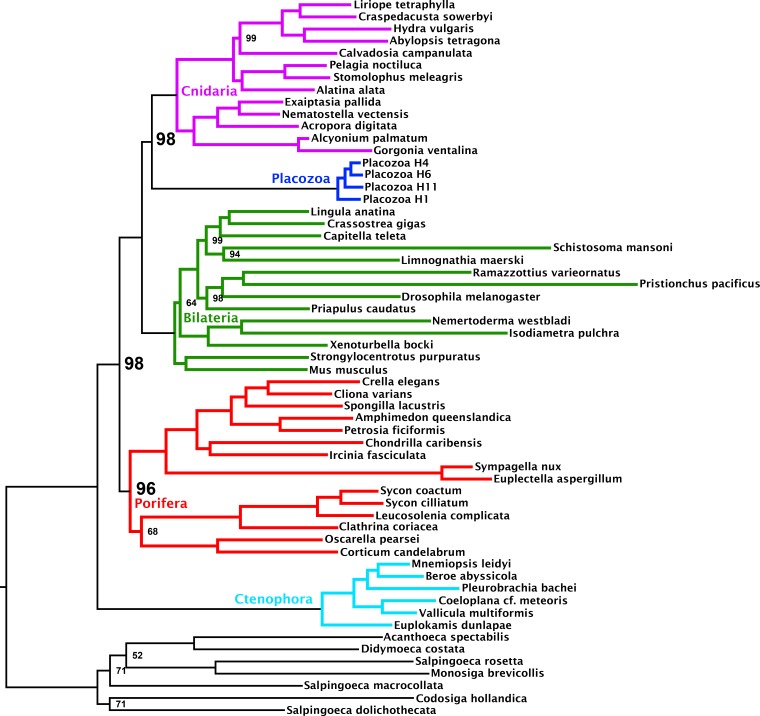
The phylogenetic placement of the morphologically simple placozoans is crucial to understanding the evolution of complex animal traits. Here, we examine the influence of adding new genomes from placozoans to a large dataset designed to study the deepest splits in the animal phylogeny. Using site-heterogeneous substitution models, we show that it is possible to obtain strong support, in both amino acid and reduced-alphabet matrices, for either a sister-group relationship between Cnidaria and Placozoa, or for Cnidaria and Bilateria as seen in most published work to date, depending on the orthologues selected to construct the matrix. We demonstrate that a majority of genes show evidence of compositional heterogeneity, and that support for the Cnidaria + Bilateria clade can be assigned to this source of systematic error. In interpreting these results, we caution against a peremptory reading of placozoans as secondarily reduced forms of little relevance to broader discussions of early animal evolution.
Overview
The claims and statistics of this paper haven’t been checked yet.
Run the check — free, no account needed. It reads the open-access text and checks the sources it cites.
Integrity signals
Registry
Cites
Statistics
Figures
Verification
Claims the paper makes
The claims and statistics of this paper haven’t been checked yet.
Run the check — free, no account needed. It reads the open-access text and checks the sources it cites.
Claims other papers make about this one
Each is checked against this paper’s own text: does it say what the citing paper says it does?
The cited source says what the claim attributes to it.
In the citing paper
“The RL2 findings also support recent efforts pairing recoding and site-heterogeneous models to resolve difficult, ancient nodes in animal phylogeny5,9,24,33, despite the erosion of data relevant to more shallow nodes.”
From Evidence for sponges as sister to all other animals from partitioned phylogenomics with mixture models and recoding (2021) · cites this paper as [33]
The cited source says what the claim attributes to it.
In the citing paper
“We also recovered Placozoa as sister to Cnidaria in our recoded analyses of the WEA15 dataset (RL1 UFBOOT = 54%; RL2 UFBOOT = 90%) (Supplementary Fig. 22), in-line with the proposal that compositional heterogeneity obscures this relationship33.”
From Evidence for sponges as sister to all other animals from partitioned phylogenomics with mixture models and recoding (2021) · cites this paper as [33]
The cited source says what the claim attributes to it.
In the citing paper
“Interestingly, some recent studies have reported Placozoa as sister to Cnidaria (sometimes paired with Ctenophora second) when minimizing compositional heterogeneity5,33, and we have also recovered some support for this (RL2 analysis of WEA15 dataset) (Fig. 3c).”
From Evidence for sponges as sister to all other animals from partitioned phylogenomics with mixture models and recoding (2021) · cites this paper as [33]
Self-check
Percentages, sums and reported differences re-computed from the paper’s own numbers.
The self-check needs the paper’s full text.
Citations
Cites
STAR: ultrafast universal RNA-seq aligner
Dobin, A., Davis, C. A., Schlesinger, F., Drenkow, J., Zaleski, C., Jha, S., Batut, P., Chaisson, M., & Gingeras, T. R. (2013) · Bioinformatics · doi:10.1093/bioinformatics/bts635 · Cited by 51,709
SPAdes: A New Genome Assembly Algorithm and Its Applications to Single-Cell Sequencing
Bankevich, A., Nurk, S., Antipov, D., Gurevich, A. A., Dvorkin, M. V., Kulikov, A. S., Lesin, V. M., Nikolenko, S., Pham, S., Prjibelski, A. D., et al. (2012) · Journal of Computational Biology · doi:10.1089/cmb.2012.0021 · Cited by 26,312
FastTree 2 – Approximately Maximum-Likelihood Trees for Large Alignments
Price, M. N., Dehal, P. S., & Arkin, A. P. (2010) · PLoS ONE · doi:10.1371/journal.pone.0009490 · Cited by 14,894
BUSCO: assessing genome assembly and annotation completeness with single-copy orthologs
Simão, F. A., Waterhouse, R. M., Ioannidis, P., Kriventseva, E. V., & Zdobnov, E. M. (2015) · Bioinformatics · doi:10.1093/bioinformatics/btv351 · Cited by 13,344
QUAST: quality assessment tool for genome assemblies
Gurevich, A., Saveliev, V., Vyahhi, N., & Tesler, G. (2013) · Bioinformatics · doi:10.1093/bioinformatics/btt086 · Cited by 11,172
UFBoot2: Improving the Ultrafast Bootstrap Approximation
Hoang, D. T., Chernomor, O., von Haeseler, A., Minh, B. Q., & Vinh, L. S. (2018) · Molecular Biology and Evolution · doi:10.1093/molbev/msx281 · Cited by 10,881
Haas, B. J., Papanicolaou, A., Yassour, M., Grabherr, M., Blood, P. D., Bowden, J., Couger, M. B., Eccles, D., Li, B., Lieber, M., et al. (2013) · Nature Protocols · doi:10.1038/nprot.2013.084 · Cited by 8,464
Emms, D. M., & Kelly, S. (2015) · Genome Biology · doi:10.1186/s13059-015-0721-2 · Cited by 3,408
Animals in a bacterial world, a new imperative for the life sciences
McFall‐Ngai, M., Hadfield, M. G., Bosch, T. C. G., Carey, H. V., Domazet‐Lošo, T., Douglas, A. E., Dubilier, N., Eberl, G., Fukami, T., Gilbert, S. F., et al. (2013) · Proceedings of the National Academy of Sciences · doi:10.1073/pnas.1218525110 · Cited by 2,879
Self-citationBroad phylogenomic sampling improves resolution of the animal tree of life
Dunn, C. W., Hejnol, A., Matus, D. Q., Pang, K., Browne, W. E., Smith, S. A., Seaver, E., Rouse, G. W., Obst, M., Edgecombe, G. D., et al. (2008) · Nature · doi:10.1038/nature06614 · Cited by 1,921 · cited 3×
“However, this effort also revealed a surprisingly bilaterian-like (Dunn et al., 2015) developmen- tal gene toolkit in placozoans, a paradox for such a simple animal.”
BackgroundInfluentialSelf-citationSea Anemone Genome Reveals Ancestral Eumetazoan Gene Repertoire and Genomic Organization
Putnam, N. H., Srivastava, M., Hellsten, U., Dirks, B., Chapman, J., Salamov, A., Terry, A., Shapiro, H., Lindquist, E., Kapitonov, V. V., et al. (2007) · Science · doi:10.1126/science.1139158 · Cited by 1,555
A Bayesian Mixture Model for Across-Site Heterogeneities in the Amino-Acid Replacement Process
Lartillot, N., & Philippe, H. (2004) · Molecular Biology and Evolution · doi:10.1093/molbev/msh112 · Cited by 1,516
Erwin, D. H., Laflamme, M., Tweedt, S. M., Sperling, E. A., Pisani, D., & Peterson, K. J. (2011) · Science · doi:10.1126/science.1206375 · Cited by 1,336 · cited 1×
“, 2017) and molecular clock estimates (Cunningham et al., 2017; dos Reis et al., 2015; Dohrmann and Wörheide, 2017; Erwin et al., 2011) may require reexamination.”
BackgroundBRAKER1: Unsupervised RNA-Seq-Based Genome Annotation with GeneMark-ET and AUGUSTUS
Hoff, K. J., Lange, S., Lomsadze, A., Borodovsky, M. Y., & Stanke, M. (2015) · Bioinformatics · doi:10.1093/bioinformatics/btv661 · Cited by 1,138
Gene prediction in novel fungal genomes using an ab initio algorithm with unsupervised trainingPreprint
Ter-Hovhannisyan, V., Lomsadze, A., Chernoff, Y. O., & Borodovsky, M. Y. (2008) · Genome Research · doi:10.1101/gr.081612.108 · Cited by 1,029
The Trichoplax genome and the nature of placozoans
Srivastava, M., Begovic, E., Chapman, J., Putnam, N. H., Hellsten, U., Kawashima, T., Kuo, A., Mitros, T., Salamov, A., Carpenter, M. L., et al. (2008) · Nature · doi:10.1038/nature07191 · Cited by 889
Lartillot, N., Rodrigue, N., Stubbs, D., & Richer, J. (2013) · Systematic Biology · doi:10.1093/sysbio/syt022 · Cited by 871 · cited 5×
“(Blanquart and Lartillot, 2008; Foster, 2004; Lartillot and Philippe, 2004; Lartillot et al., 2013).”
InfluentialAssessing the root of bilaterian animals with scalable phylogenomic methods
Hejnol, A., Obst, M., Stamatakis, A., Ott, M., Rouse, G. W., Edgecombe, G. D., Martinez, P., Baguñà, J., Bailly, X., Jondelius, U., et al. (2009) · Proceedings of the Royal Society B: Biological Sciences · doi:10.1098/rspb.2009.0896 · Cited by 747 · cited 1×
“…lined epithelia (Fidler et al., 2017; Leys and Riesgo, 2012), musculature (Steinmetz et al., 2012), embryonic germ-layer organisation (Steinmetz et al., 2017), and internal digestion (Presnell et al., 2016; Putnam et al., 2007; Hejnol and Martindale, 2008; Martindale and Hejnol, 2009).”
Self-citationThe ctenophore genome and the evolutionary origins of neural systems
Moroz, L. L., Kocot, K. M., Citarella, M. R., Dosung, S., Norekian, T. P., Povolotskaya, I. S., Grigorenko, A. P., Dailey, C., Berezikov, E., Buckley, K. M., et al. (2014) · Nature · doi:10.1038/nature13400 · Cited by 716
Phylogenomics Revives Traditional Views on Deep Animal Relationships
Philippe, H., Derelle, R., Lopez, P., Pick, K., Borchiellini, C., Boury-Esnault, N., Vacelet, J., Renard, E., Houliston, E., Quéinnec, E., et al. (2009) · Current Biology · doi:10.1016/j.cub.2009.02.052 · Cited by 695
The Genome of the Ctenophore Mnemiopsis leidyi and Its Implications for Cell Type Evolution
Ryan, J. F., Pang, K., Schnitzler, C. E., Nguyen, A.-D., Moreland, R. T., Simmons, D. K., Koch, B. J., Francis, W. R., Havlak, P., Program, N. C. S., et al. (2013) · Science · doi:10.1126/science.1242592 · Cited by 682
Is H3K4me3 instructive for transcription activation?
Howe, F. S., Fischl, H., Murray, S. C., & Mellor, J. (2016) · BioEssays · doi:10.1002/bies.201600095 · Cited by 533
Contentious relationships in phylogenomic studies can be driven by a handful of genes
Shen, X.-X., Hittinger, C. T., & Rokas, A. (2017) · Nature Ecology & Evolution · doi:10.1038/s41559-017-0126 · Cited by 520
Simion, P., Philippe, H., Baurain, D., Jager, M., Richter, D. J., Di Franco, A., Roure, B., Satoh, N., Quéinnec, É., Ereskovsky, A., et al. (2017) · Current Biology · doi:10.1016/j.cub.2017.02.031 · Cited by 518
BayesHammer: Bayesian clustering for error correction in single-cell sequencing
Nikolenko, S., Korobeynikov, A., & Alekseyev, M. A. (2013) · BMC Genomics · doi:10.1186/1471-2164-14-s1-s7 · Cited by 479
Modeling compositional heterogeneity
Foster, P. G. (2004) · Systematic Biology · doi:10.1080/10635150490445779 · Cited by 474
Uncertainty in the Timing of Origin of Animals and the Limits of Precision in Molecular Timescales
dos Reis, M., Thawornwattana, Y., Angelis, K., Telford, M. J., Donoghue, P. C. J., & Yang, Z. (2015) · Current Biology · doi:10.1016/j.cub.2015.09.066 · Cited by 471
Wang, H.-C., Minh, B. Q., Susko, E., & Roger, A. J. (2018) · Systematic Biology · doi:10.1093/sysbio/syx068 · Cited by 466
Yang, Y. J., & Smith, S. A. (2014) · Molecular Biology and Evolution · doi:10.1093/molbev/msu245 · Cited by 406
Xenacoelomorpha is the sister group to Nephrozoa
Cannon, J. T., Vellutini, B. C., Smith, J., Ronquist, F., Jondelius, U., & Hejnol, A. (2016) · Nature · doi:10.1038/nature16520 · Cited by 364
Empirical profile mixture models for phylogenetic reconstruction
Le, S. Q., Gascuel, O., & Lartillot, N. (2008) · Bioinformatics · doi:10.1093/bioinformatics/btn445 · Cited by 362
Improved phylogenomic taxon sampling noticeably affects nonbilaterian relationships
Pick, K. S., Philippe, H., Schreiber, F., Erpenbeck, D., Jackson, D. J., Wrede, P., Wiens, M., Alie, A., Morgenstern, B., Manuel, M., et al. (2010) · Molecular Biology and Evolution · doi:10.1093/molbev/msq089 · Cited by 334
Error, signal, and the placement of Ctenophora sister to all other animals
Whelan, N. V., Kocot, K. M., Moroz, L. L., & Halanych, K. M. (2015) · Proceedings of the National Academy of Sciences · doi:10.1073/pnas.1503453112 · Cited by 331
Cnidarian Cell Type Diversity and Regulation Revealed by Whole-Organism Single-Cell RNA-Seq
Sebé-Pedrós, A., Saudemont, B., Chomsky, E., Plessier, F., Mailhé, M.-P., Renno, J., Loe-Mie, Y., Lifshitz, A., Mukamel, Z., Schmutz, S., et al. (2018) · Cell · doi:10.1016/j.cell.2018.05.019 · Cited by 330
Genomic data do not support comb jellies as the sister group to all other animals
Pisani, D., Pett, W., Dohrmann, M., Feuda, R., Rota-Stabelli, O., Philippe, H., Lartillot, N., & Wörheide, G. (2015) · Proceedings of the National Academy of Sciences · doi:10.1073/pnas.1518127112 · Cited by 319
Early metazoan cell type diversity and the evolution of multicellular gene regulation
Sebé-Pedrós, A., Chomsky, E., Pang, K., Lara‐Astiaso, D., Gaiti, F., Mukamel, Z., Amit, I., Hejnol, A., Degnan, B. M., & Tanay, A. (2018) · Nature Ecology & Evolution · doi:10.1038/s41559-018-0575-6 · Cited by 301
Improved Modeling of Compositional Heterogeneity Supports Sponges as Sister to All Other Animals
Feuda, R., Dohrmann, M., Pett, W., Philippe, H., Rota-Stabelli, O., Lartillot, N., Wörheide, G., & Pisani, D. (2017) · Current Biology · doi:10.1016/j.cub.2017.11.008 · Cited by 291
From nerve net to nerve ring, nerve cord and brain — evolution of the nervous system
Arendt, D., Tosches, M. A., & Marlow, H. (2016) · Nature Reviews Neuroscience · doi:10.1038/nrn.2015.15 · Cited by 279
Ctenophore relationships and their placement as the sister group to all other animals
Whelan, N. V., Kocot, K. M., Moroz, T. P., Mukherjee, K., Williams, P., Paulay, G., Moroz, L. L., & Halanych, K. M. (2017) · Nature Ecology & Evolution · doi:10.1038/s41559-017-0331-3 · Cited by 263
Deep metazoan phylogeny: When different genes tell different stories
Nosenko, T., Schreiber, F., Adamska, M., Adamski, M., Eitel, M., Hammel, J., Maldonado, M., Müller, W. E. G., Nickel, M., Schierwater, B., et al. (2013) · Molecular Phylogenetics and Evolution · doi:10.1016/j.ympev.2013.01.010 · Cited by 254
Smith, C. L., Varoqueaux, F., Kittelmann, M., Azzam, R. N., Cooper, B., Winters, C. A., Eitel, M., Fasshauer, D., & Reese, T. S. (2014) · Current Biology · doi:10.1016/j.cub.2014.05.046 · Cited by 254
Independent evolution of striated muscles in cnidarians and bilaterians
Steinmetz, P. R. H., Kraus, J. E. M., Larroux, C., Hammel, J. U., Amon-Hassenzahl, A., Houliston, E., Wörheide, G., Nickel, M., Degnan, B. M., & Technau, U. (2012) · Nature · doi:10.1038/nature11180 · Cited by 252
The Binning of Metagenomic Contigs for Microbial Physiology of Mixed Cultures
Strous, M., Kraft, B., Bisdorf, R., & Tegetmeyer, H. E. (2012) · Frontiers in Microbiology · doi:10.3389/fmicb.2012.00410 · Cited by 229
Dating early animal evolution using phylogenomic data
Dohrmann, M., & Wörheide, G. (2017) · Scientific Reports · doi:10.1038/s41598-017-03791-w · Cited by 217
A Site- and Time-Heterogeneous Model of Amino Acid Replacement
Blanquart, S., & Lartillot, N. (2008) · Molecular Biology and Evolution · doi:10.1093/molbev/msn018 · Cited by 217
The hidden biology of sponges and ctenophores
Dunn, C. W., Leys, S. P., & Haddock, S. H. D. (2015) · Trends in Ecology & Evolution · doi:10.1016/j.tree.2015.03.003 · Cited by 212
Accounting For Alignment Uncertainty in Phylogenomics
Wu, M., Chatterji, S., & Eisen, J. A. (2012) · PLoS ONE · doi:10.1371/journal.pone.0030288 · Cited by 206
Collagen IV and basement membrane at the evolutionary dawn of metazoan tissues
Fidler, A. L., Darris, C. E., Chetyrkin, S. V., Pedchenko, V. K., Boudko, S. P., Brown, K. L., Jerome, W. G., Hudson, J. K., Rokas, A., & Hudson, B. G. (2017) · eLife · doi:10.7554/elife.24176 · Cited by 197
A placozoan affinity for Dickinsonia and the evolution of late Proterozoic metazoan feeding modes
Sperling, E. A., & Vinther, J. (2010) · Evolution & Development · doi:10.1111/j.1525-142x.2010.00404.x · Cited by 194
The genome of the jellyfish Clytia hemisphaerica and the evolution of the cnidarian life-cycle
Leclère, L., Horin, C., Chevalier, S., Lapébie, P., Dru, P., Péron, S., Jager, M., Condamine, T., Pottin, K., Romano, S., et al. (2019) · Nature Ecology & Evolution · doi:10.1038/s41559-019-0833-2 · Cited by 189
Nuclear genomic signals of the ‘microturbellarian’ roots of platyhelminth evolutionary innovation
Laumer, C., Hejnol, A., & Giribet, G. (2015) · eLife · doi:10.7554/elife.05503 · Cited by 181
Self-citationAcoel development indicates the independent evolution of the bilaterian mouth and anus
Hejnol, A., & Martindale, M. Q. (2008) · Nature · doi:10.1038/nature07309 · Cited by 179
The origin of animals: Can molecular clocks and the fossil record be reconciled?
Cunningham, J. A., Liu, A. G., Bengtson, S., & Donoghue, P. C. J. (2017) · BioEssays · doi:10.1002/bies.201600120 · Cited by 178
On Reduced Amino Acid Alphabets for Phylogenetic Inference
Susko, E., & Roger, A. J. (2007) · Molecular Biology and Evolution · doi:10.1093/molbev/msm144 · Cited by 177
Independent origins of neurons and synapses: insights from ctenophores
Moroz, L. L., & Kohn, A. B. (2016) · Philosophical Transactions of the Royal Society B: Biological Sciences · doi:10.1098/rstb.2015.0041 · Cited by 171
My favorite animal, Trichoplax adhaerens
Schierwater, B. (2005) · BioEssays · doi:10.1002/bies.20320 · Cited by 161
Serine Codon-Usage Bias in Deep Phylogenomics: Pancrustacean Relationships as a Case Study
Rota-Stabelli, O., Lartillot, N., Philippe, H., & Pisani, D. (2013) · Systematic Biology · doi:10.1093/sysbio/sys077 · Cited by 155
Hidden Likelihood Support in Genomic Data: Can Forty-Five Wrongs Make a Right?
Gatesy, J., & Baker, R. H. (2005) · Systematic Biology · doi:10.1080/10635150590945368 · Cited by 151
Kück, P., & Struck, T. H. (2014) · Molecular Phylogenetics and Evolution · doi:10.1016/j.ympev.2013.09.011 · Cited by 143 · cited 1×
“%) of this gene set is identified as compositionally biased by this test, highlighting the importance of using appropriate statistical tests to control this source of systematic error, rather than applying arbitrary heuristic cutoffs (Kück and Struck, 2014).”
A new perspective on lower metazoan relationships from 18S rDNA sequences
Kim, J., Kim, W., & Cunningham, C. W. (1999) · Molecular Biology and Evolution · doi:10.1093/oxfordjournals.molbev.a026124 · Cited by 143
Cavalier‐Smith, T. (2016) · Philosophical Transactions of the Royal Society B Biological Sciences · doi:10.1098/rstb.2015.0476 · Cited by 142
The phylogenetic position of the comb jellies (Ctenophora) and the importance of taxonomic sampling
Wållberg, A., Thollesson, M., Farris, J. S., & Jondelius, U. (2004) · Cladistics · doi:10.1111/j.1096-0031.2004.00041.x · Cited by 142
Gut-like ectodermal tissue in a sea anemone challenges germ layer homology
Steinmetz, P. R. H., Aman, A. J., Kraus, J. E. M., & Technau, U. (2017) · Nature Ecology & Evolution · doi:10.1038/s41559-017-0285-5 · Cited by 135
A Developmental Perspective: Changes in the Position of the Blastopore during Bilaterian Evolution
Martindale, M. Q., & Hejnol, A. (2009) · Developmental Cell · doi:10.1016/j.devcel.2009.07.024 · Cited by 131
High Cell Diversity and Complex Peptidergic Signaling Underlie Placozoan Behavior
Varoqueaux, F., Williams, E. A., Grandemange, S., Truscello, L., Kamm, K., Schierwater, B., Jékely, G., & Fasshauer, D. (2018) · Current Biology · doi:10.1016/j.cub.2018.08.067 · Cited by 122
On the evolution of bilaterality
Genikhovich, G., & Technau, U. (2017) · Development · doi:10.1242/dev.141507 · Cited by 118
Comparative Genomics of Large Mitochondria in Placozoans
Signorovitch, A. Y., Buss, L. W., & Dellaporta, S. L. (2007) · PLoS Genetics · doi:10.1371/journal.pgen.0030013 · Cited by 115
Neuropeptidergic integration of behavior in Trichoplax adhaerens, an animal without synapses
Senatore, A., Reese, T. S., & Smith, C. L. (2017) · Journal of Experimental Biology · doi:10.1242/jeb.162396 · Cited by 113
Epithelia, an Evolutionary Novelty of Metazoans
Leys, S. P., & Riesgo, A. (2011) · Journal of Experimental Zoology Part B Molecular and Developmental Evolution · doi:10.1002/jez.b.21442 · Cited by 107
Self-citationSelecting informative subsets of sparse supermatrices increases the chance to find correct trees
Misof, B. Y., Meyer, B., von Reumont, B. M., Kück, P., Misof, K., & Meusemann, K. (2013) · BMC Bioinformatics · doi:10.1186/1471-2105-14-348 · Cited by 104
Coordinated Feeding Behavior in Trichoplax, an Animal without Synapses
Smith, C. L., Pivovarova, N., & Reese, T. S. (2015) · PLOS ONE · doi:10.1371/journal.pone.0136098 · Cited by 98
Comparative genomics and the nature of placozoan species
Eitel, M., Francis, W. R., Varoqueaux, F., Daraspe, J., Osigus, H., Krebs, S., Vargas, S., Blum, H., Williams, G. A., Schierwater, B., et al. (2018) · PLoS Biology · doi:10.1371/journal.pbio.2005359 · Cited by 93
Compositional Heterogeneity and Phylogenomic Inference of Metazoan Relationships
Nesnidal, M. P., Helmkampf, M., Bruchhaus, I., & Hausdorf, B. (2010) · Molecular Biology and Evolution · doi:10.1093/molbev/msq097 · Cited by 86
Shen, X., Salichos, L., & Rokas, A. (2016) · Genome Biology and Evolution · doi:10.1093/gbe/evw179 · Cited by 85
Evolution of eumetazoan nervous systems: insights from cnidarians
Kelava, I., Rentzsch, F., & Technau, U. (2015) · Philosophical Transactions of the Royal Society B: Biological Sciences · doi:10.1098/rstb.2015.0065 · Cited by 84
Field biology of placozoans (Trichoplax): distribution, diversity, biotic interactions
Pearse, V. B., & Voigt, O. (2007) · Integrative and Comparative Biology · doi:10.1093/icb/icm015 · Cited by 79
Self-citationGlobal Diversity of the Placozoa
Eitel, M., Osigus, H., DeSalle, R., & Schierwater, B. (2013) · PLoS ONE · doi:10.1371/journal.pone.0057131 · Cited by 79
A New Orthology Assessment Method for Phylogenomic Data: Unrooted Phylogenetic Orthology
Ballesteros, J. A., & Hormiga, G. (2016) · Molecular Biology and Evolution · doi:10.1093/molbev/msw069 · Cited by 74
New Insights into Placozoan Sexual Reproduction and Development
Eitel, M., Guidi, L., Hadrys, H., Balsamo, M., & Schierwater, B. (2011) · PLoS ONE · doi:10.1371/journal.pone.0019639 · Cited by 73
Highly regulated growth and development of the Ediacara macrofossil Dickinsonia costata
Evans, S. D., Droser, M. L., & Gehlîng, J. G. (2017) · PLoS ONE · doi:10.1371/journal.pone.0176874 · Cited by 71
Zhou, X., Lutteropp, S., Czech, L., Stamatakis, A., von Looz, M., & Rokas, A. (2019) · Systematic Biology · doi:10.1093/sysbio/syz058 · Cited by 66
Kristan, W. B. (2016) · Current Biology · doi:10.1016/j.cub.2016.05.030 · Cited by 63
The phylogeography of the Placozoa suggests a taxon-rich phylum in tropical and subtropical waters
Eitel, M., & Schierwater, B. (2010) · Molecular Ecology · doi:10.1111/j.1365-294x.2010.04617.x · Cited by 57
Evolution of Animal Neural Systems
Liebeskind, B. J., Hofmann, H. A., Hillis, D. M., & Zakon, H. H. (2017) · Annual Review of Ecology Evolution and Systematics · doi:10.1146/annurev-ecolsys-110316-023048 · Cited by 55
Getting to the bottom of anal evolution
Hejnol, A., & Martín-Durán, J. M. (2015) · Zoologischer Anzeiger - A Journal of Comparative Zoology · doi:10.1016/j.jcz.2015.02.006 · Cited by 52
Presnell, J. S., Vandepas, L. E., Warren, K. J., Swalla, B. J., Amemiya, C. T., & Browne, W. E. (2016) · Current Biology · doi:10.1016/j.cub.2016.08.019 · Cited by 51
Dayraud, C., Alié, A., Jager, M., Chang, P., Le Guyader, H., Manuel, M., & Quéinnec, E. (2012) · BMC Evolutionary Biology · doi:10.1186/1471-2148-12-107 · Cited by 49
Eibildung und furchung von Trichoplax adhaerens F. E. Schulze (Placozoa)
Grell, K. G. (1972) · Zeitschrift für Morphologie der Tiere · doi:10.1007/bf00391925 · Cited by 47
Syed, T., & Schierwater, B. (2002) · HAL (Le Centre pour la Communication Scientifique Directe) · Cited by 46
Kamm, K., Osigus, H., Stadler, P. F., DeSalle, R., & Schierwater, B. (2018) · Scientific Reports · doi:10.1038/s41598-018-29400-y · Cited by 46
Phylogenetic position of Placozoa based on large subunit (LSU) and small subunit (SSU) rRNA genes
da Silva, F. B., Muschner, V. C., & Bonatto, S. L. (2007) · Genetics and Molecular Biology · doi:10.1590/s1415-47572007000100022 · Cited by 42
DuBuc, T. Q., Bobkov, Y. V., Ryan, J. F., & Martindale, M. Q. (2019) · Molecular Biology and Evolution · doi:10.1093/molbev/msz025 · Cited by 41
Trichoplax adhaerens, nov. gen., nov. spec
Schulze, F. E. (1883) · Biodiversity Heritage Library (Smithsonian Institution) · doi:10.5281/zenodo.13650923 · Cited by 35
A hybrid de novo assembly of the sea pansy ( Renilla muelleri ) genome
Jiang, J., Quattrini, A. M., Francis, W. R., Ryan, J. F., Rodríguez, E., & McFadden, C. S. (2019) · GigaScience · doi:10.1093/gigascience/giz026 · Cited by 32
Transepithelial Cytophagy by Trichoplax adhaerens F. E. Schulze (Placozoa) Feeding on Yeast
Wenderoth, H. (1986) · Zeitschrift für Naturforschung C · doi:10.1515/znc-1986-0316 · Cited by 26
Binning enables efficient host genome reconstruction in cnidarian holobionts
Celis, S., Wibberg, D., Ramírez‐Portilla, C., Rupp, O., Sczyrba, A., Winkler, A., Kalinowski, J., & Wilke, T. (2018) · GigaScience · doi:10.1093/gigascience/giy075 · Cited by 20
Cavalier‐Smith, T. (2017) · Philosophical Transactions of the Royal Society B Biological Sciences · doi:10.1098/rstb.2017.0001 · Cited by 19
Dufour, S. C., & McIlroy, D. (2017) · Philosophical Transactions of the Royal Society B Biological Sciences · doi:10.1098/rstb.2017.0148 · Cited by 17
Inferring Ancient Relationships with Genomic Data: A Commentary on Current Practices
Laumer, C. (2018) · Integrative and Comparative Biology · doi:10.1093/icb/icy075 · Cited by 15
Self-citationCavalier‐Smith, T. (2017) · Philosophical Transactions of the Royal Society B Biological Sciences · doi:10.1098/rstb.2017.0336 · Cited by 6
A taxogenomics approach uncovers a new genus in the phylum PlacozoaPreprint
Eitel, M., Francis, W. R., Osigus, H., Krebs, S., Vargas, S., Blum, H., Williams, G. A., Schierwater, B., & Wörheide, G. (2017) · bioRxiv (Cold Spring Harbor Laboratory) · doi:10.1101/202119 · Cited by 6
Armon, S., Bull, M. S., Aranda-Díaz, A., & Prakash, M. (2018) · bioRxiv (Cold Spring Harbor Laboratory) · doi:10.1101/258103 · Cited by 4
Research works printed but not linked: 3
- Bütschli, 1884, Bemerkungen zur Gastraea-Theorie, Morphologisches Jahrbuch, 9, 415
- Grell, 1971, Die Ultrastruktur Von Trichoplax adhaerens F. E. Schultze, Cytobiologie, 4, 216
- Grell, 1991, Placozoa. in Microscopic Anatomy of Invertebrates
Cited by
Sorted by citations
Revisiting metazoan phylogeny with genomic sampling of all phyla
Laumer, C. E., Fernández, R., Lemer, S., Combosch, D., Kocot, K. M., Riesgo, A., Andrade, S. C. S., Sterrer, W., Sørensen, M. V., & Giribet, G. (2019) · Proceedings of the Royal Society B: Biological Sciences · doi:10.1098/rspb.2019.0831 · Cited by 360
Self-citationIncongruence in the phylogenomics era
Steenwyk, J. L., Li, Y., Zhou, X., Shen, X., & Rokas, A. (2023) · Nature Reviews Genetics · doi:10.1038/s41576-023-00620-x · Cited by 292
Gene gain and loss across the metazoan tree of life
Fernández, R., & Gabaldón, T. (2020) · Nature Ecology & Evolution · doi:10.1038/s41559-019-1069-x · Cited by 165
Ballesteros, J. A., & Sharma, P. P. (2019) · Systematic Biology · doi:10.1093/sysbio/syz011 · Cited by 167
Redmond, A. K., & McLysaght, A. (2021) · Nature Communications · doi:10.1038/s41467-021-22074-7 · Cited by 139
Metadata
- Authors
- Laumer, C. E., Gruber-Vodicka, H., Hadfield, M. G., Pearse, V. B., Riesgo, A., Marioni, J. C., & Giribet, G.
- Affiliations
- European Bioinformatics Institute (GB)
- Max Planck Institute for Marine Microbiology, Bremen, Germany
- University of Hawaiʻi at Mānoa (US)
- University of California, Santa Cruz (US)
- Natural History Museum (GB)
- Harvard University (US)
- Corresponding author
- Laumer, Christopher E
- ORCID
- Venue
- eLife
- Publisher
- eLife Sciences Publications, Ltd
- Published
- 2018-10-30
- Volume
- 7
- ISSN
- 2050-084X (ISSN-L)
- PMC
- PMC6277202
- OpenAlex
- W2898892386
- Cited by
- 112
- References
- 104
- Citations by year
- 2026: 5 · 2025: 11 · 2024: 9 · 2023: 13 · 2022: 13 · 2021: 27 · 2020: 18 · 2019: 14 · 2018: 2
- FWCI
- 11.22
- Type
- journal article
- Language
- en
- Open access
- gold
- doi.org
- Licence
- Locations
- eLife (publishedVersion, cc-by)
- bioRxiv (Cold Spring Harbor Laboratory) (acceptedVersion, cc-by-nc)
- Europe PMC (PubMed Central) (publishedVersion, cc-by)
- PubMed Central (publishedVersion, cc-by)
- PubMed (publishedVersion)
- DOAJ (DOAJ: Directory of Open Access Journals) (submittedVersion, cc-by-sa)
- MPG.PuRe (Max Planck Society) (submittedVersion, other-oa)
- Apollo (University of Cambridge) (submittedVersion, cc-by)
- Apollo (cc-by)
- Funders
- Max-Planck-Institut fuer Marine Microbiologie
- European Bioinformatics Institute
- Harvard University (Faculty of Arts and Sciences)
- Topics
- Life Sciences › Agricultural and Biological Sciences › Animal Science and Zoology › Marine Invertebrate Physiology and Ecology
- Life Sciences › Biochemistry, Genetics and Molecular Biology › Molecular Biology › Genomics and Phylogenetic Studies
- Life Sciences › Agricultural and Biological Sciences › Ecology, Evolution, Behavior and Systematics › Protist diversity and phylogeny
- Keywords
- Placozoa, Cnidaria, animal phylogeny, compositional heterogeneity, early animal evolution, sister group relationships
- MeSH terms
- Animals, Base Composition, Bayes Theorem, Cnidaria, Models, Genetic, Phylogeny, Bias, Likelihood Functions, Metagenome, Placozoa
About these checks
Registry, retraction, Cites and statistics results are computed, not judged, with one exception: a printed reference that no index lists is read once by a model before it counts as a citation error. Claims are extracted by a model and kept only when their quote appears verbatim in the text; each cited source is then checked, with a model’s help, for whether it says what the claim relies on. Those verdicts can be wrong — read the claim’s quote and the cited source before relying on one.
Statistics and arithmetic are recomputed, not judged.
Confidence bands are shown only for fields calibrated on our annotated test set. None is calibrated yet, so no band is shown.
What counts as a claim ›How we measure confidence ›How we check this ›
Are you an author, or do you see a problem with this page? Request a review
