Cited by 259

The DOI matches its Crossref record; 18 of the 18 references it cites were found in a registry or an index.

Genomics of 1 million parent lifespans implicates novel pathways and common diseases and distinguishes survival chances

Timmers, Paul RHJ, Mounier, Ninon, Lall, Kristi, Fischer, Krista, Ning, Zheng, Feng, Xiao, Bretherick, Andrew D, Clark, David W, eQTLGen Consortium, Agbessi, M, Ahsan, H, Alves, I, Andiappan, A, Awadalla, P, Battle, A, Bonder, MJ, Boomsma, D, Christiansen, M, Claringbould, A, Deelen, P, van Dongen, J, Esko, T, Favé, M, Franke, L, Frayling, T, Gharib, SA, Gibson, G, Hemani, G, Jansen, R, Kalnapenkis, A, Kasela, S, Kettunen, J, Kim, Y, Kirsten, H, Kovacs, P, Krohn, K, Kronberg-Guzman, J, Kukushkina, V, Kutalik, Z, Kähönen, M, Lee, B, Lehtimäki, T, Loeffler, M, Marigorta, U, Metspalu, A, van Meurs, J, Milani, L, Müller-Nurasyid, M, Nauck, M, Nivard, M, Penninx, B, Perola, M, Pervjakova, N, Pierce, B, Powell, J, Prokisch, H, Psaty, BM, Raitakari, O, Ring, S, Ripatti, S, Rotzschke, O, Ruëger, S, Saha, A, Scholz, M, Schramm, K, Seppälä, I, Stumvoll, M, Sullivan, P, Teumer, A, Thiery, J, Tong, L, Tönjes, A, Verlouw, J, Visscher, PM, Võsa, U, Völker, U, Yaghootkar, H, Yang, J, Zeng, B, Zhang, F, Agbessi, M, Ahsan, H, Alves, I, Andiappan, A, Awadalla, P, Battle, A, Bonder, MJ, Boomsma, D, Christiansen, M, Claringbould, A, Deelen, P, van Dongen, J, Esko, T, Favé, M, Franke, L, Frayling, T, Gharib, SA, Gibson, G, Hemani, G, Jansen, R, Kalnapenkis, A, Kasela, S, Kettunen, J, Kim, Y, Kirsten, H, Kovacs, P, Krohn, K, Kronberg-Guzman, J, Kukushkina, V, Kutalik, Z, Kähönen, M, Lee, B, Lehtimäki, T, Loeffler, M, Marigorta, U, Metspalu, A, van Meurs, J, Milani, L, Müller-Nurasyid, M, Nauck, M, Nivard, M, Penninx, B, Perola, M, Pervjakova, N, Pierce, B, Powell, J, Prokisch, H, Psaty, BM, Raitakari, O, Ring, S, Ripatti, S, Rotzschke, O, Ruëger, S, Saha, A, Scholz, M, Schramm, K, Seppälä, I, Stumvoll, M, Sullivan, P, Teumer, A, Thiery, J, Tong, L, Tönjes, A, Verlouw, J, Visscher, PM, Võsa, U, Völker, U, Yaghootkar, H, Yang, J, Zeng, B, Zhang, F, Shen, Xia, Esko, Tõnu, Kutalik, Zoltán, Wilson, James F, Joshi, Peter K·2019·eLife

Abstract

We use a genome-wide association of 1 million parental lifespans of genotyped subjects and data on mortality risk factors to validate previously unreplicated findings near CDKN2B-AS1, ATXN2/BRAP, FURIN/FES, ZW10, PSORS1C3, and 13q21.31, and identify and replicate novel findings near ABO, ZC3HC1, and IGF2R. We also validate previous findings near 5q33.3/EBF1 and FOXO3, whilst finding contradictory evidence at other loci. Gene set and cell-specific analyses show that expression in foetal brain cells and adult dorsolateral prefrontal cortex is enriched for lifespan variation, as are gene pathways involving lipid proteins and homeostasis, vesicle-mediated transport, and synaptic function. Individual genetic variants that increase dementia, cardiovascular disease, and lung cancer – but not other cancers – explain the most variance. Resulting polygenic scores show a mean lifespan difference of around five years of life across the deciles. Editorial note: This article has been through an editorial process in which the authors decide how to respond to the issues raised during peer review. The Reviewing Editor's assessment is that all the issues have been addressed (see decision letter).

Overview

The claims and statistics of this paper haven’t been checked yet.

Run the check — free, no account needed. It reads the open-access text and checks the sources it cites.

A few free checks a day · papers already verified open instantly · results are public

Integrity signals

Registry

Crossref · 10.7554/elife.39856

Cites

18 of 18 references verified0 citation errors · 0 not checkable

Statistics

Figures

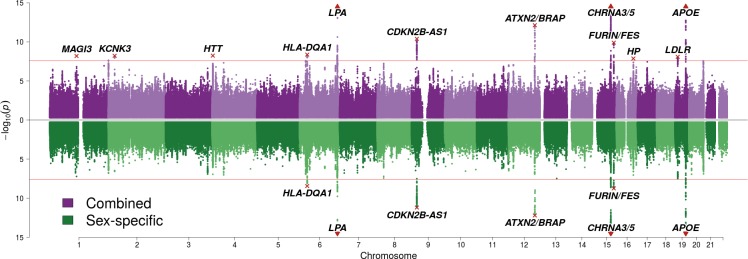
Figure 1. SNP associations with lifespan across both parents under the assumption of common and sex-specific effect sizes. Miami plot of genetic associations with joint parental survival. In purple are the associations under the assumption of common SNP effect sizes across sexes (CES); in green are the associations under the assumption of sex-specific effect sizes (SSE). P refers to the two-sided P values for association of allelic dosage on survival under the residualised Cox model. The red line represents our multiple testing-adjusted genome-wide significance threshold (p = 2.5 × 10⁻⁸). Annotated are the gene, set of genes, or cytogenetic band near the index SNP, marked in red. P values have been capped at –log10(p) = 15 to better visualise associations close to genome-wide significance. SNPs with P values beyond this cap (near APOE, CHRNA3/5 and LPA) are represented by triangles.
Figure 1. SNP associations with lifespan across both parents under the assumption of common and sex-specific effect sizes. Miami plot of genetic associations with joint parental survival. In purple are the associations under the assumption of common SNP effect sizes across sexes (CES); in green are the associations under the assumption of sex-specific effect sizes (SSE). P refers to the two-sided P values for association of allelic dosage on survival under the residualised Cox model. The red line represents our multiple testing-adjusted genome-wide significance threshold (p = 2.5 × 10⁻⁸). Annotated are the gene, set of genes, or cytogenetic band near the index SNP, marked in red. P values have been capped at –log10(p) = 15 to better visualise associations close to genome-wide significance. SNPs with P values beyond this cap (near APOE, CHRNA3/5 and LPA) are represented by triangles.CC BY · PubMed Central
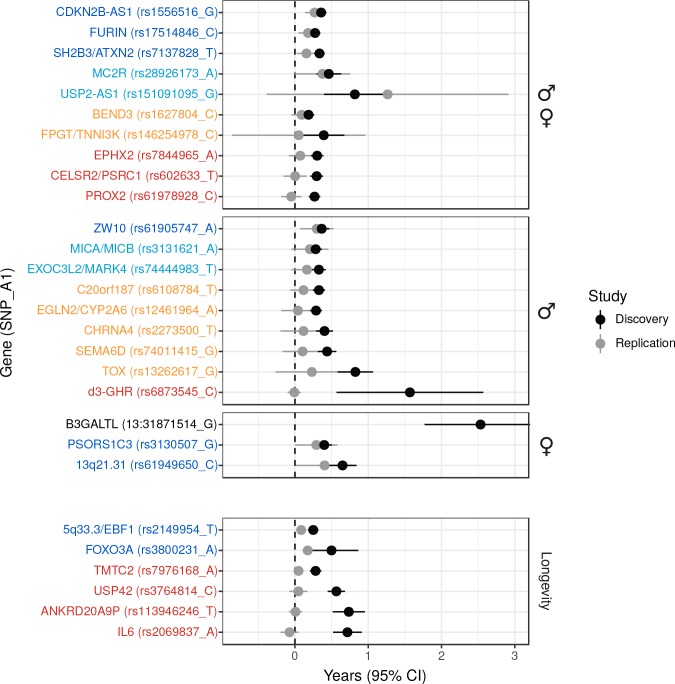
Figure 2. Validation of SNPs identified in other studies using independent samples of European descent. Discovery – Candidate SNPs or proxies (r2 > 0.95) associated with lifespan (top panels, stratified by sex) and longevity (bottom panel) by previous studies (Zeng et al., 2016; Pilling et al., 2017; Deelen et al., 2014; Flachsbart et al., 2009; Sebastiani et al., 2017; Ben-Avraham et al., 2017). Effect sizes have been rescaled to years of life to make direct comparisons between studies (see Materials and methods and Figure 2—figure supplement 1). Replication – Independent samples, either the LifeGen meta-analysis to replicate Pilling et al. (2017), or the full dataset including UK Biobank. Gene names are as reported by discovery and have been coloured based on overlap between confidence intervals (CIs) of effect estimates. Dark blue – Nominal replication (p < 0.05, one-sided test). Light blue – CIs overlap (Phet > 0.05) and cover zero, but replication estimate is closer to discovery than zero. Yellow – CIs overlap (Phet > 0.05) and cover zero, and replication estimate is closer to zero than discovery. Red – CIs do not overlap (Phet < 0.05) and replication estimate covers zero. Black – no replication data.
Figure 2. Validation of SNPs identified in other studies using independent samples of European descent. Discovery – Candidate SNPs or proxies (r2 > 0.95) associated with lifespan (top panels, stratified by sex) and longevity (bottom panel) by previous studies (Zeng et al., 2016; Pilling et al., 2017; Deelen et al., 2014; Flachsbart et al., 2009; Sebastiani et al., 2017; Ben-Avraham et al., 2017). Effect sizes have been rescaled to years of life to make direct comparisons between studies (see Materials and methods and Figure 2—figure supplement 1). Replication – Independent samples, either the LifeGen meta-analysis to replicate Pilling et al. (2017), or the full dataset including UK Biobank. Gene names are as reported by discovery and have been coloured based on overlap between confidence intervals (CIs) of effect estimates. Dark blue – Nominal replication (p < 0.05, one-sided test). Light blue – CIs overlap (Phet > 0.05) and cover zero, but replication estimate is closer to discovery than zero. Yellow – CIs overlap (Phet > 0.05) and cover zero, and replication estimate is closer to zero than discovery. Red – CIs do not overlap (Phet < 0.05) and replication estimate covers zero. Black – no replication data.CC BY · PubMed Central
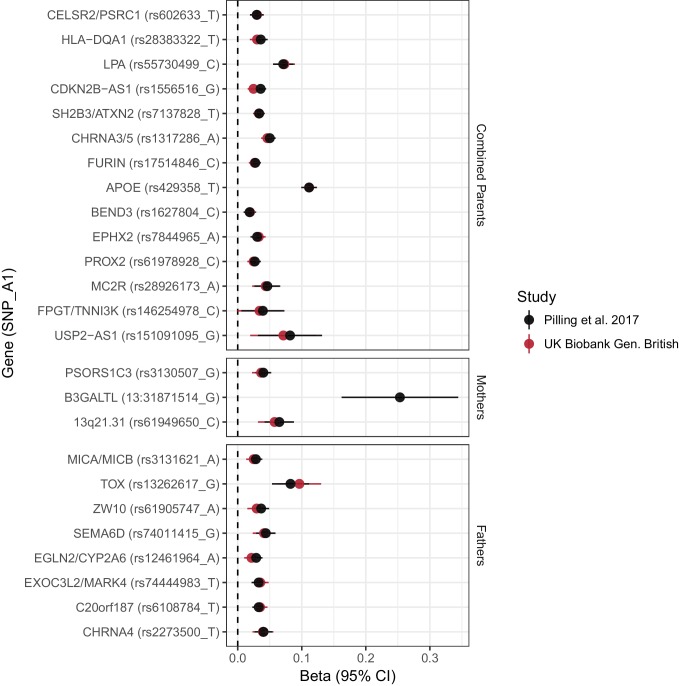
Figure 2—figure supplement 1. Concordance between inferred effect sizes from Pilling et al. (2017) and our estimated effect sizes in a largely overlapping UK Biobank sample. Effect estimates from Pilling et al. (2017) were converted to loge(protection ratio) based solely on the proportion dead in individual parental samples, or (for combined parents results) based on an empirical conversion factor from APOE (see Materials and methods). By definition, the inferred effect estimate for APOE in combined parents is identical between the studies; all other estimates provide a measure of concordance between inferred and calculated effects for each locus. Gene names are as reported by discovery. Note, rs161091095 near USP2–AS1 is a proxy (r2 = 1.00) for rs139137459, the SNP reported by Pilling et al. No proxies could be found for 13:31871514_T_G. Gene – Nearby gene(s) as reported by discovery. SNP – rsID of SNP or proxy. A1 – Longevity allele. Beta - the estimated loge(protection ratio) for one copy of the effect allele. CI – Confidence Interval.
Figure 2—figure supplement 1. Concordance between inferred effect sizes from Pilling et al. (2017) and our estimated effect sizes in a largely overlapping UK Biobank sample. Effect estimates from Pilling et al. (2017) were converted to loge(protection ratio) based solely on the proportion dead in individual parental samples, or (for combined parents results) based on an empirical conversion factor from APOE (see Materials and methods). By definition, the inferred effect estimate for APOE in combined parents is identical between the studies; all other estimates provide a measure of concordance between inferred and calculated effects for each locus. Gene names are as reported by discovery. Note, rs161091095 near USP2–AS1 is a proxy (r2 = 1.00) for rs139137459, the SNP reported by Pilling et al. No proxies could be found for 13:31871514_T_G. Gene – Nearby gene(s) as reported by discovery. SNP – rsID of SNP or proxy. A1 – Longevity allele. Beta - the estimated loge(protection ratio) for one copy of the effect allele. CI – Confidence Interval.CC BY · PubMed Central
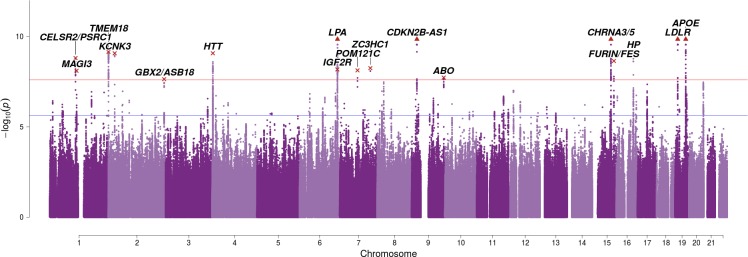
Figure 3. SNP associations with lifespan across both parents when taking into account prior information on mortality risk factors. Bayesian iGWAS was performed using observed associations from the lifespan GWAS and priors based on 16 traits selected by an AIC-based stepwise model. As the P values were assigned empirically using a permutation approach, the minimum P value is limited by the number of permutations; SNPs reaching this limit are represented by triangles. Annotated are the gene, cluster of genes, or cytogenetic band in close proximity to the top SNP. The red line represents the genome-wide significance threshold (p = 2.5 × 10⁻⁸). The blue line represents the 1% FDR threshold. Figure 3—figure supplement 1 shows the associations of each genome-wide significant SNP with the 16 risk factors.
Figure 3. SNP associations with lifespan across both parents when taking into account prior information on mortality risk factors. Bayesian iGWAS was performed using observed associations from the lifespan GWAS and priors based on 16 traits selected by an AIC-based stepwise model. As the P values were assigned empirically using a permutation approach, the minimum P value is limited by the number of permutations; SNPs reaching this limit are represented by triangles. Annotated are the gene, cluster of genes, or cytogenetic band in close proximity to the top SNP. The red line represents the genome-wide significance threshold (p = 2.5 × 10⁻⁸). The blue line represents the 1% FDR threshold. Figure 3—figure supplement 1 shows the associations of each genome-wide significant SNP with the 16 risk factors.CC BY · PubMed Central
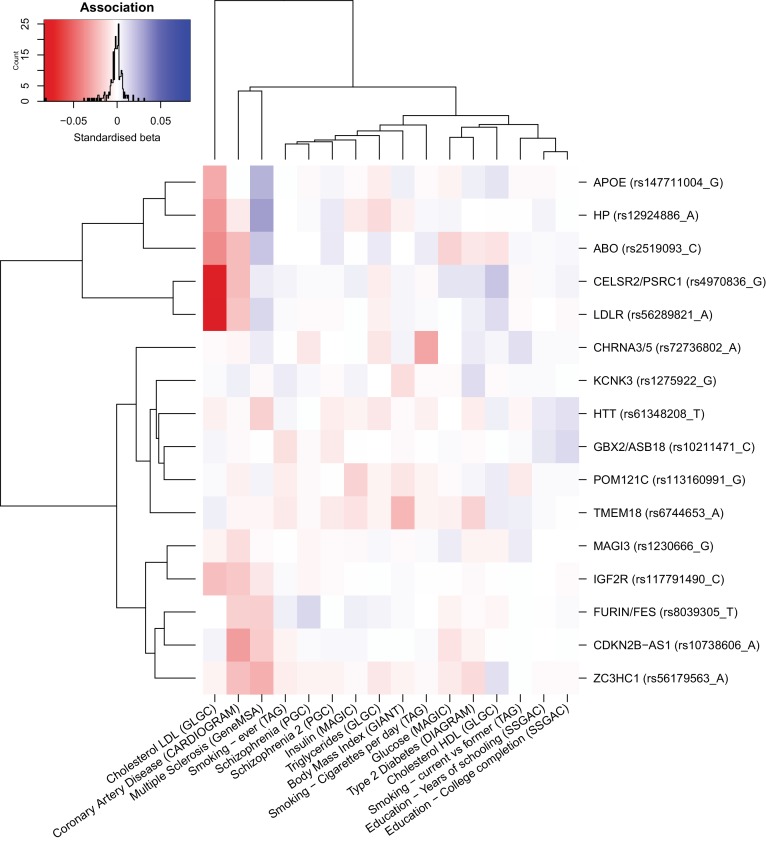
Figure 3—figure supplement 1. Heat map of the effect of genome-wide significant iGWAS SNPs on the mortality risk factors. We looked up the effects of lifespan protecting alleles identified by iGWAS in the consortium GWAMA for all risk factors significantly associated with lifespan in univariate analysis (for studies tested see Materials and methods). We kept all traits univariately associated with lifespan to allow for the presence of potentially correlated traits, not significant in the multivariate analysis. In the iGWAS analysis, Z-scores (estimated effect divided by standard error) are used, but for comparison purposes, standardised betas (Z-score divided by square root of the sample size) were calculated for each risk factor at every SNP and represented in this figure. Both SNPs and traits were clustered for similarity. For example, we can see that almost all iGWAS alleles identified as protective for lifespan are exhibiting negative standardized betas in the coronary artery disease (CAD) association study, confirming the hypothesis that CAD is negatively affecting lifespan. We can also notice that some SNPs are strongly associated with some risk factors (APOE and LDR with lipids traits or CDKN2B-AS1 with CAD) and likely influence lifespan through their effect on these traits. However, some other SNPs (KCNK3 and HTT for example) are showing moderate effects on several risk factors and are probably affecting lifespan through pleiotropic effects.
Figure 3—figure supplement 1. Heat map of the effect of genome-wide significant iGWAS SNPs on the mortality risk factors. We looked up the effects of lifespan protecting alleles identified by iGWAS in the consortium GWAMA for all risk factors significantly associated with lifespan in univariate analysis (for studies tested see Materials and methods). We kept all traits univariately associated with lifespan to allow for the presence of potentially correlated traits, not significant in the multivariate analysis. In the iGWAS analysis, Z-scores (estimated effect divided by standard error) are used, but for comparison purposes, standardised betas (Z-score divided by square root of the sample size) were calculated for each risk factor at every SNP and represented in this figure. Both SNPs and traits were clustered for similarity. For example, we can see that almost all iGWAS alleles identified as protective for lifespan are exhibiting negative standardized betas in the coronary artery disease (CAD) association study, confirming the hypothesis that CAD is negatively affecting lifespan. We can also notice that some SNPs are strongly associated with some risk factors (APOE and LDR with lipids traits or CDKN2B-AS1 with CAD) and likely influence lifespan through their effect on these traits. However, some other SNPs (KCNK3 and HTT for example) are showing moderate effects on several risk factors and are probably affecting lifespan through pleiotropic effects.CC BY · PubMed Central
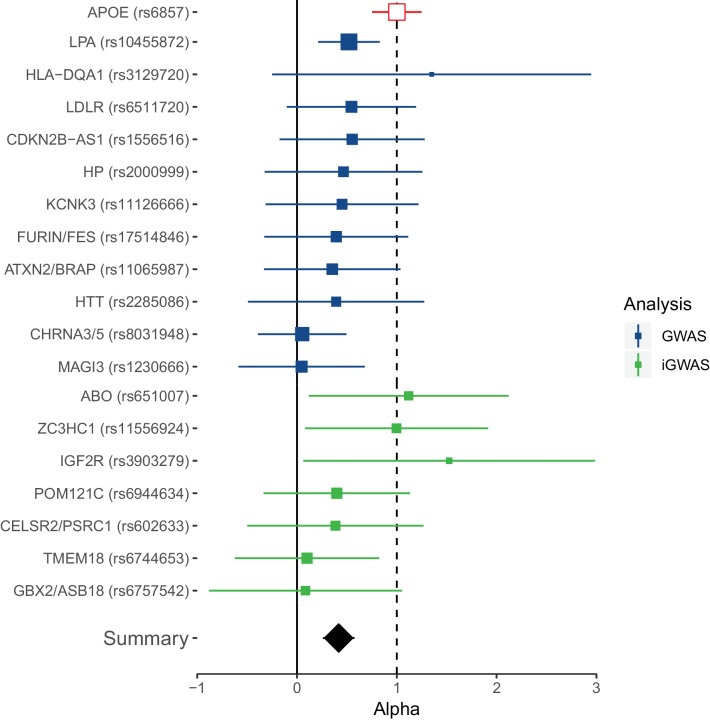
Figure 4. Collective replication of individual lifespan SNPs using GWAMAs for extreme long-livedness shows directional consistency in all cases. Forest plot of effect size ratios between genome-wide significant lifespan variants from our study and external longevity studies (Broer et al., 2015; Deelen et al., 2014), having converted longevity effect sizes to our scale using APOE as benchmark (see Materials and methods and Figure 4—source data 1). Alpha – ratio of replication to discovery effect sizes on the common scale and 95% CI (reflecting uncertainty in the numerator and denominator; P values are for one-sided test). A true (rather than estimated) ratio of 1 indicates the relationship between SNP effect on lifetime hazard and extreme longevity is the same as that of APOE, while a ratio of zero suggests no effect on longevity. A true ratio between 0 and 1 suggests a stronger effect on lifetime hazard than longevity relative to APOE. SNPs overlapping both 0 and 1 are individually underpowered. The inverse variance meta-analysis of alpha over all SNPs, excluding APOE, is 0.42 (95% 0.23 to 0.61; p = 1.35 × 10⁻⁵) for H0 alpha = 0.
Figure 4. Collective replication of individual lifespan SNPs using GWAMAs for extreme long-livedness shows directional consistency in all cases. Forest plot of effect size ratios between genome-wide significant lifespan variants from our study and external longevity studies (Broer et al., 2015; Deelen et al., 2014), having converted longevity effect sizes to our scale using APOE as benchmark (see Materials and methods and Figure 4—source data 1). Alpha – ratio of replication to discovery effect sizes on the common scale and 95% CI (reflecting uncertainty in the numerator and denominator; P values are for one-sided test). A true (rather than estimated) ratio of 1 indicates the relationship between SNP effect on lifetime hazard and extreme longevity is the same as that of APOE, while a ratio of zero suggests no effect on longevity. A true ratio between 0 and 1 suggests a stronger effect on lifetime hazard than longevity relative to APOE. SNPs overlapping both 0 and 1 are individually underpowered. The inverse variance meta-analysis of alpha over all SNPs, excluding APOE, is 0.42 (95% 0.23 to 0.61; p = 1.35 × 10⁻⁵) for H0 alpha = 0.CC BY · PubMed Central
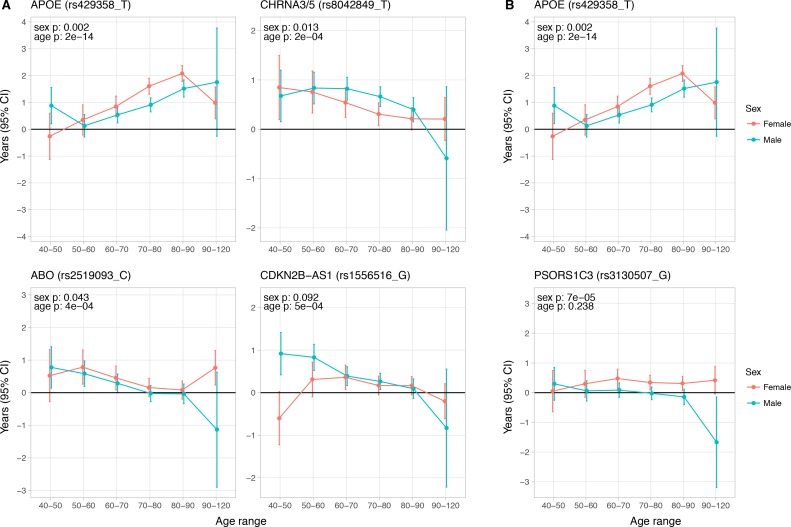
Figure 5. Age and sex specific effects on parent survival for 5 variants showing 5% FDR age- or sex-specificity of effect size from 23 lifespan-increasing variants. (A) Variants showing age-specific effects; (B) Variants showing sex-specific effects. Panel titles show the gene, cluster of genes, or cytogenetic band in close proximity to the index lifespan variant, with this variant and lifespan-increasing allele in parentheses. Beta – loge(protection ratio) for 1 copy of effect allele in self in the age band (i.e. 2 x observed due to 50% kinship). Note the varying scale of y-axis across panels. Age range: the range of ages over which beta was estimated. Sex p – nominal P value for association of effect size with sex. Age p – nominal P value for association of effect size with age.
Figure 5. Age and sex specific effects on parent survival for 5 variants showing 5% FDR age- or sex-specificity of effect size from 23 lifespan-increasing variants. (A) Variants showing age-specific effects; (B) Variants showing sex-specific effects. Panel titles show the gene, cluster of genes, or cytogenetic band in close proximity to the index lifespan variant, with this variant and lifespan-increasing allele in parentheses. Beta – loge(protection ratio) for 1 copy of effect allele in self in the age band (i.e. 2 x observed due to 50% kinship). Note the varying scale of y-axis across panels. Age range: the range of ages over which beta was estimated. Sex p – nominal P value for association of effect size with sex. Age p – nominal P value for association of effect size with age.CC BY · PubMed Central
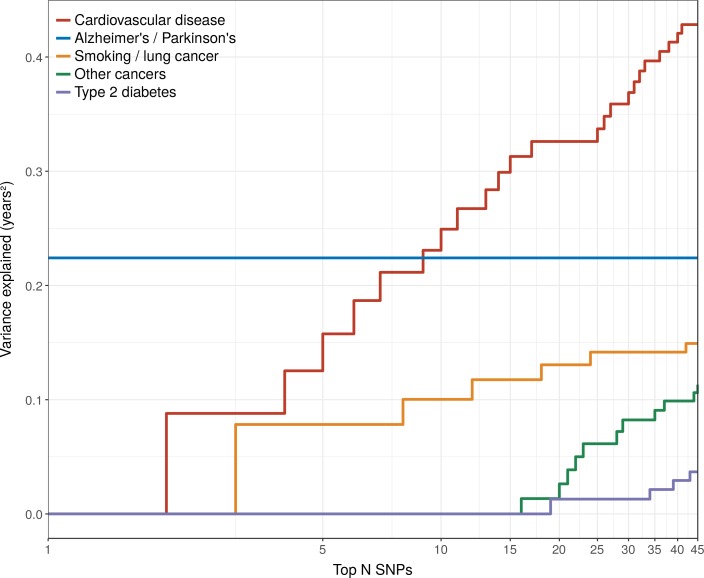
Figure 6. Disease loci explaining the most lifespan variance are protective for neurological disease, cardiovascular disease, and lung cancer. SNPs reported as genome-wide significant for disease in European population studies, ordered by their lifespan variance explained (LVE), show the cumulative effect of disease SNPs on variation in lifespan. An FDR cut-off of 1.55% is applied simultaneously across all diseases, allowing for one false positive association with lifespan among the 45 independent loci. Note the log scale on the X axis. Cardiovascular disease – SNPs associated with cardiovascular disease or myocardial infarction. Alzheimer's/Parkinson's – SNPs associated with Alzheimer’s disease or Parkinson’s disease. Smoking/lung cancer – SNPs associated with smoking behaviour, chronic obstructive pulmonary disease and lung adenocarcinomas. Other cancers – SNPs associated with cancers other than lung cancer (see Figure 7—source data 1 for a full list). Type 2 diabetes – SNPs associated with type 2 diabetes.
Figure 6. Disease loci explaining the most lifespan variance are protective for neurological disease, cardiovascular disease, and lung cancer. SNPs reported as genome-wide significant for disease in European population studies, ordered by their lifespan variance explained (LVE), show the cumulative effect of disease SNPs on variation in lifespan. An FDR cut-off of 1.55% is applied simultaneously across all diseases, allowing for one false positive association with lifespan among the 45 independent loci. Note the log scale on the X axis. Cardiovascular disease – SNPs associated with cardiovascular disease or myocardial infarction. Alzheimer's/Parkinson's – SNPs associated with Alzheimer’s disease or Parkinson’s disease. Smoking/lung cancer – SNPs associated with smoking behaviour, chronic obstructive pulmonary disease and lung adenocarcinomas. Other cancers – SNPs associated with cancers other than lung cancer (see Figure 7—source data 1 for a full list). Type 2 diabetes – SNPs associated with type 2 diabetes.CC BY · PubMed Central
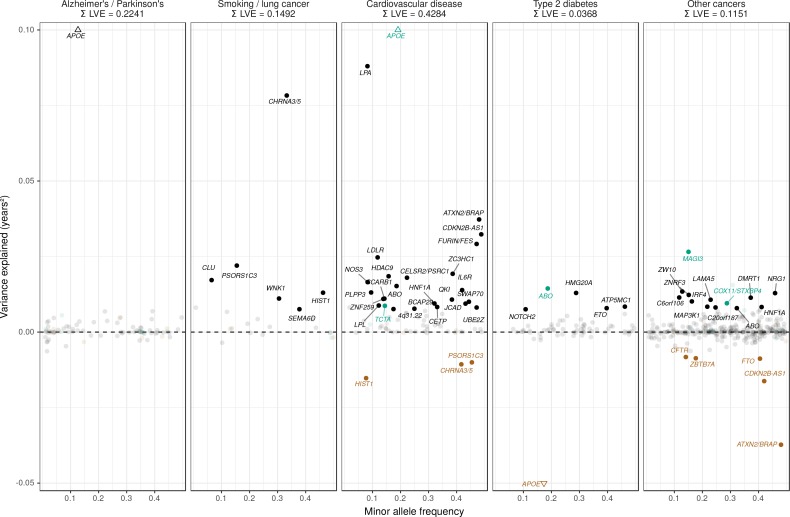
Figure 7. Lifespan variance explained by individual genome-wide significant disease SNPs within disease categories. Genome-wide significant disease SNPs from the GWAS catalog are plotted against the amount of lifespan variance explained (LVE), with disease-protective alleles signed positively when increasing lifespan and signed negatively when decreasing lifespan. SNPs with limited evidence of an effect on lifespan are greyed out: an FDR cut-off of 1.55% is applied simultaneously across all diseases, allowing for one false positive among all significant SNPs. Secondary pleiotropic SNPs (i.e. those associating more strongly with another one of the diseases, as assessed by PheWAS in UK Biobank) are coloured to indicate the main effect on increased lifespan seems to arise elsewhere. Of these, turquoise SNPs show one or more alternative disease associations in the same direction and at least twice as strong (double Z statistic – see Detailed Materials and methods) as the principal disease, while brown SNPs show one or more significant associations with alternative disease in the opposite direction that explains the negative association of the disease-protective SNP with lifespan. The variance explained by all SNPs in black is summed (∑LVE) by disease. Annotated are the gene, cluster of genes, or cytogenetic band near the lead SNPs. The Y axis has been capped to aid legibility of SNPs with smaller LVE: SNPs near APOE pass this cap and are represented by triangles. See Figure 7—source data 1 for the full list of disease SNP associations.
Figure 7. Lifespan variance explained by individual genome-wide significant disease SNPs within disease categories. Genome-wide significant disease SNPs from the GWAS catalog are plotted against the amount of lifespan variance explained (LVE), with disease-protective alleles signed positively when increasing lifespan and signed negatively when decreasing lifespan. SNPs with limited evidence of an effect on lifespan are greyed out: an FDR cut-off of 1.55% is applied simultaneously across all diseases, allowing for one false positive among all significant SNPs. Secondary pleiotropic SNPs (i.e. those associating more strongly with another one of the diseases, as assessed by PheWAS in UK Biobank) are coloured to indicate the main effect on increased lifespan seems to arise elsewhere. Of these, turquoise SNPs show one or more alternative disease associations in the same direction and at least twice as strong (double Z statistic – see Detailed Materials and methods) as the principal disease, while brown SNPs show one or more significant associations with alternative disease in the opposite direction that explains the negative association of the disease-protective SNP with lifespan. The variance explained by all SNPs in black is summed (∑LVE) by disease. Annotated are the gene, cluster of genes, or cytogenetic band near the lead SNPs. The Y axis has been capped to aid legibility of SNPs with smaller LVE: SNPs near APOE pass this cap and are represented by triangles. See Figure 7—source data 1 for the full list of disease SNP associations.CC BY · PubMed Central
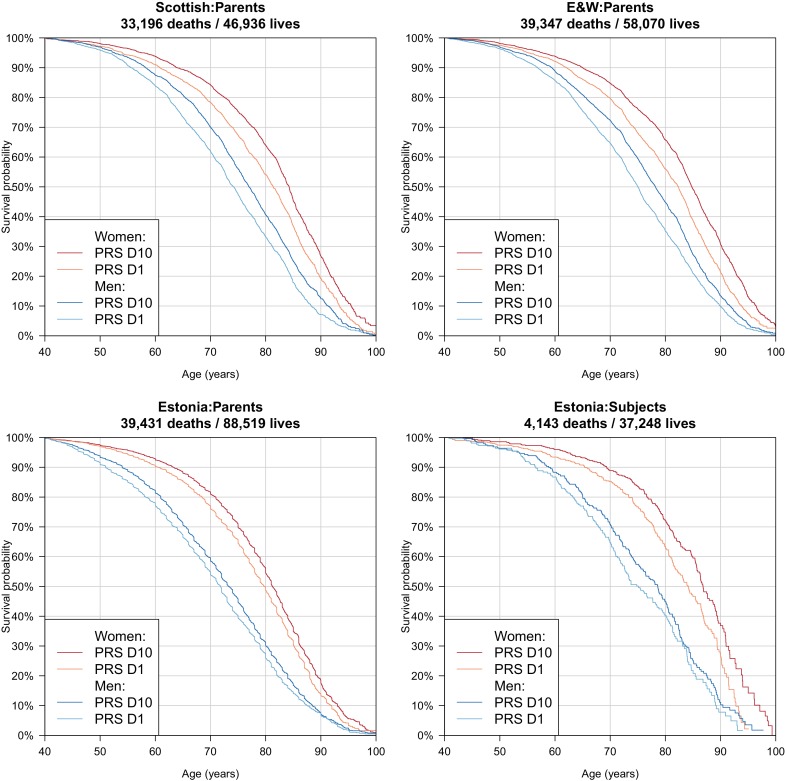
Figure 8. Survival curves for highest and lowest deciles of lifespan polygenic risk score. A polygenic risk score was made for each subject using GWAS results that did not include the subject sets under consideration. Subject or parent survival information (age entry, age exit, age of death (if applicable) was used to create Kaplan-Meier curves for the top and bottom deciles of score. In this figure (only) no adjustment has been made for the dilution of observed effects due to parent imputation from cohort subjects. Effect sizes in parent, if parent genotypes had been used, are expected to be twice that shown. E and W – England and Wales; PRS – polygenic risk score.
Figure 8. Survival curves for highest and lowest deciles of lifespan polygenic risk score. A polygenic risk score was made for each subject using GWAS results that did not include the subject sets under consideration. Subject or parent survival information (age entry, age exit, age of death (if applicable) was used to create Kaplan-Meier curves for the top and bottom deciles of score. In this figure (only) no adjustment has been made for the dilution of observed effects due to parent imputation from cohort subjects. Effect sizes in parent, if parent genotypes had been used, are expected to be twice that shown. E and W – England and Wales; PRS – polygenic risk score.CC BY · PubMed Central
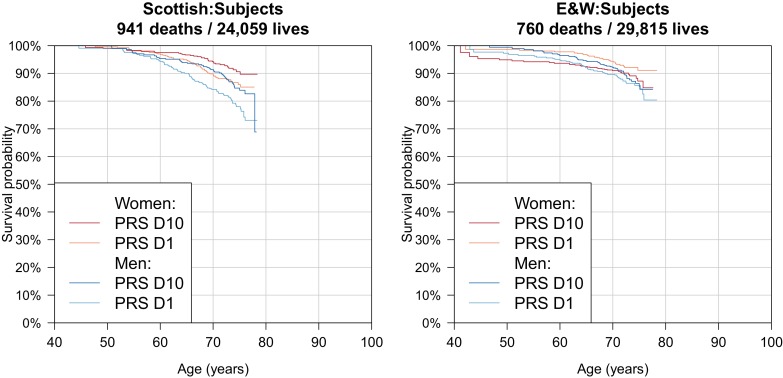
Figure 8—figure supplement 1. Survival Curves for highest and lowest deciles of lifespan polygenic risk score in UK Biobank subjects. A polygenic risk score was made for each subject using GWAS results that did not include the subject sets under consideration. Subject survival information (age entry, age exit, age of death (if applicable) was used to create Kaplan-Meier curves for the top and bottom deciles of score. The narrow range of ages and short time since inception means that UK Biobank subject curves are subject to greater uncertainty, particularly at each end, and only cover a shorter interval. E and W – England and Wales; PRS – polygenic risk score.
Figure 8—figure supplement 1. Survival Curves for highest and lowest deciles of lifespan polygenic risk score in UK Biobank subjects. A polygenic risk score was made for each subject using GWAS results that did not include the subject sets under consideration. Subject survival information (age entry, age exit, age of death (if applicable) was used to create Kaplan-Meier curves for the top and bottom deciles of score. The narrow range of ages and short time since inception means that UK Biobank subject curves are subject to greater uncertainty, particularly at each end, and only cover a shorter interval. E and W – England and Wales; PRS – polygenic risk score.CC BY · PubMed Central
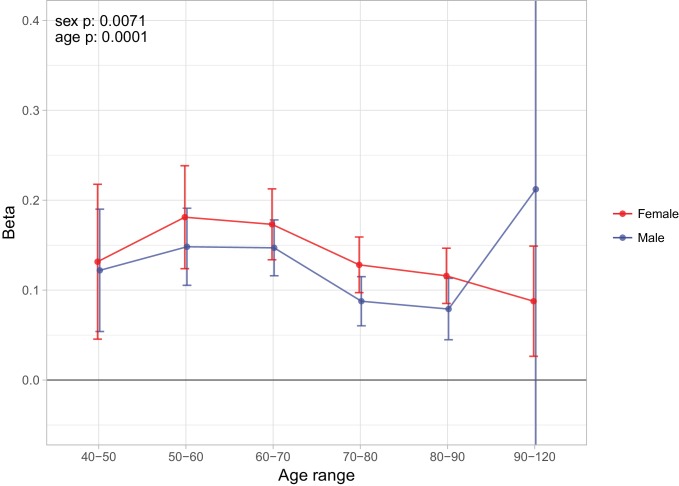
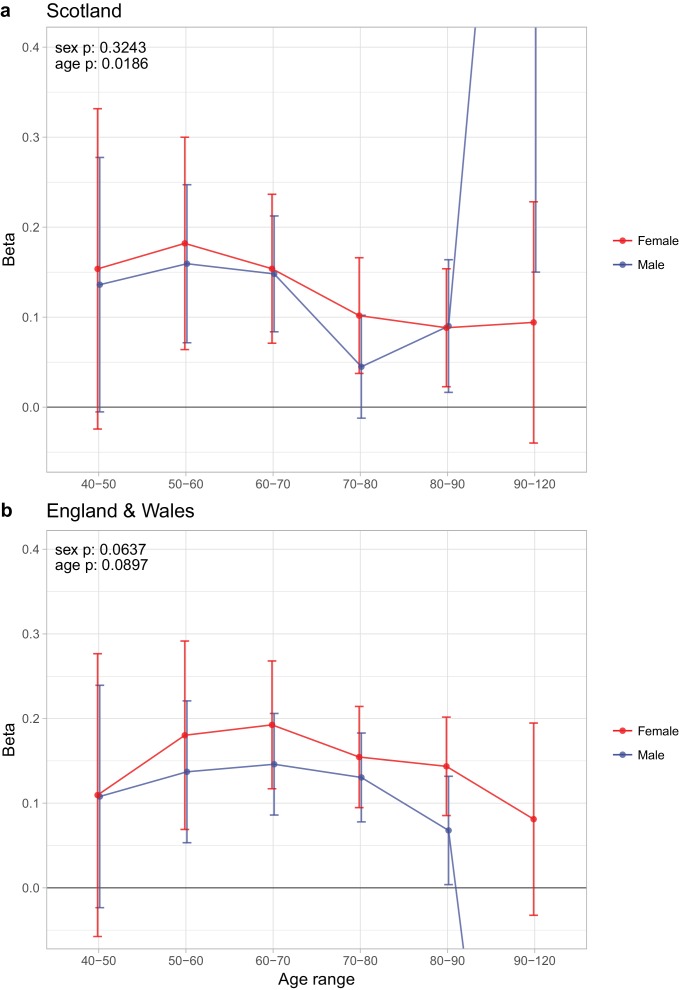
Figure 9. Sex and age specific effects of polygenic survival score (PRS) on parental lifespan in UK Biobank. The effect of out-of-sample PRS on parental lifespan stratified by sex and age was estimated for Scottish and English/Welsh subsamples individually (see Figure 9—figure supplement 1) and subsequently meta-analysed. The estimate for the PRS on father lifespan in the highest age range has very wide confidence intervals (CI) due to the limited number of fathers surviving past 90 years of age. The beta 95% CI for this estimate is –0.15 to 0.57. Beta – loge(protection ratio) for one standard deviation of PRS for increased lifespan in self in the age band (i.e. 2 x observed due to 50% kinship), bounds shown are 95% CI; Age range – the range of ages over which beta was estimated; sex p – P value for association of effect size with sex; age p – P value for association of effect size with age.
Figure 9. Sex and age specific effects of polygenic survival score (PRS) on parental lifespan in UK Biobank. The effect of out-of-sample PRS on parental lifespan stratified by sex and age was estimated for Scottish and English/Welsh subsamples individually (see Figure 9—figure supplement 1) and subsequently meta-analysed. The estimate for the PRS on father lifespan in the highest age range has very wide confidence intervals (CI) due to the limited number of fathers surviving past 90 years of age. The beta 95% CI for this estimate is –0.15 to 0.57. Beta – loge(protection ratio) for one standard deviation of PRS for increased lifespan in self in the age band (i.e. 2 x observed due to 50% kinship), bounds shown are 95% CI; Age range – the range of ages over which beta was estimated; sex p – P value for association of effect size with sex; age p – P value for association of effect size with age.CC BY · PubMed Central
Figure 9—figure supplement 1. Sex and age specific effects of polygenic survival score (PRS) on parental lifespan of Scottish and English/Welsh subsamples of UK Biobank. (A) Out of sample Scottish subset of UK Biobank; (B) Out of sample English and Welsh subset of UK Biobank; Estimates for the PRS on father lifespan in the highest age range have very wide confidence intervals (CI) due to the limited number of fathers surviving past 90 years of age. The beta 95% CI for these estimates are 0.15 to 2.20 for Scottish subsamples and –1.34 to –0.16 for English and Welsh subsamples. Beta – loge(protection ratio) for one standard deviation of PRS for increased lifespan in self in the age band (i.e. 2 x observed due to 50% kinship), bounds shown are 95% CI; Age range – the range of ages over which beta was estimated; sex p – P value for association of effect size with sex; age p – P value for association of effect size with age.
Figure 9—figure supplement 1. Sex and age specific effects of polygenic survival score (PRS) on parental lifespan of Scottish and English/Welsh subsamples of UK Biobank. (A) Out of sample Scottish subset of UK Biobank; (B) Out of sample English and Welsh subset of UK Biobank; Estimates for the PRS on father lifespan in the highest age range have very wide confidence intervals (CI) due to the limited number of fathers surviving past 90 years of age. The beta 95% CI for these estimates are 0.15 to 2.20 for Scottish subsamples and –1.34 to –0.16 for English and Welsh subsamples. Beta – loge(protection ratio) for one standard deviation of PRS for increased lifespan in self in the age band (i.e. 2 x observed due to 50% kinship), bounds shown are 95% CI; Age range – the range of ages over which beta was estimated; sex p – P value for association of effect size with sex; age p – P value for association of effect size with age.CC BY · PubMed Central
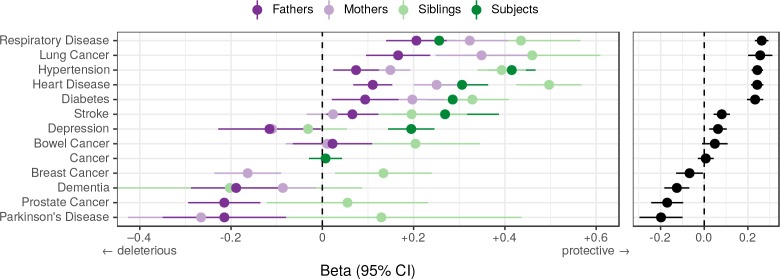
Figure 10. Associations between polygenic lifespan score and diseases of UK Biobank subjects and their kin. Logistic regression was performed on standardised polygenic survival score (all variants) and 21 disease traits reported by 24,059 Scottish and 29,815 English/Welsh out-of-sample individuals about themselves and their kin. For grouping of UK Biobank disease codes, see Figure 10—source data 1. Displayed here are inverse-variance meta-analysed estimates of the diseases for which multiple sources of data were available (i.e. parents and/or siblings; see Figure 10—figure supplement 1 for all associations). ‘Cancer’ is only in subjects, whilst the specific subtypes are analysed for kin. The left panel shows disease estimates for each kin separately; the right panel shows the combined estimate, with standard errors adjusted for correlation between family members. Diseases have been ordered by magnitude of effect size (combined estimate). Beta – log odds reduction ratio of disease per standard deviation of polygenic survival score, where a negative beta indicates a deleterious effect of score on disease prevalence (lifetime so far), and positive beta indicates a protective effect on disease. Effect sizes for first degree relatives have been doubled. Cancer – Binary cancer phenotype (any cancer, yes/no).
Figure 10. Associations between polygenic lifespan score and diseases of UK Biobank subjects and their kin. Logistic regression was performed on standardised polygenic survival score (all variants) and 21 disease traits reported by 24,059 Scottish and 29,815 English/Welsh out-of-sample individuals about themselves and their kin. For grouping of UK Biobank disease codes, see Figure 10—source data 1. Displayed here are inverse-variance meta-analysed estimates of the diseases for which multiple sources of data were available (i.e. parents and/or siblings; see Figure 10—figure supplement 1 for all associations). ‘Cancer’ is only in subjects, whilst the specific subtypes are analysed for kin. The left panel shows disease estimates for each kin separately; the right panel shows the combined estimate, with standard errors adjusted for correlation between family members. Diseases have been ordered by magnitude of effect size (combined estimate). Beta – log odds reduction ratio of disease per standard deviation of polygenic survival score, where a negative beta indicates a deleterious effect of score on disease prevalence (lifetime so far), and positive beta indicates a protective effect on disease. Effect sizes for first degree relatives have been doubled. Cancer – Binary cancer phenotype (any cancer, yes/no).CC BY · PubMed Central
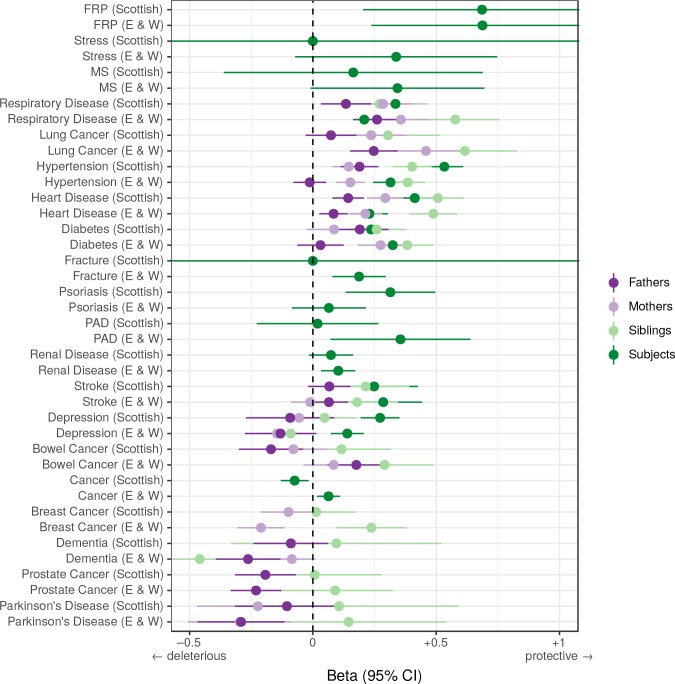
Figure 10—figure supplement 1. Associations between polygenic survival score and diseases of individuals and their kin from Scottish and English/Welsh subsamples of UK Biobank. Logistic regression was performed on standardised polygenic survival score (all variants) and 21 traits reported by 24,059 Scottish and 29,815 English/Welsh out-of-sample individuals about themselves and their kin. Diseases have been ordered by magnitude of effect size (meta-analysed between cohorts and kin). Beta – log odds reduction ratio of disease per standard deviation of polygenic survival score, where a negative beta indicates a deleterious effect of score on disease prevalence (lifetime so far), and positive beta indicates a protective effect on disease. Effect sizes for first degree relative have been doubled. Cancer – Binary cancer phenotype (yes/no), FRP – Female Reproductive Problems, MS – Multiple Sclerosis, PAD – Peripheral Artery Disease.
Figure 10—figure supplement 1. Associations between polygenic survival score and diseases of individuals and their kin from Scottish and English/Welsh subsamples of UK Biobank. Logistic regression was performed on standardised polygenic survival score (all variants) and 21 traits reported by 24,059 Scottish and 29,815 English/Welsh out-of-sample individuals about themselves and their kin. Diseases have been ordered by magnitude of effect size (meta-analysed between cohorts and kin). Beta – log odds reduction ratio of disease per standard deviation of polygenic survival score, where a negative beta indicates a deleterious effect of score on disease prevalence (lifetime so far), and positive beta indicates a protective effect on disease. Effect sizes for first degree relative have been doubled. Cancer – Binary cancer phenotype (yes/no), FRP – Female Reproductive Problems, MS – Multiple Sclerosis, PAD – Peripheral Artery Disease.CC BY · PubMed Central

Verification

Claims the paper makes

The claims and statistics of this paper haven’t been checked yet.

Run the check — free, no account needed. It reads the open-access text and checks the sources it cites.

A few free checks a day · papers already verified open instantly · results are public

Claims other papers make about this one

Each is checked against this paper’s own text: does it say what the citing paper says it does?

Self-check

Percentages, sums and reported differences re-computed from the paper’s own numbers.

The self-check needs the paper’s full text.

Citations

Cites

Research works printed but not linked: 59

  1. Association of British Insurers and UK Government. 2014. ABI. Concordat and Moratorium on Genetics and Insurance.
  2. Beekman, 2013, Genome-wide linkage analysis for human longevity: genetics of healthy aging study, Aging Cell, 12, 184, 10.1111/acel.12039 · DOI · Paper page
  3. Ben-Avraham, 2017, The GH receptor exon 3 deletion is a marker of male-specific exceptional longevity associated with increased GH sensitivity and taller stature, Science Advances, 3, e1602025, 10.1126/sciadv.1602025 · DOI
  4. Broer, 2015, GWAS of longevity in CHARGE consortium confirms APOE and FOXO3 candidacy, The Journals of Gerontology: Series A, 70, 110, 10.1093/gerona/glu166 · DOI
  5. Bycroft, 2017, Genome-wide genetic data on ~500,000 UK biobank participants, 10.1101/166298 · DOI
  6. Cooper, 2008, Meta-analysis of genome-wide association study data identifies additional type 1 diabetes risk loci, Nature Genetics, 40, 1399, 10.1038/ng.249 · DOI
  7. Cox, 1972, Regression models and Life-Tables, Journal of the Royal Statistical Society: Series B, 34, 187, 10.1111/j.2517-6161.1972.tb00899.x · DOI · Paper page
  8. Deelen, 2011, Genome-wide association study identifies a single major locus contributing to survival into old age; the APOE locus revisited, Aging Cell, 10, 686, 10.1111/j.1474-9726.2011.00705.x · DOI
  9. Deelen, 2013, Identifying the genomic determinants of aging and longevity in human population studies: progress and challenges, BioEssays, 35, 386, 10.1002/bies.201200148 · DOI
  10. Deelen, 2014, Genome-wide association meta-analysis of human longevity identifies a novel locus conferring survival beyond 90 years of age, Human Molecular Genetics, 23, 4420, 10.1093/hmg/ddu139 · DOI
  11. Donlon, 2017, FOXO3 longevity interactome on chromosome 6, Aging Cell, 16, 1016, 10.1111/acel.12625 · DOI
  12. Euesden, 2015, PRSice: polygenic risk score software, Bioinformatics, 31, 1466, 10.1093/bioinformatics/btu848 · DOI
  13. Falconer, 1996, Introduction to Quantitative Genetics, 12
  14. Finucane, 2015, Partitioning heritability by functional annotation using genome-wide association summary statistics, Nature Genetics, 47, 1228, 10.1038/ng.3404 · DOI · Paper page
  15. Flachsbart, 2017, Identification and characterization of two functional variants in the human longevity gene FOXO3, Nature Communications, 8, 2063, 10.1038/s41467-017-02183-y · DOI
  16. Grossi, 2018, The longevity SNP rs2802292 uncovered: hsf1 activates stress-dependent expression of FOXO3 through an intronic enhancer, Nucleic Acids Research, 46, 5587, 10.1093/nar/gky331 · DOI
  17. Haller, 2015, RegScan: a GWAS tool for quick estimation of allele effects on continuous traits and their combinations, Briefings in Bioinformatics, 16, 39, 10.1093/bib/bbt066 · DOI
  18. Hayashi, 2013, Dorsolateral prefrontal and orbitofrontal cortex interactions during self-control of cigarette craving, Proceedings of the National Academy of Sciences, 110, 4422, 10.1073/pnas.1212185110 · DOI
  19. Hemani, 2018, The MR-Base platform supports systematic causal inference across the human phenome, eLife, 7, e34408, 10.7554/eLife.34408 · DOI · Paper page
  20. Hwangbo, 2004, Drosophila dFOXO controls lifespan and regulates insulin signalling in brain and fat body, Nature, 429, 562, 10.1038/nature02549 · DOI
  21. Joshi, 2016, Variants near CHRNA3/5 and APOE have age- and sex-related effects on human lifespan, Nature Communications, 7, 11174, 10.1038/ncomms11174 · DOI
  22. Joshi, 2017, Genome-wide meta-analysis associates HLA-DQA1/DRB1 and LPA and lifestyle factors with human longevity, Nature Communications, 8, 910, 10.1038/s41467-017-00934-5 · DOI · Paper page
  23. Kaplanis, 2018, Quantitative analysis of population-scale family trees with millions of relatives, 10.1101/106427 · DOI
  24. Kenyon, 1993, A C. elegans mutant that lives twice as long as wild type, Nature, 366, 461, 10.1038/366461a0 · DOI · Paper page
  25. Lamparter, 2016, Fast and rigorous computation of gene and pathway scores from SNP-Based summary statistics, PLOS Computational Biology, 12, e1004714, 10.1371/journal.pcbi.1004714 · DOI
  26. Legal General Group PLC. 2017. Legal and General Group. Interim Management Report.
  27. Leitsalu, 2015, Cohort profile: estonian biobank of the estonian genome center, university of tartu, International Journal of Epidemiology, 44, 1137, 10.1093/ije/dyt268 · DOI
  28. Lin, 2009, Meta-analysis of genome-wide association studies with overlapping subjects, The American Journal of Human Genetics, 85, 862, 10.1016/j.ajhg.2009.11.001 · DOI
  29. Lloyd-Jones, 2017, The genetic architecture of gene expression in peripheral blood, The American Journal of Human Genetics, 100, 371, 10.1016/j.ajhg.2017.01.026 · DOI
  30. Loh, 2015, Efficient bayesian mixed-model analysis increases association power in large cohorts, Nature Genetics, 47, 284, 10.1038/ng.3190 · DOI · Paper page
  31. Lowe, 2014, The effects of continuous theta burst stimulation to the left dorsolateral prefrontal cortex on executive function, food cravings, and snack food consumption, Psychosomatic Medicine, 76, 503, 10.1097/PSY.0000000000000090 · DOI
  32. MacArthur, 2017, The new NHGRI-EBI catalog of published genome-wide association studies (GWAS catalog), Nucleic Acids Research, 45, D896, 10.1093/nar/gkw1133 · DOI · Paper page
  33. Maciejewski, 2014, Gene set analysis methods: statistical models and methodological differences, Briefings in Bioinformatics, 15, 504, 10.1093/bib/bbt002 · DOI
  34. Mathers C, Stevens GA, Mahanani WR, Fat DM, Hogan D. 2018. WHO. Global Health Estimates 2016: Deaths by Cause Age, Sex, by Country and by Region.
  35. McDaid, 2017, Bayesian association scan reveals loci associated with human lifespan and linked biomarkers, Nature Communications, 8, 15842, 10.1038/ncomms15842 · DOI
  36. McGue, 1993, Longevity is moderately heritable in a sample of danish twins born 1870-1880, Journal of Gerontology, 48, B237, 10.1093/geronj/48.6.B237 · DOI
  37. McKay, 2007, Haplotype-Based analysis of common variation in the growth hormone receptor gene and prostate cancer risk, Cancer Epidemiology Biomarkers & Prevention, 16, 169, 10.1158/1055-9965.EPI-06-0320 · DOI
  38. McRae, 2017, Identification of 55,000 replicated DNA methylation QTL, 10.1101/166710 · DOI
  39. Mishra, 2015, VEGAS2: software for more flexible Gene-Based testing, Twin Research and Human Genetics, 18, 86, 10.1017/thg.2014.79 · DOI · Paper page
  40. Mishra, 2017, A novel approach for pathway analysis of GWAS data highlights role of BMP signaling and muscle cell differentiation in colorectal cancer susceptibility, Twin Research and Human Genetics, 20, 1, 10.1017/thg.2016.100 · DOI
  41. Morrison, 2012, The ageing cortical synapse: hallmarks and implications for cognitive decline, Nature Reviews Neuroscience, 13, 240, 10.1038/nrn3200 · DOI · Paper page
  42. Myllykangas-Luosujärvi, 1995, Shortening of life span and causes of excess mortality in a population-based series of subjects with rheumatoid arthritis, Clinical and Experimental Rheumatology, 13, 149
  43. Ning, 2017, A selection operator for summary association statistics reveals allelic heterogeneity of complex traits, The American Journal of Human Genetics, 101, 903, 10.1016/j.ajhg.2017.09.027 · DOI
  44. Pilling, 2016, Human longevity is influenced by many genetic variants: evidence from 75,000 UK biobank participants, Aging, 8, 547, 10.18632/aging.100930 · DOI
  45. Pilling, 2017, Human longevity: 25 genetic loci associated in 389,166 UK biobank participants, Aging, 9, 2504, 10.18632/aging.101334 · DOI · Paper page
  46. Raychaudhuri, 2008, Common variants at CD40 and other loci confer risk of rheumatoid arthritis, Nature Genetics, 40, 1216, 10.1038/ng.233 · DOI
  47. Ruby, 2018, Estimates of the heritability of human longevity are substantially inflated due to assortative mating, Genetics, 210, 1109, 10.1534/genetics.118.301613 · DOI · Paper page
  48. Sebastiani, 2013, Families enriched for exceptional longevity also have increased Health-Span: findings from the long life family study, Frontiers in Public Health, 1, 38, 10.3389/fpubh.2013.00038 · DOI
  49. Sebastiani, 2016, Increasing sibling relative risk of survival to older and older ages and the importance of precise definitions of “Aging,” “Life Span,” and “Longevity”, The Journals of Gerontology Series A: Biological Sciences and Medical Sciences, 71, 340, 10.1093/gerona/glv020 · DOI
  50. Sebastiani, 2017, Four Genome-Wide association studies identify new extreme longevity variants, The Journals of Gerontology: Series A, 72, 1453, 10.1093/gerona/glx027 · DOI
  51. Shen, 2015, Simple multi-trait analysis identifies novel loci associated with growth and obesity measures, 10.1101/022269 · DOI
  52. Therneau, 1990, Martingale-based residuals for survival models, Biometrika, 77, 147, 10.1093/biomet/77.1.147 · DOI
  53. van den Berg, 2017, Historical demography and longevity genetics: back to the future, Ageing Research Reviews, 38, 28, 10.1016/j.arr.2017.06.005 · DOI
  54. Wacholder, 1998, The kin-cohort study for estimating penetrance, American Journal of Epidemiology, 148, 623, 10.1093/aje/148.7.623 · DOI
  55. Westra, 2013, Systematic identification of trans eQTLs as putative drivers of known disease associations, Nature Genetics, 45, 1238, 10.1038/ng.2756 · DOI · Paper page
  56. Williams, 1957, Pleiotropy, natural selection, and the evolution of senescence, Evolution, 11, 398, 10.1111/j.1558-5646.1957.tb02911.x · DOI · Paper page
  57. Wood, 2014, Defining the role of common variation in the genomic and biological architecture of adult human height, Nature Genetics, 46, 1173, 10.1038/ng.3097 · DOI · Paper page
  58. Zarrouk, 2014, Involvement of oxysterols in age-related diseases and ageing processes, Ageing Research Reviews, 18, 148, 10.1016/j.arr.2014.09.006 · DOI
  59. Zhu, 2016, Integration of summary data from GWAS and eQTL studies predicts complex trait gene targets, Nature Genetics, 48, 481, 10.1038/ng.3538 · DOI · Paper page

Cited by

Sorted by citations

See all 259

Metadata

Authors
Timmers, P. R., Mounier, N., Lall, K., Fischer, K., Ning, Z., Feng, X., Bretherick, A. D., Clark, D. W., eQTLGen Consortium, Agbessi, M., Ahsan, H., Alves, I., Andiappan, A., Awadalla, P., Battle, A., Bonder, M., Boomsma, D., Christiansen, M., Claringbould, A., Deelen, P., van Dongen, J., Esko, T., Favé, M., Franke, L., Frayling, T., Gharib, S., Gibson, G., Hemani, G., Jansen, R., Kalnapenkis, A., Kasela, S., Kettunen, J., Kim, Y., Kirsten, H., Kovacs, P., Krohn, K., Kronberg-Guzman, J., Kukushkina, V, Kutalik, Z., Kähönen, M., Lee, B., Lehtimäki, T., Loeffler, M., Marigorta, U., Metspalu, A., van Meurs, J., Milani, L., Müller-Nurasyid, M., Nauck, M., Nivard, M., Penninx, B., Perola, M., Pervjakova, N., Pierce, B., Powell, J., Prokisch, H., Psaty, B., Raitakari, O., Ring, S., Ripatti, S., Rotzschke, O., Ruëger, S., Saha, A., Scholz, M., Schramm, K., Seppälä, I., Stumvoll, M., Sullivan, P., Teumer, A., Thiery, J., Tong, L., Tönjes, A., Verlouw, J., Visscher, P., Võsa, U., Völker, U., Yaghootkar, H., Yang, J., Zeng, B., Zhang, F., Agbessi, M., Ahsan, H., Alves, I., Andiappan, A., Awadalla, P., Battle, A., Bonder, M., Boomsma, D., Christiansen, M., Claringbould, A., Deelen, P., van Dongen, J., Esko, T., Favé, M., Franke, L., Frayling, T., Gharib, S., Gibson, G., Hemani, G., Jansen, R., Kalnapenkis, A., Kasela, S., Kettunen, J., Kim, Y., Kirsten, H., Kovacs, P., Krohn, K., Kronberg-Guzman, J., Kukushkina, V, Kutalik, Z., Kähönen, M., Lee, B., Lehtimäki, T., Loeffler, M., Marigorta, U., Metspalu, A., van Meurs, J., Milani, L., Müller-Nurasyid, M., Nauck, M., Nivard, M., Penninx, B., Perola, M., Pervjakova, N., Pierce, B., Powell, J., Prokisch, H., Psaty, B., Raitakari, O., Ring, S., Ripatti, S., Rotzschke, O., Ruëger, S., Saha, A., Scholz, M., Schramm, K., Seppälä, I., Stumvoll, M., Sullivan, P., Teumer, A., Thiery, J., Tong, L., Tönjes, A., Verlouw, J., Visscher, P., Võsa, U., Völker, U., Yaghootkar, H., Yang, J., Zeng, B., Zhang, F., Shen, X., Esko, T., Kutalik, Z., Wilson, J. F., & Joshi, P. K.
Affiliations
  • Centre for Global Health Research, Usher Institute of Population Health Sciences and Informatics, University of Edinburgh, Edinburgh, United Kingdom
  • Institute of Social and Preventive Medicine, University Hospital of Lausanne, Lausanne, Switzerland
  • Estonian Genome Center, Institute of Genomics, University of Tartu, Tartu, Estonia
  • Department of Medical Epidemiology and Biostatistics, Karolinska Institutet, Stockholm, Sweden
  • State Key Laboratory of Biocontrol, School of Life Sciences, Sun Yat-sen University, Guangzhou, China
  • MRC Human Genetics Unit, Institute of Genetics and Molecular Medicine, University of Edinburgh, Edinburgh, United Kingdom
Venue
eLife
Published
2019-01-15
Volume
8
ISSN
2050-084X
Cited by
259
References
18
Language
en
Funders
  • Medical Research Council (DTP in Precision Medicine MR/N013166/1,HGU QTL in health and disease)
  • Estonian Research Competency Council (PUT 1665)
  • Wellcome Trust (PhD Training Fellowship for Clinicians)
  • Edinburgh Clinical Academic Track (204979/Z/16/Z)
  • Svenska Forskningsrådet Formas (2014-00371, 2017-02543)
  • Schweizerischer Nationalfonds zur Förderung der Wissenschaftlichen Forschung (31003A_169929)
  • SystemsX.ch (51RTP0_151019)
  • AXA Research Fund

About these checks

Registry, retraction, Cites and statistics results are computed, not judged, with one exception: a printed reference that no index lists is read once by a model before it counts as a citation error. Claims are extracted by a model and kept only when their quote appears verbatim in the text; each cited source is then checked, with a model’s help, for whether it says what the claim relies on. Those verdicts can be wrong — read the claim’s quote and the cited source before relying on one.

Statistics and arithmetic are recomputed, not judged.

Confidence bands are shown only for fields calibrated on our annotated test set. None is calibrated yet, so no band is shown.

What counts as a claim ›How we measure confidence ›How we check this ›

Are you an author, or do you see a problem with this page? Request a review