

The DOI matches its Crossref record; 49 of the 49 references it cites were found in a registry or an index.
An atlas of polygenic risk score associations to highlight putative causal relationships across the human phenome
Open accessPublished version of a preprint
Abstract
The age of large-scale genome-wide association studies (GWAS) has provided us with an unprecedented opportunity to evaluate the genetic liability of complex disease using polygenic risk scores (PRS). In this study, we have analysed 162 PRS (p<5×10−05) derived from GWAS and 551 heritable traits from the UK Biobank study (N = 334,398). Findings can be investigated using a web application (http://mrcieu.mrsoftware.org/PRS_atlas/), which we envisage will help uncover both known and novel mechanisms which contribute towards disease susceptibility. To demonstrate this, we have investigated the results from a phenome-wide evaluation of schizophrenia genetic liability. Amongst findings were inverse associations with measures of cognitive function which extensive follow-up analyses using Mendelian randomization (MR) provided evidence of a causal relationship. We have also investigated the effect of multiple risk factors on disease using mediation and multivariable MR frameworks. Our atlas provides a resource for future endeavours seeking to unravel the causal determinants of complex disease.
Overview
The claims and statistics of this paper haven’t been checked yet.
Run the check — free, no account needed. It reads the open-access text and checks the sources it cites.
Integrity signals
Registry
Cites
Statistics
Figures
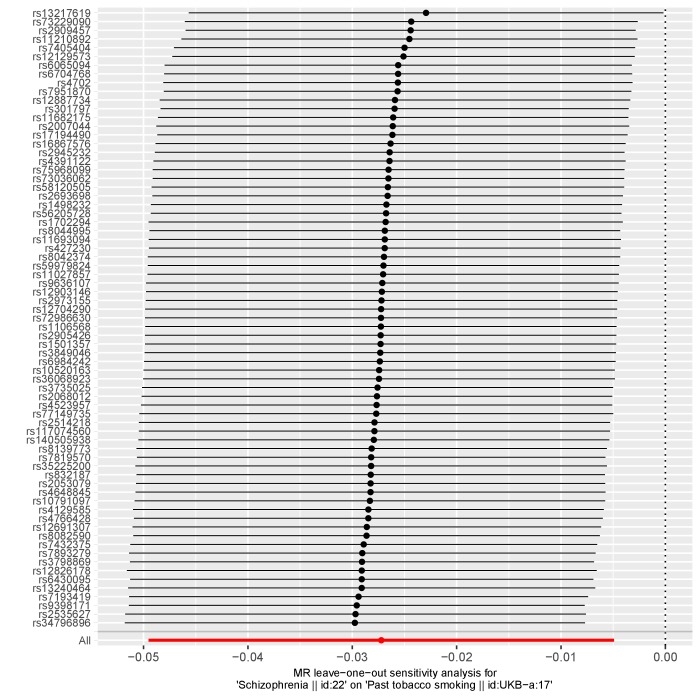
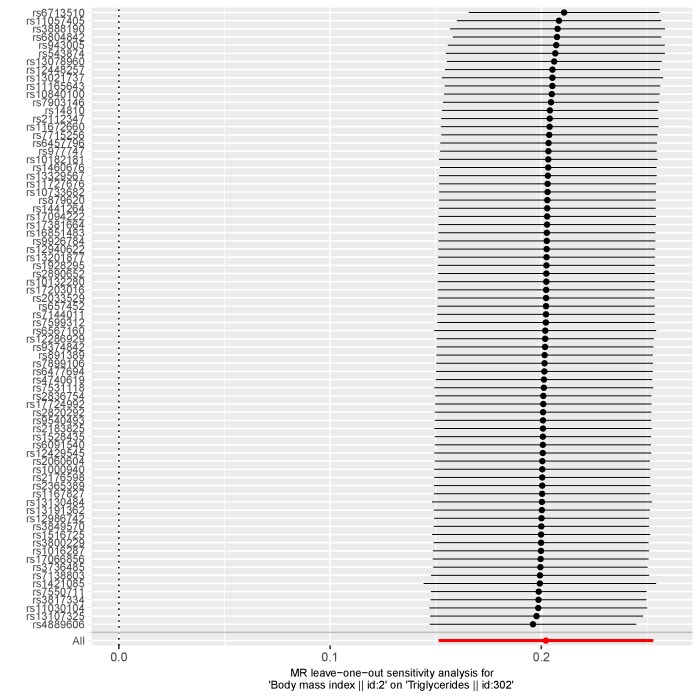
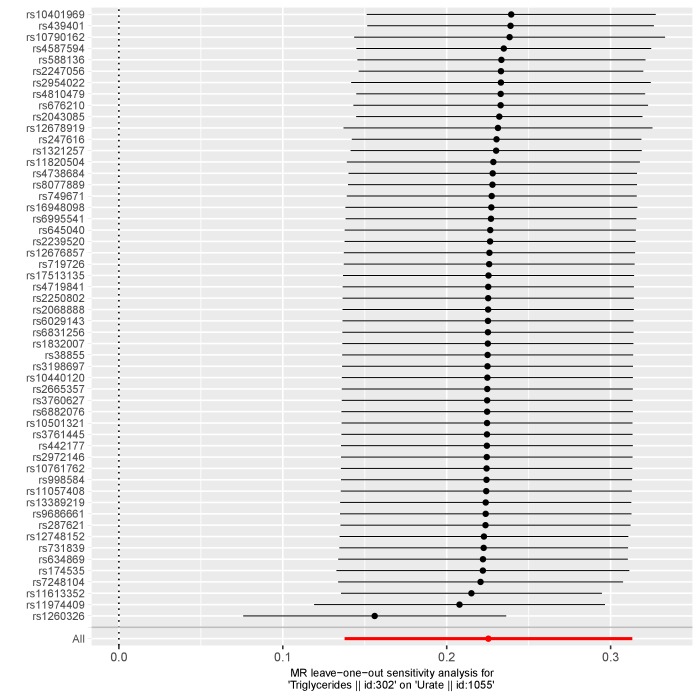
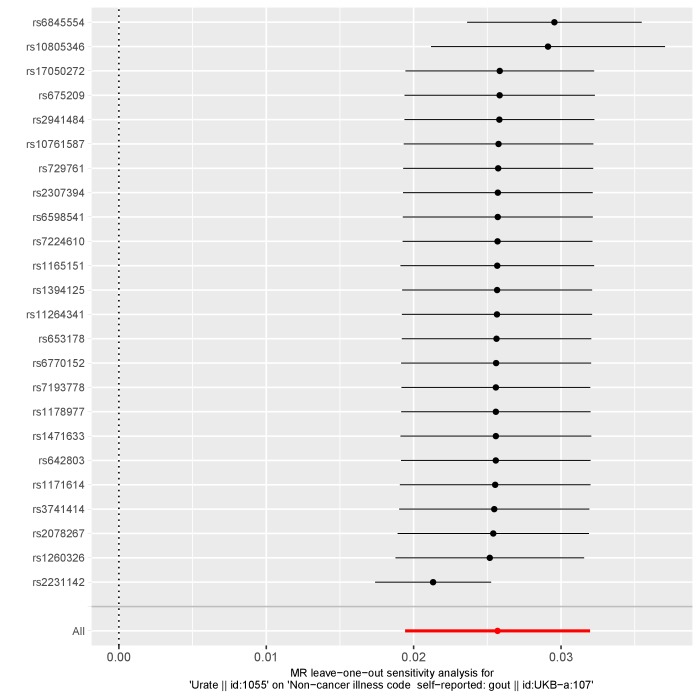
Verification
Claims the paper makes
The claims and statistics of this paper haven’t been checked yet.
Run the check — free, no account needed. It reads the open-access text and checks the sources it cites.
Claims other papers make about this one
Each is checked against this paper’s own text: does it say what the citing paper says it does?
The source backs part of the claim, not all of it — or backs it for a different population, condition or comparison.
In the citing paper
“we and others argue that associations between patient-level PGSs and outcomes are more robust, potentially capturing causal associations.95”
From Cystatin C is glucocorticoid responsive, directs recruitment of Trem2+ macrophages, and predicts failure of cancer immunotherapy (2023) · cites this paper as [95]
Experimental — accuracy not yet measuredIn the citing paper
“In addition, as inherited sequence variation is a prominent cause of phenotypic variation (but the reverse is not true), risk variants identified by GWAS have value as genetic instruments, mapping causal relationships between traits and inferring contributions made by circulating biomarkers and environmental exposures to disease development66.”
From A brief history of human disease genetics (2020) · cites this paper as [66]
Self-check
Percentages, sums and reported differences re-computed from the paper’s own numbers.
The self-check needs the paper’s full text.
Citations
Cites
Sudlow, C., Gallacher, J., Allen, N., Beral, V., Burton, P., Danesh, J., Downey, P., Elliott, P., Green, J., Landray, M., et al. (2015) · PLOS Medicine · doi:10.1371/journal.pmed.1001779 · Cited by 12,728
Bowden, J., Davey Smith, G., & Burgess, S. (2015) · International Journal of Epidemiology · doi:10.1093/ije/dyv080 · Cited by 9,816 · cited 2×
“evaluating the MR-Egger intercept term (Bowden et al., 2015) to discern whether estimates may be biased by directional pleiotropic effects.”
BackgroundMethodBowden, J., Davey Smith, G., Haycock, P. C., & Burgess, S. (2016) · Genetic Epidemiology · doi:10.1002/gepi.21965 · Cited by 8,922 · cited 2×
“, 2013), weighed median (Bowden et al., 2016) and weighted mode approaches.”
MethodThe UK Biobank resource with deep phenotyping and genomic data
Bycroft, C., Freeman, C., Petkova, D., Band, G., Elliott, L. T., Sharp, K., Motyer, A., Vukcevic, D., Delaneau, O., O’Connell, J., et al. (2018) · Nature · doi:10.1038/s41586-018-0579-z · Cited by 8,876 · cited 2×
“In this study, we have constructed 162 different PRS (based on p<5 10 ) using findings from large-scale GWAS and evaluated their association with 551 traits in up to 334,398 individuals enrolled in the UK Biobank study (Bycroft et al., 2018; Sudlow et al., 2015).”
BackgroundMethodThe MR-Base platform supports systematic causal inference across the human phenome
Hemani, G., Zheng, J., Elsworth, B., Wade, K. H., Haberland, V., Baird, D., Laurin, C., Burgess, S., Bowden, J., Langdon, R., et al. (2018) · eLife · doi:10.7554/elife.34408 · Cited by 7,959 · cited 1×
“Constructing polygenic risk scores from large-scale genome-wide association studies We have used the MR-Base platform (Hemani et al., 2018) to identify SNPs from large-scale GWAS to include in our PRS.”
MethodSelf-citationAn integrated map of genetic variation from 1,092 human genomes
The 1000 Genomes Project Consortium (2012) · Nature · doi:10.1038/nature11632 · Cited by 7,711
Mendelian Randomization Analysis With Multiple Genetic Variants Using Summarized Data
Burgess, S., Butterworth, A., & Thompson, S. G. (2013) · Genetic Epidemiology · doi:10.1002/gepi.21758 · Cited by 6,050 · cited 3×
“In terms of MR methods, we applied the inverse variance weighted (IVW) (Burgess et al., 2013), weighed median (Bowden et al.”
MethodInfluentialDavey Smith, G., & Ebrahim, S. (2003) · International Journal of Epidemiology · doi:10.1093/ije/dyg070 · Cited by 5,882
Mendelian randomization: genetic anchors for causal inference in epidemiological studies
Davey Smith, G., & Hemani, G. (2014) · Human Molecular Genetics · doi:10.1093/hmg/ddu328 · Cited by 4,677
Self-citationReading Mendelian randomisation studies: a guide, glossary, and checklist for clinicians
Davies, N. M., Holmes, M. V., & Davey Smith, G. (2018) · BMJ · doi:10.1136/bmj.k601 · Cited by 4,404 · cited 1×
“Along with the emerging utility of PRS to predict disease, they have also been previously used to evaluate putative causal relationships (Davies et al., 2018; Palmer et al., 2012).”
Method10 Years of GWAS Discovery: Biology, Function, and Translation
Visscher, P. M., Wray, N. R., Zhang, Q., Sklar, P., McCarthy, M. I., Brown, M. A., & Yang, J. (2017) · The American Journal of Human Genetics · doi:10.1016/j.ajhg.2017.06.005 · Cited by 3,719
What are the functional consequences of neurocognitive deficits in schizophrenia?
(1996) · American Journal of Psychiatry · doi:10.1176/ajp.153.3.321 · Cited by 3,516
Robust inference in summary data Mendelian randomization via the zero modal pleiotropy assumption
Hartwig, F. P., Davey Smith, G., & Bowden, J. (2017) · International Journal of Epidemiology · doi:10.1093/ije/dyx102 · Cited by 3,485 · cited 1×
“If the IVW method provides strong evidence of association but in the presence of heterogeneity, we suggest undertaking two additional MR analyses using the weighted mode (Hartwig et al., 2017) and weighed median (Bowden et al.”
MethodKhera, A. V., Chaffin, M., Aragam, K. G., Haas, M. E., Roselli, C., Choi, S. H., Natarajan, P., Lander, E. S., Lubitz, S. A., Ellinor, P. T., et al. (2018) · Nature Genetics · doi:10.1038/s41588-018-0183-z · Cited by 2,953 · cited 2×
“A recent study by Khera and colleagues (Khera et al., 2018) reported a similar odds ratio for CHD in their analysis (OR:>3.”
BackgroundOrienting the causal relationship between imprecisely measured traits using GWAS summary data.
Hemani, G., Tilling, K., & Davey Smith, G. (2017) · PLoS Genetics · doi:10.1371/journal.pgen.1007081 · Cited by 2,607 · cited 1×
“As a sensitivity analysis, repeat steps 1 and 2 but only using SNPs as instruments which are not filtered out by applying the MR directionality test (Hemani et al., 2017).”
MethodSelf-citation23andMe Research Team, Lee, J. J., COGENT (Cognitive Genomics Consortium), Social Science Genetic Association Consortium, Wedow, R., Okbay, A., Kong, E., Maghzian, O., Zacher, M., Nguyen-Viet, T. A., et al. (2018) · Nature Genetics · doi:10.1038/s41588-018-0147-3 · Cited by 2,470 · cited 1×
“, 2010), breakthroughs in the scale of GWAS and accessibility to biobank scale datasets have substantially improved their performance (Khera et al., 2018; Lee et al., 2018).”
BackgroundPersonal genomes: The case of the missing heritability
Maher, B. (2008) · Nature · doi:10.1038/456018a · Cited by 1,737
The personal and clinical utility of polygenic risk scores
Torkamani, A., Wineinger, N. E., & Topol, E. J. (2018) · Nature Reviews Genetics · doi:10.1038/s41576-018-0018-x · Cited by 1,655 · cited 1×
“Polygenic risk scores (PRS), commonly defined as the sum of trait-associated SNPs weighted by their effect sizes, harness findings from GWAS to provide an overall measure of an individual’s genetic liability to develop disease (Torkamani et al., 2018).”
BackgroundTHE COMPARISON OF PERCENTAGES IN MATCHED SAMPLES
COCHRAN, W. G. (1950) · Biometrika · doi:10.1093/biomet/37.3-4.256 · Cited by 1,465
Using multiple genetic variants as instrumental variables for modifiable risk factors
Palmer, T. M., Lawlor, D. A., Harbord, R. M., Sheehan, N. A., Tobias, J. H., Timpson, N. J., Smith, G. D., & Sterne, J. A. (2012) · Statistical Methods in Medical Research · doi:10.1177/0962280210394459 · Cited by 1,289
Sanderson, E., Davey Smith, G., Windmeijer, F., & Bowden, J. (2019) · International Journal of Epidemiology · doi:10.1093/ije/dyy262 · Cited by 1,085
Denny, J. C., Bastarache, L. A., Ritchie, M. D., Carroll, R. J., Zink, R., Mosley, J. D., Field, J. R., Pulley, J. M., Ramirez, A. H., Bowton, E., et al. (2013) · Nature Biotechnology · doi:10.1038/nbt.2749 · Cited by 987 · cited 1×
“Such endeavours are commonly referred to as phenome-wide association studies (Denny et al., 2013; Fritsche et al., 2018; Krapohl et al., 2016; Millard et al., 2015).”
BackgroundMendelian randomization of blood lipids for coronary heart disease
Holmes, M. V., Asselbergs, F. W., Palmer, T. M., Drenos, F., Lanktree, M. B., Nelson, C. P., Dale, C. E., Padmanabhan, S., Finan, C., Swerdlow, D. I., et al. (2015) · European Heart Journal · doi:10.1093/eurheartj/eht571 · Cited by 748 · cited 1×
“For example, instead of using a coronary heart disease (CHD) PRS to predict incidence of this disease, studies have investigated whether scores for known risk factors, such cholesterol and lipid levels (Holmes et al., 2015), are also strongly associated with CHD incidence.”
MethodRobust research needs many lines of evidence
Munafò, M. R., & Davey Smith, G. (2018) · Nature · doi:10.1038/d41586-018-01023-3 · Cited by 666
Wootton, R. E., Richmond, R. C., Stuijfzand, B. G., Lawn, R. B., Sallis, H. M., Taylor, G. M. J., Hemani, G., Jones, H. J., Zammit, S., Davey Smith, G., et al. (2020) · Psychological Medicine · doi:10.1017/s0033291719002678 · Cited by 587
Self-citationRelton, C. L., & Davey Smith, G. (2012) · International Journal of Epidemiology · doi:10.1093/ije/dyr233 · Cited by 567
Ripatti, S., Tikkanen, E., Orho-Melander, M., Havulinna, A. S., Silander, K., Sharma, A., Guiducci, C., Perola, M., Jula, A., Sinisalo, J., et al. (2010) · The Lancet · doi:10.1016/s0140-6736(10)61267-6 · Cited by 562 · cited 1×
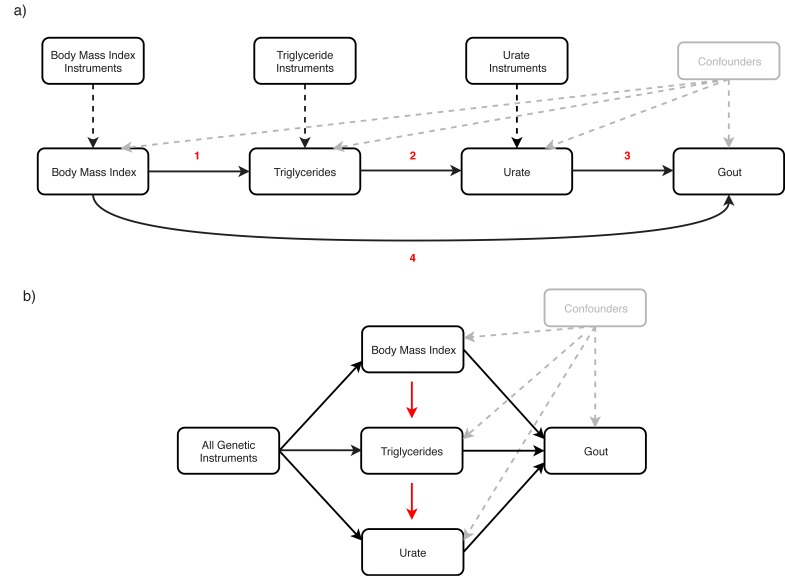
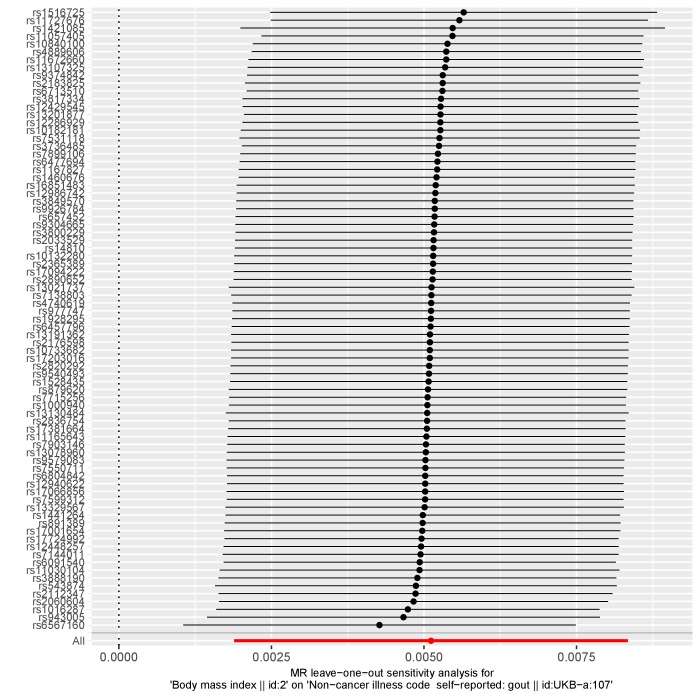
“Using the effect estimates from our IVW analysis, we estimated that 77% of the overall effect of BMI on gout risk (Figure 3a (4)) is mediated through this causal pathway.”
MethodThe HLA Region and Autoimmune Disease: Associations and Mechanisms of Action
Simmonds, M., & Gough, S. (2007) · Current Genomics · doi:10.2174/138920207783591690 · Cited by 472
Generalized Cognitive Deficits in Schizophrenia
Mohamed, S., Paulsen, J. S., OʼLeary, D. S., Arndt, S. V., & Andreasen, N. C. (1999) · Archives of General Psychiatry · doi:10.1001/archpsyc.56.8.749 · Cited by 432
Li, X., Meng, X., Timofeeva, M. N., Tzoulaki, I., Tsilidis, K. K., Ioannidis, J. P. A., Campbell, H. J., & Τheodoratou, E. (2017) · BMJ · doi:10.1136/bmj.j2376 · Cited by 402
Distinguishing genetic correlation from causation across 52 diseases and complex traits
O’Connor, L. J., & Price, A. L. (2018) · Nature Genetics · doi:10.1038/s41588-018-0255-0 · Cited by 394
Jones, S. E., Tyrrell, J., Wood, A. R., Beaumont, R. N., Ruth, K. S., Tuke, M. A., Yaghootkar, H., Hu, Y., Teder-Laving, M., Hayward, C., et al. (2016) · PLOS Genetics · doi:10.1371/journal.pgen.1006125 · Cited by 388
Genomic prediction of coronary heart disease
Abraham, G., Havulinna, A. S., Bhalala, O. G., Byars, S. G., De Livera, A. M., Yetukuri, L., Tikkanen, E., Perola, M., Schunkert, H., Sijbrands, E. J., et al. (2016) · European Heart Journal · doi:10.1093/eurheartj/ehw450 · Cited by 338 · cited 1×
“001 Introduction Developing our understanding of how modifiable social, behavioural and physiological factors influence risk of disease is of vital importance to improve effective medical treatment and preventative interventions (Abraham et al., 2016).”
BackgroundEffects of Cigarette Smoking on Spatial Working Memory and Attentional Deficits in Schizophrenia
Sacco, K. A., Termine, A., Seyal, A. A., Dudas, M. M., Vessicchio, J. C., Krishnan‐Sarin, S., Jatlow, P. I., Wexler, B. E., & George, T. P. (2005) · Archives of General Psychiatry · doi:10.1001/archpsyc.62.6.649 · Cited by 331
Timpson, N. J., Nordestgaard, B. G., Harbord, R. M., Zacho, J., Frayling, T. M., Tybjærg-Hansen, A., & Davey Smith, G. (2011) · International Journal of Obesity · doi:10.1038/ijo.2010.137 · Cited by 310
Genetic correlates of social stratification in Great Britain
Abdellaoui, A., Hugh-Jones, D., Yengo, L., Kemper, K. E., Nivard, M. G., Veul, L., Holtz, Y., Zietsch, B. P., Frayling, T. M., Wray, N. R., et al. (2019) · Nature Human Behaviour · doi:10.1038/s41562-019-0757-5 · Cited by 261
Major, T. J., Topless, R., Dalbeth, N., & Merriman, T. R. (2018) · BMJ · doi:10.1136/bmj.k3951 · Cited by 248 · cited 1×
“A recent study has suggested that genetic factors may have a greater impact on serum urate levels than environmental factors such as diet (Major et al., 2018).”
BackgroundProspects for using risk scores in polygenic medicine
Lewis, C., & Vassos, E. (2017) · Genome Medicine · doi:10.1186/s13073-017-0489-y · Cited by 172 · cited 1×
“As such, they hold considerable potential to improve early disease prognosis and treatment plan formulation (Lewis and Vassos, 2017).”
BackgroundFritsche, L. G., Gruber, S. B., Wu, Z., Schmidt, E. M., Zawistowski, M., Moser, S. E., Blanc, V. M., Brummett, C. M., Kheterpal, S., Abecasis, G. R., et al. (2018) · The American Journal of Human Genetics · doi:10.1016/j.ajhg.2018.04.001 · Cited by 152
Phenome-wide analysis of genome-wide polygenic scores
Krapohl, E. M. L., Euesden, J., Zabaneh, D., Pingault, J., Rimfeld, K., von Stumm, S., Dale, P. S., Breen, G. D., O’Reilly, P. F., & Plomin, R. J. (2015) · Molecular Psychiatry · doi:10.1038/mp.2015.126 · Cited by 147 · cited 1×
“Such endeavours are commonly referred to as phenome-wide association studies (Denny et al., 2013; Fritsche et al., 2018; Krapohl et al., 2016; Millard et al., 2015).”
BackgroundPSEUDO-R 2 IN LOGISTIC REGRESSION MODEL
Hu, B., Shao, J., & Palta, M. (2006) · Statistica Sinica · Cited by 141
The many weak instruments problem and Mendelian randomization
Davies, N. M., von Hinke Kessler Scholder, S., Farbmacher, H., Burgess, S., Windmeijer, F., & Smith, G. D. (2015) · Statistics in Medicine · doi:10.1002/sim.6358 · Cited by 140 · cited 2×
“For these analyses we only used SNPs with p<5 10 08 as instrumental variables to reduce the likelihood of weak instrument bias in our analysis (Davies et al., 2015).”
MethodSelf-citationCai, T., Zhang, Y., Ho, Y.-L. A., Link, N., Sun, J., Huang, J., Cai, T. A., Damrauer, S. M., Ahuja, Y., Honerlaw, J. P., et al. (2018) · JAMA Cardiology · doi:10.1001/jamacardio.2018.2287 · Cited by 114 · cited 1×
“Such efforts can help identify evidence supporting established causal relationships, as well as potentially implicating novel ones (Davey Smith and Hemani, 2014; Cai et al., 2018).”
BackgroundMillard, L. A. C., Davies, N. M., Timpson, N. J., Tilling, K. M., Flach, P. A., & Smith, G. D. (2015) · Scientific Reports · doi:10.1038/srep16645 · Cited by 104
Relationship between hypertriglyceridemia and uric acid production in primary gout
Matsubara, K., Matsuzawa, Y., Jiao, S., Takama, T., Kubo, M., & Tarui, S. (1989) · Metabolism · doi:10.1016/0026-0495(89)90110-8 · Cited by 64
Wootton, R. E., Richmond, R. C., Stuijfzand, B. G., et al. (2018) · bioRxiv (Cold Spring Harbor Laboratory) · doi:10.1101/381301 · Cited by 59
Polygenic analysis of inflammatory disease variants and effects on microglia in the aging brain
Felsky, D., Patrick, E., Schneider, J. A., Mostafavi, S., Gaiteri, C., Patsopoulos, N. A., Bennett, D. A., & Jager, P. L. D. (2018) · Molecular Neurodegeneration · doi:10.1186/s13024-018-0272-6 · Cited by 44 · cited 1×
“SNPs which are known to be pleiotropic with large effects on different and diverse traits have been found to distort findings from PRS analyses (Felsky et al., 2018).”
BackgroundThe approach to predictive medicine that is taking genomics research by storm
Warren, M. (2018) · Nature · doi:10.1038/d41586-018-06956-3 · Cited by 34 · cited 1×
“The application of PRS is a topic which has sparked considerable recent debate, particularly concerning whether scores are relevant for clinical decision making (Warren, 2018).”
BackgroundGenetic Consequences of Social Stratification in Great BritainPreprint
Abdellaoui, A., Hugh-Jones, D., Kemper, K. E., et al. (2018) · bioRxiv (Cold Spring Harbor Laboratory) · doi:10.1101/457515 · Cited by 19
Research works printed but not linked: 1
- Hu, 2006, Pseudo-R2 in logistic regression model, Statistica Sinica, 16, 847
Cited by
Sorted by citations
Mendelian Randomization: Concepts and Scope
Richmond, R. C., & Davey Smith, G. (2022) · Cold Spring Harbor Perspectives in Medicine · doi:10.1101/cshperspect.a040501 · Cited by 841
The Polygenic Score Catalog as an open database for reproducibility and systematic evaluation
Lambert, S. A., Gil, L., Jupp, S., Ritchie, S. C., Xu, Y., Buniello, A., McMahon, A., Abraham, G., Chapman, M., Parkinson, H., et al. (2021) · Nature Genetics · doi:10.1038/s41588-021-00783-5 · Cited by 709
A brief history of human disease genetics
Claussnitzer, M., Cho, J. H., Collins, R., Cox, N. J., Dermitzakis, E. T., Hurles, M. E., Kathiresan, S., Kenny, E. E., Lindgren, C. M., MacArthur, D. G., et al. (2020) · Nature · doi:10.1038/s41586-019-1879-7 · Cited by 697
Cano-Gamez, E., & Trynka, G. (2020) · Frontiers in Genetics · doi:10.3389/fgene.2020.00424 · Cited by 613
“Polygenic risk scores performance has increased as GWAS studies increased in sample sizes and larger validation cohorts became available, as shown in CAD (Ripatti et al., 2010; Mega et al., 2015; Abraham et al., 2016; Khera et al., 2016) and cancer (Garcia-Closas et al., 2013; Mavaddat et al., 2015; Maas et al., 2016).”
BackgroundInfluentialGenetics meets proteomics: perspectives for large population-based studies
Suhre, K., McCarthy, M. I., & Schwenk, J. M. (2021) · Nature Reviews Genetics · doi:10.1038/s41576-020-0268-2 · Cited by 478
Metadata
- Authors
- Richardson, T. G., Harrison, S., Hemani, G., & Davey Smith, G.
- Affiliations
- University of Bristol (GB)
- MRC Integrative Epidemiology Unit (IEU), Population Health Sciences, Bristol Medical School, University of Bristol, Bristol, United Kingdom
- Corresponding author
- Richardson, Tom G
- Venue
- eLife
- Publisher
- eLife Sciences Publications, Ltd
- Published
- 2019-03-05
- Volume
- 8
- ISSN
- 2050-084X (ISSN-L)
- PMC
- PMC6400585
- OpenAlex
- W2899836172
- Cited by
- 198
- References
- 48
- Citations by year
- 2026: 12 · 2025: 10 · 2024: 24 · 2023: 14 · 2022: 37 · 2021: 41 · 2020: 44 · 2019: 16
- FWCI
- 20.94
- Type
- journal article
- Language
- en
- Open access
- gold
- doi.org
- Licence
- Locations
- eLife (publishedVersion, cc-by)
- bioRxiv (Cold Spring Harbor Laboratory) (acceptedVersion, cc-by)
- Europe PMC (PubMed Central) (publishedVersion, cc-by)
- PubMed Central (publishedVersion, cc-by)
- PubMed (publishedVersion)
- Explore Bristol Research (publishedVersion, cc-by)
- Bristol Research (University of Bristol) (acceptedVersion, other-oa)
- DOAJ (DOAJ: Directory of Open Access Journals) (submittedVersion, cc-by-sa)
- Funders
- Medical Research Council (MC_UU_00011/1)
- Wellcome Trust (208806/Z/17/Z)
- Health Data Research UK (MR/S003886/1)
- Topics
- Life Sciences › Biochemistry, Genetics and Molecular Biology › Genetics › Genetic Associations and Epidemiology
- Life Sciences › Biochemistry, Genetics and Molecular Biology › Genetics › Genetic and phenotypic traits in livestock
- Life Sciences › Biochemistry, Genetics and Molecular Biology › Genetics › Genetic Mapping and Diversity in Plants and Animals
- Keywords
- polygenic risk score, phenome-wide association study, schizophrenia, genetic susceptibility, cognitive function, causal relationship, Mendelian randomization, mediation analysis, multivariable Mendelian randomization, complex disease susceptibility, heritable traits, UK Biobank, web application
- MeSH terms
- United Kingdom, Humans, Schizophrenia, Risk Assessment, Genetic Predisposition to Disease, Multifactorial Inheritance, Databases, Genetic, Genome-Wide Association Study
About these checks
Registry, retraction, Cites and statistics results are computed, not judged, with one exception: a printed reference that no index lists is read once by a model before it counts as a citation error. Claims are extracted by a model and kept only when their quote appears verbatim in the text; each cited source is then checked, with a model’s help, for whether it says what the claim relies on. Those verdicts can be wrong — read the claim’s quote and the cited source before relying on one.
Statistics and arithmetic are recomputed, not judged.
Confidence bands are shown only for fields calibrated on our annotated test set. None is calibrated yet, so no band is shown.
What counts as a claim ›How we measure confidence ›How we check this ›
Are you an author, or do you see a problem with this page? Request a review
