

The DOI matches its Crossref record; 53 of the 54 references it cites were found in a registry or an index; 16 of the 34 sources its claims cite were checked for support.
GENESPACE tracks regions of interest and gene copy number variation across multiple genomes
Open accessPublished version of a preprint
Abstract
The development of multiple chromosome-scale reference genome sequences in many taxonomic groups has yielded a high-resolution view of the patterns and processes of molecular evolution. Nonetheless, leveraging information across multiple genomes remains a significant challenge in nearly all eukaryotic systems. These challenges range from studying the evolution of chromosome structure, to finding candidate genes for quantitative trait loci, to testing hypotheses about speciation and adaptation. Here, we present GENESPACE, which addresses these challenges by integrating conserved gene order and orthology to define the expected physical position of all genes across multiple genomes. We demonstrate this utility by dissecting presence–absence, copy-number, and structural variation at three levels of biological organization: spanning 300 million years of vertebrate sex chromosome evolution, across the diversity of the Poaceae (grass) plant family, and among 26 maize cultivars. The methods to build and visualize syntenic orthology in the GENESPACE R package offer a significant addition to existing gene family and synteny programs, especially in polyploid, outbred, and other complex genomes.
Overview
AI snapshot
Written from the paper’s full text.
TL;DR
GENESPACE is an R package/pipeline that integrates conserved gene order (synteny) and orthology to build pan-genome annotations and track presence–absence, copy-number, and structural variation across multiple genomes. It outperformed OrthoFinder and MCScanX in single-copy orthogroup and syntenic block recovery across diverse plant and vertebrate comparisons, including polyploid and recently diverged genomes.
Key findings
- Across seven genome pairs, GENESPACE increased the percentage of genes in single-copy orthogroups and single-copy syntenic blocks versus OrthoFinder/MCScanX; for cotton, single-copy orthogroups rose from 35.6% (OrthoFinder) to 85.7% (GENESPACE) and single-copy syntenic blocks from 14.1% (orthogroup-constrained MCScanX) to 96.2% (GENESPACE).
- In vertebrate sex chromosome comparisons, a 91.7 M bp region is shared between human X and sand lizard Z, representing 59.0% of human X genic sequence; 107.2 M bp (68.8%) of human X is syntenic with 77.8 M bp (93.9%) of Tasmanian devil X; chicken Z is retained across five avian genomes except for a budgie partial fusion with a 19.5 M bp segment of chicken chromosome 11.
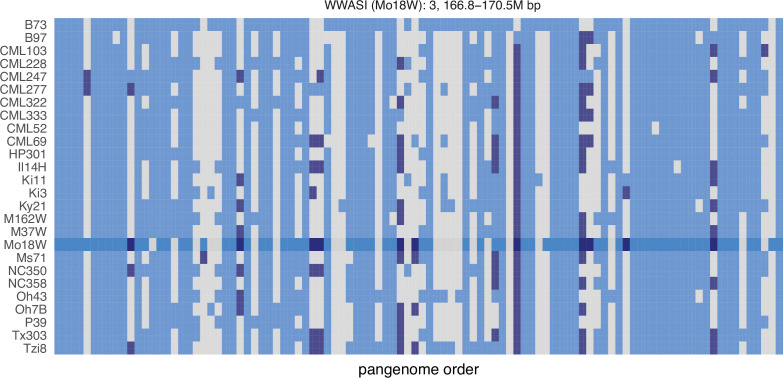
- For 86 C3/C4 photosynthesis genes, absence was lower than background (9.7% vs. 38.2%, odds ratio = 5.7, p < 1 × 10⁻¹⁶), but C3 species had more absences than C4 species (15.3% vs. 5.5%, odds ratio = 3.1, p = 6.25 × 10⁻⁸); among 190 maize NAM QTLs, three had single-parent outlier effects, and the two Mo18W QTL regions fell within an 11.7 M bp Mo18W-specific inversion.
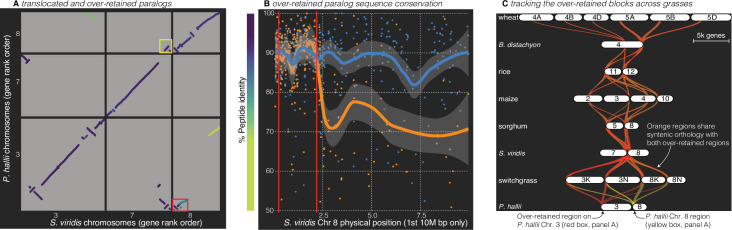
- Rho WGD paralogs were less conserved than primary syntenic orthologs (median peptide identity 90.6% vs. 71.4%, 26.9% more similar; Wilcoxon p < 1 × 10⁻¹⁶), except one over-retained S. viridis chromosome 8 region where paralogs were not significantly less conserved (91.6% vs. 91.9%, p = 0.13).
Methods
- GENESPACE takes gff3 annotations and peptide FASTAs, computes DIAMOND2 BLAST-like hits, runs OrthoFinder for orthogroups, extracts syntenic regions with MCScanX-based and graph/cluster approaches, condenses tandem arrays to representative genes, and collapses syntenic orthogroups into a reference-anchored pan-genome annotation.
- Analyses used seven haploid genome pairs spanning <0.01 Mya maize to 310 Mya human–chicken, 15 avian/mammalian genomes plus two reptile outgroups, eight grass genomes, and 26 maize NAM founders; public annotations were downloaded on or before October 8, 2021.
- Comparisons calculated percent genes in single-copy orthogroups and single-copy syntenic blocks; statistics included Wilcoxon signed rank tests, ungapped percent peptide identity from Needleman–Wunsch alignments, and Grubbs tests for outliers, using R 4.1.2 and GENESPACE v0.9.3.
Limitations
- Stated: only a single C3/C4 phylogenetic split prevents testing evolutionary hypotheses about causes of PAV; the phylogenetic scale precludes inference about the origin of shared sex chromosome sequences; and it is not clear that within-block OrthoFinder improves much over global orthogroups for purely haploid genomes.
- Stated/evident: GENESPACE relies on syntenic regions, so errors in syntenic block coordinates can have major downstream effects; true orthologs can exist outside syntenic regions, with 1096 non-syntenic human–chimpanzee orthologs (6.3% of all orthologs) and 9002 non-syntenic Sorghum–Brachypodium orthologs.
- Evident: results depend on parameterization, outgroup choice, and ploidy treatment; polyploids had only a primary haplotype assembled into chromosomes, maize was treated as diploid in the multispecies run but haploid in the NAM run, and some maize alternative haplotype scaffolds were dropped.
Model-written summary. Check it against the paper before relying on it.
Integrity signals
Registry
Cites
Statistics
Figures
Verification
Claims the paper makes
32 Own interpretation · 30 Own result · 24 No basis given · 9 Partly supported · 6 Sources not found · 5 Not checked yet · 4 Own method · 3 No full text of the sources · 2 Supported · accuracy not yet measured
The cited sources support only part of this claim — read each source’s verdict below.
In the paper
“The physical position of homologs offers a second line of evidence that can help overcome challenges posed by WGDs, tandem arrays, heterozygous-duplicated regions, and other genomic complexities (Drillon et al., 2020; Haug-Baltzell et al., 2017; Wang et al., 2012).”
§ GENESPACE tracks regions of interest and gene copy number variation across multiple genomes > Introduction
What the sources say
- Partly supportedcites Drillon et al., 2020 sourceExperimental — accuracy not yet measured
Materials and Methods (Synteny Blocks; Testing the Conservation of Block Adjacencies) uses the positions and adjacency of homologous genes as phylogenetic evidence. The PhyChro Algorithm section says the method is designed to handle duplicated blocks, and Results (Robustness of PhyChro) includes simulated whole-genome duplications. The copy does not establish that this evidence overcomes challenges from tandem arrays or heterozygous-duplicated regions specifically. (LLM, conf=0.87)
- Partly supportedcites Haug-Baltzell et al., 2017 sourceExperimental — accuracy not yet measured
The Introduction says synteny can be inferred from colinear sets of homologous genes, supporting the use of their genomic positions as evidence. The Description and §2.1 say the tools help visualize polyploidy, but our copy does not address overcoming challenges from tandem arrays or heterozygous-duplicated regions. (LLM, conf=0.86)
- Partly supportedcites Wang et al., 2012 sourceExperimental — accuracy not yet measured
The Methods section, “Classification of duplicate gene origins,” uses chromosome order and collinear position to distinguish tandem from WGD/segmental duplicates, supporting the value of homolog position for those complexities. The passages do not address heterozygous-duplicated regions or show that positional evidence overcomes that challenge; page numbers were unavailable in our copy. (LLM, conf=0.86)
plainconditional- Asserted: passes — The authors put it forward as true.
- Checkable: passes — It can be checked against evidence.
- Load-bearing: passes — The paper’s conclusions depend on it.
- Based: passes — The paper gives a reason why it holds.
- Partly supported
The cited sources support only part of this claim — read each source’s verdict below.
In the paper
“For example, by exploring only syntenic orthologs it is possible to examine all putatively functional variants within a genomic region of interest, even those in genes that are absent in the focal reference genome (Lovell et al., 2018).”
§ GENESPACE tracks regions of interest and gene copy number variation across multiple genomes > Introduction
What the sources say
- Partly supportedcites Lovell et al., 2018 sourceExperimental — accuracy not yet measured
The Results section on de novo genomes reports that synteny-based analysis identified genes lacking annotated orthologous sequence in one genome, supporting the point about genes absent from a focal reference. But the Methods section on variant annotation limits SNP and indel calls to HAL2–FIL2 orthologs; it does not show that examining only syntenic orthologs captures all putatively functional variants in a region, including variants in absent genes. Page numbers are not available in our copy. (LLM, conf=0.86)
hedgeddirect- Asserted: passes — The authors put it forward as true.
- Checkable: passes — It can be checked against evidence.
- Load-bearing: passes — The paper’s conclusions depend on it.
- Based: passes — The paper gives a reason why it holds.
- Partly supported
The cited sources support only part of this claim — read each source’s verdict below.
In the paper
“GENESPACE is ideally suited for this type of exploration, and indeed was originally designed to solve this problem between the two P. hallii reference genomes and their F2 progeny (Lovell et al., 2018) using synteny to project the positions of genes across multiple genomes onto the physical positions of a reference.”
§ GENESPACE tracks regions of interest and gene copy number variation across multiple genomes > Results and discussion > Exploiting synteny to track candidate genes in grasses
What the sources say
- Partly supportedcites Lovell et al., 2018 sourceExperimental — accuracy not yet measured
The Results section, “Development and comparison of two complete de novo genomes” (page unavailable), identifies GENESPACE as the authors’ pipeline for comparing the HAL2 and FIL2 genomes using synteny-constrained gene networks. The Methods section, “Comparative genomics” (page unavailable), describes orthology inference within syntenic blocks, but does not say the pipeline was designed to project gene positions onto a reference or to solve a problem involving the F2 progeny. The paper describes F2 genetic-map construction separately. (LLM, conf=0.85)
plaindirect- Asserted: passes — The authors put it forward as true.
- Checkable: passes — It can be checked against evidence.
- Load-bearing: unclear — It is unclear whether the paper’s conclusions depend on it.
- Based: passes — The paper gives a reason why it holds.
- Partly supported
The cited sources support only part of this claim — read each source’s verdict below.
In the paper
“Like most plant families (Barker et al., 2016; Stebbins, 1950; One Thousand Plant Transcriptomes Initiative, 2019), but unlike nearly all animal lineages (Muller, 1925), the grasses radiated following a whole-genome duplication: the ~70 M ya Rho WGD.”
§ GENESPACE tracks regions of interest and gene copy number variation across multiple genomes > Results and discussion > Studying the WGD that led to the diversification of the grasses
What the sources say
- Partly supportedcites Barker et al., 2016 sourceExperimental — accuracy not yet measured
The section “Prevalence of autopolyploids and allopolyploids within plant genera” says genomic research has revealed a history of polyploidy throughout plant evolution, supporting the sentence’s broad plant-lineage comparison. It does not establish that most plant families radiated after a duplication, or identify the grasses’ Rho duplication or its ~70-million-year date. (LLM, conf=0.80)
- Not checked — no full text of the sourcecites Stebbins, 1950 source
- Partly supportedcites One Thousand Plant Transcriptomes Initiative, 2019 sourceExperimental — accuracy not yet measured
The ‘Integrated analysis of genome evolution’ section reports ancient whole-genome duplications across plant lineages and lags between duplication and increased species diversity. It does not identify a grass Rho duplication, date it to approximately 70 million years ago, or establish that grass radiation followed that event. No page number is available in our copy. (LLM, conf=0.84)
plaindirect- Asserted: passes — The authors put it forward as true.
- Checkable: passes — It can be checked against evidence.
- Load-bearing: passes — The paper’s conclusions depend on it.
- Based: passes — The paper gives a reason why it holds.
- Partly supported
Every source the paper cites for this claim was checked and supports it.
In the paper
“however, with GENESPACE and the recently released NAM parent genomes (Hufford et al., 2021), it is now possible to evaluate candidate genes present in the genomes of other NAM founder lines but either absent or unannotated in the B73 reference genome.”
§ GENESPACE tracks regions of interest and gene copy number variation across multiple genomes > Results and discussion > Exploiting synteny to track candidate genes in grasses
What the sources say
- Supportedcites Hufford et al., 2021 source
The citation identifies the source of the NAM parent genomes, rather than attributing GENESPACE or the citing authors’ proposed analysis to Hufford et al. The paper’s “Consistency and quality of genome assemblies” section states that it provides assembled and annotated genomes for all 25 NAM founder inbreds and B73; its Summary also reports variation in their gene complements. Page numbers are not available in our copy. (LLM, conf=0.92)
hedgeddirect- Asserted: passes — The authors put it forward as true.
- Checkable: passes — It can be checked against evidence.
- Load-bearing: passes — The paper’s conclusions depend on it.
- Based: passes — The paper gives a reason why it holds.
- Supported
A result the paper reports from its own data — it cites no other source for it, so there is none to check. The quote shows it is in the paper.
In the paper
“We demonstrate this utility by dissecting presence–absence, copy-number, and structural variation at three levels of biological organization: spanning 300 million years of vertebrate sex chromosome evolution, across the diversity of the Poaceae (grass) plant family, and among 26 maize cultivars.”
§ GENESPACE tracks regions of interest and gene copy number variation across multiple genomes > Abstract
boosted- Asserted: passes — The authors put it forward as true.
- Checkable: passes — It can be checked against evidence.
- Load-bearing: passes — The paper’s conclusions depend on it.
- Based: passes — The paper gives a reason why it holds.
The paper states this without a source or data behind it here, so there is nothing to check it against. The quote shows it is in the paper.
In the paper
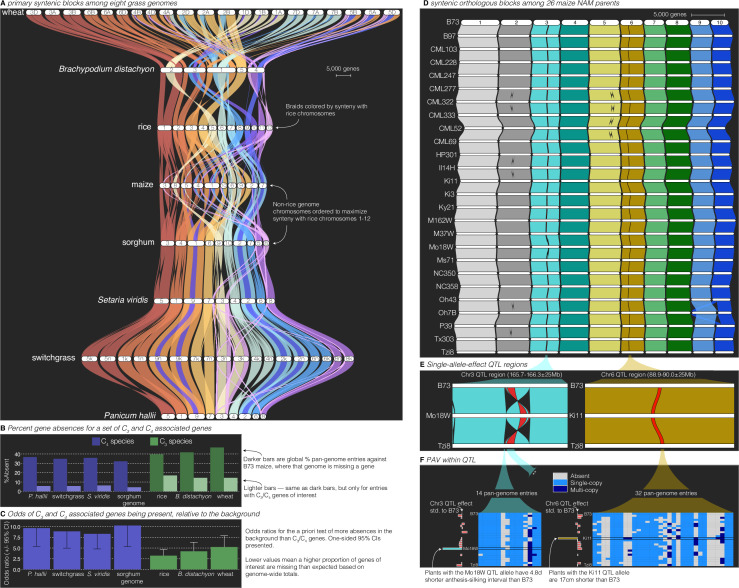
“Given that many of these genes were discovered in part because of sequence similarity to genes in Arabidopsis and other diverged plant species, it is not surprising that PAV among C3/C4 genes was lower than the background (9.7% vs. 38.2%, odds ratio = 5.7, p < 1 × 10⁻¹⁶; Figure 3B).”
§ GENESPACE tracks regions of interest and gene copy number variation across multiple genomes > Results and discussion > Exploiting synteny to track candidate genes in grasses
plain- Asserted: passes — The authors put it forward as true.
- Checkable: passes — It can be checked against evidence.
- Load-bearing: passes — The paper’s conclusions depend on it.
- Based: passes — The paper gives a reason why it holds.
A result the paper reports from its own data — it cites no other source for it, so there is none to check. The quote shows it is in the paper.
In the paper
“Default parameters produced a largely contiguous map of synteny even across notoriously difficult comparisons like the paleo-homeologs between the maize subgenomes (Figure 3A).”
§ GENESPACE tracks regions of interest and gene copy number variation across multiple genomes > Results and discussion > Exploiting synteny to track candidate genes in grasses
plaindirect- Asserted: passes — The authors put it forward as true.
- Checkable: passes — It can be checked against evidence.
- Load-bearing: passes — The paper’s conclusions depend on it.
- Based: passes — The paper gives a reason why it holds.
In the paper
“cultivar ‘Ki11’ contributed an allele that reduced plant height under drought at a QTL on chromosome 6 (‘Chr6’) (Li et al., 2016).”
§ GENESPACE tracks regions of interest and gene copy number variation across multiple genomes > Results and discussion > Exploiting synteny to track candidate genes in grasses
What the sources say
- Not matchedcites Li et al., 2016
Couldn’t be matched to a paper in Crossref, so it can’t be checked.
plaindirect- Asserted: passes — The authors put it forward as true.
- Checkable: passes — It can be checked against evidence.
- Load-bearing: unclear — It is unclear whether the paper’s conclusions depend on it.
- Based: passes — The paper gives a reason why it holds.
- Not matched
A result the paper reports from its own data — it cites no other source for it, so there is none to check. The quote shows it is in the paper.
In the paper
“However, S. viridis chromosome 8 contained a single over-retained paralogous region.”
§ GENESPACE tracks regions of interest and gene copy number variation across multiple genomes > Results and discussion > Studying the WGD that led to the diversification of the grasses
plainSingle case- Asserted: passes — The authors put it forward as true.
- Checkable: passes — It can be checked against evidence.
- Load-bearing: unclear — It is unclear whether the paper’s conclusions depend on it.
- Based: passes — The paper gives a reason why it holds.
- Probably not a substantial claim. 35
- It may state two separate claims as one. 30
The cited sources support only part of this claim — read each source’s verdict below.
In the paper
“Other sequence similarity approaches such as OrthoFinder (Emms and Kelly, 2019; Emms and Kelly, 2015) leverage graphs and gene trees to test for orthology, permitting more robust analyses in systems with gene copy number (CNV) or presence–absence variation (PAV).”
§ GENESPACE tracks regions of interest and gene copy number variation across multiple genomes > Introduction
What the sources say
- Partly supportedcites Emms and Kelly, 2019 sourceExperimental — accuracy not yet measured
The Methods (OrthoFinder workflow; page not provided) describe inferring orthogroups and gene trees, then using the trees to identify orthologs and gene duplications. The Methods (Species tree inference and rooting; page not provided) also describe handling multi-copy orthogroups and cases where no one-to-one orthologs are present in all species. Our copy does not establish the claimed use of graphs or specifically demonstrate more robust analyses in systems with CNV or PAV. (LLM, conf=0.84)
- Partly supportedcites Emms and Kelly, 2015 sourceExperimental — accuracy not yet measured
The Methodological overview describes a graph-based algorithm for inferring orthogroups, and the Discussion reports robustness to missing genes. But the Algorithm implementation section says OrthoFinder does not classify pairwise gene relationships; gene trees are used to validate inferred orthogroups, not as part of the inference algorithm. The paper also does not establish the claimed robustness specifically for CNV or PAV systems. (LLM, conf=0.88)
plaindirect- Asserted: passes — The authors put it forward as true.
- Checkable: passes — It can be checked against evidence.
- Load-bearing: fails — The paper’s conclusions may not depend on it.
- Based: passes — The paper gives a reason why it holds.
Probably not a substantial claim. The paper’s conclusions may not depend on it. It may state two separate claims as one.
- Partly supported
The cited sources support only part of this claim — read each source’s verdict below.
In the paper
“The eutherian mammalian X chromosome is largely composed of two regions, an X-conserved ancestral sex chromosome region that arose in the common ancestor of therian mammals, and an X-added region that arose in the common ancestor of eutherians (Ross et al., 2005).”
§ GENESPACE tracks regions of interest and gene copy number variation across multiple genomes > Results and discussion > Synteny-anchored exploration of vertebrate sex chromosomes
What the sources say
- Partly supportedcites Ross et al., 2005 sourceExperimental — accuracy not yet measured
Split into 2 atoms — 0 confirmed, 2 partially supported, 0 disputed, 0 misattributed, 0 unverifiable. Expand the claim to see per-atom verdicts.
plain- Asserted: passes — The authors put it forward as true.
- Checkable: passes — It can be checked against evidence.
- Load-bearing: unclear — It is unclear whether the paper’s conclusions depend on it.
- Based: passes — The paper gives a reason why it holds.
It may state two separate claims as one.
- Partly supported
The cited sources support only part of this claim — read each source’s verdict below.
In the paper
“In some taxa, synteny is preserved across hundreds of millions of years of evolution and is retained over multiple WGDs (Jiao et al., 2014; Simakov et al., 2020; Zhao and Schranz, 2019).”
§ GENESPACE tracks regions of interest and gene copy number variation across multiple genomes > Introduction
What the sources say
- Not checked — no full text of the sourcecites Jiao et al., 2014 source
- Supportedcites Simakov et al., 2020 source
The ‘Amphioxus chromosomes reflect ancestral chordate linkages’ section says physical linkage has remained conserved since lineages diverged more than half a billion years ago. ‘Patterns of duplication and fusion in early vertebrate evolution’ describes conserved macro-synteny that supports two distinct tetraploidizations in bony vertebrate history. The paper defines synteny here as physical linkage, not preservation of gene order. (LLM, conf=0.92)
- Partly supportedcites Zhao and Schranz, 2019 sourceExperimental — accuracy not yet measured
The Results and Discussion (no page available) describe conserved syntenic clusters and say some clusters could have been maintained through several rounds of whole-genome duplication. The paper states that the mammalian and angiosperm lineages studied evolved over approximately 170 million years (introductory text; no page available), but does not establish preservation across hundreds of millions of years. (LLM, conf=0.86)
plain- Asserted: passes — The authors put it forward as true.
- Checkable: passes — It can be checked against evidence.
- Load-bearing: passes — The paper’s conclusions depend on it.
- Based: passes — The paper gives a reason why it holds.
It may state two separate claims as one.
Every source the paper cites for this claim was checked and supports it.
In the paper
“Such ‘private’ allelic contributions in multi-parent populations offer a powerful opportunity to define high-confidence candidates as genes with parent-specific sequences that match parent-specific allelic contributions to phenotypic trait variation (Abdulkina et al., 2019).”
§ GENESPACE tracks regions of interest and gene copy number variation across multiple genomes > Results and discussion > Exploiting synteny to track candidate genes in grasses
What the sources say
- Supportedcites Abdulkina et al., 2019 source
Split into 2 atoms — 2 confirmed, 0 partially supported, 0 disputed, 0 misattributed, 0 unverifiable. Expand the claim to see per-atom verdicts.
boostedcorrelational- Asserted: passes — The authors put it forward as true.
- Checkable: passes — It can be checked against evidence.
- Load-bearing: passes — The paper’s conclusions depend on it.
- Based: passes — The paper gives a reason why it holds.
Probably not a substantial claim.
- Supported
The cited sources support only part of this claim — read each source’s verdict below.
In the paper
“As an example of the exploration of lists of a priori-defined candidate genes, we analyzed PAV of 86 genes shown to be involved in the transition between C3 and C4 photosynthesis (Ding et al., 2015), the latter permitting ecological dominance in arid climates and agricultural productivity under forecasted increased heat load of the next century.”
§ GENESPACE tracks regions of interest and gene copy number variation across multiple genomes > Results and discussion > Exploiting synteny to track candidate genes in grasses
What the sources say
- Partly supportedcites Ding et al., 2015 sourceExperimental — accuracy not yet measured
The Results section ('Identification of C4 candidate genes'; page unavailable) identifies 128 candidate genes whose expression patterns may relate to the C3-to-C4 transition, not 86 genes shown to be involved. The Discussion ('Identification of additional C4 genes'; page unavailable) says the number essential for establishing C4 metabolism remains unknown and that candidates require further characterization. (LLM, conf=0.88)
plain- Asserted: passes — The authors put it forward as true.
- Checkable: passes — It can be checked against evidence.
- Load-bearing: fails — The paper’s conclusions may not depend on it.
- Based: passes — The paper gives a reason why it holds.
Probably not a substantial claim. The paper’s conclusions may not depend on it.
- Partly supported
The cited sources support only part of this claim — read each source’s verdict below.
In the paper
“Like chromosome-scale synteny, conserved gene order collinearity along local regions of chromosomes can provide evidence of homology, and in some cases enable determination of whether two regions diverged as a result of speciation or a large-scale duplication event (Drillon et al., 2020).”
§ GENESPACE tracks regions of interest and gene copy number variation across multiple genomes > Introduction
What the sources say
- Partly supportedcites Drillon et al., 2020 sourceExperimental — accuracy not yet measured
The Materials and Methods section (‘Synteny Blocks’; page unavailable) identifies conserved orthologous gene order in chromosomal segments, supporting the claim that local collinearity provides evidence of homology. But the ‘Breakpoints’ section says blocks derived from duplications are not explicitly considered in the analysis. Our copy does not support the further claim that this approach determines whether two regions diverged through speciation or large-scale duplication. (LLM, conf=0.87)
plaincorrelational- Asserted: passes — The authors put it forward as true.
- Checkable: passes — It can be checked against evidence.
- Load-bearing: passes — The paper’s conclusions depend on it.
- Based: passes — The paper gives a reason why it holds.
It may state two separate claims as one.
- Partly supported
The paper states this without a source or data behind it here, so there is nothing to check it against. The quote shows it is in the paper.
In the paper
“In contrast, the 50 M ya diverged Sorghum and Brachypodium genomes have 9002 non-syntenic orthologs, many of which are the result of over-retained Rho WGD-derived paralogs (see below).”
§ GENESPACE tracks regions of interest and gene copy number variation across multiple genomes > Results and discussion > GENESPACE syntenic orthology methods to compare multiple complex genomes
plaindirect- Asserted: passes — The authors put it forward as true.
- Checkable: passes — It can be checked against evidence.
- Load-bearing: unclear — It is unclear whether the paper’s conclusions depend on it.
- Based: passes — The paper gives a reason why it holds.
It may state two separate claims as one.
A result the paper reports from its own data — it cites no other source for it, so there is none to check. The quote shows it is in the paper.
In the paper
“However, this approach is less sensitive than the default performance and is suggested for only closely related haploid genomes, as the recall of 2:2:2 OGs is less sensitive than the default specification.”
§ GENESPACE tracks regions of interest and gene copy number variation across multiple genomes > Materials and methods > GENESPACE pipeline: estimating syntenic orthogroups
plaindirect- Asserted: passes — The authors put it forward as true.
- Checkable: passes — It can be checked against evidence.
- Load-bearing: unclear — It is unclear whether the paper’s conclusions depend on it.
- Based: passes — The paper gives a reason why it holds.
It may state two separate claims as one.
A result the paper reports from its own data — it cites no other source for it, so there is none to check. The quote shows it is in the paper.
In the paper
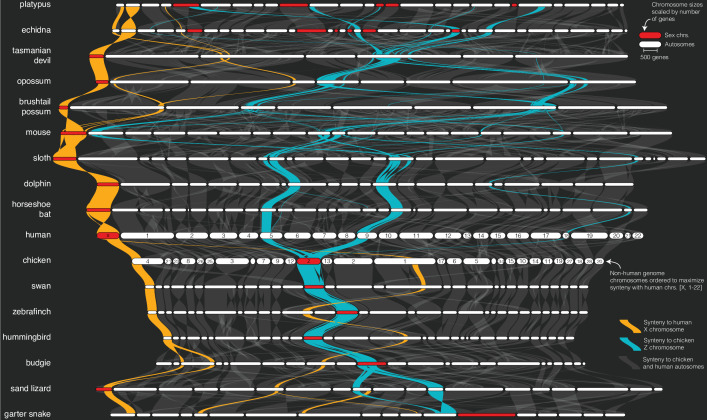
“Further, a 107.2 M bp (68.8%) segment of the human X, which corresponds with the X-conserved region, is syntenic with 77.8 M bp (93.9%) of the Tasmanian devil X chromosome and represents the entire syntenic region between the human and all three marsupial X chromosomes (Figure 2).”
§ GENESPACE tracks regions of interest and gene copy number variation across multiple genomes > Results and discussion > Synteny-anchored exploration of vertebrate sex chromosomes
plaincorrelational- Asserted: passes — The authors put it forward as true.
- Checkable: passes — It can be checked against evidence.
- Load-bearing: passes — The paper’s conclusions depend on it.
- Based: passes — The paper gives a reason why it holds.
It may state two separate claims as one.
The paper states this without a source or data behind it here, so there is nothing to check it against. The quote shows it is in the paper.
In the paper
“This method results in significant speed improvements with little loss of fidelity among closely related haploid genomes.”
§ GENESPACE tracks regions of interest and gene copy number variation across multiple genomes > Materials and methods > GENESPACE pipeline: estimating syntenic orthogroups
plaindirect- Asserted: passes — The authors put it forward as true.
- Checkable: passes — It can be checked against evidence.
- Load-bearing: fails — The paper’s conclusions may not depend on it.
- Based: fails — The paper may give no reason why it holds.
Probably not a substantial claim. The paper’s conclusions may not depend on it. The paper may give no reason why it holds. It may state two separate claims as one.
The paper states this without a source or data behind it here, so there is nothing to check it against. The quote shows it is in the paper.
In the paper
“Non-homeologous paralogs are typically excluded in the default GENESPACE parameterization.”
§ GENESPACE tracks regions of interest and gene copy number variation across multiple genomes > Materials and methods > Additional considerations for comparative genomics parameterization
plain- Asserted: passes — The authors put it forward as true.
- Checkable: passes — It can be checked against evidence.
- Load-bearing: fails — The paper’s conclusions may not depend on it.
- Based: passes — The paper gives a reason why it holds.
Probably not a substantial claim. The paper’s conclusions may not depend on it.
A result the paper reports from its own data — it cites no other source for it, so there is none to check. The quote shows it is in the paper.
In the paper
“we were surprised to find that the two Mo18W QTL regions exist within a 11.7 M bp derived inversion that is only found in the Mo18W genome (Figure 3D, E).”
§ GENESPACE tracks regions of interest and gene copy number variation across multiple genomes > Results and discussion > Exploiting synteny to track candidate genes in grasses
plaincorrelationalSingle case- Asserted: passes — The authors put it forward as true.
- Checkable: passes — It can be checked against evidence.
- Load-bearing: passes — The paper’s conclusions depend on it.
- Based: passes — The paper gives a reason why it holds.
It may state two separate claims as one.
The paper states this without a source or data behind it here, so there is nothing to check it against. The quote shows it is in the paper.
In the paper
“Hence, both maize homeologous regions are present in the across grasses synteny graph (Figure 3A) despite using identical synteny parameters to the maize NAM parent run.”
§ GENESPACE tracks regions of interest and gene copy number variation across multiple genomes > Materials and methods > Additional considerations for comparative genomics parameterization
plain- Asserted: passes — The authors put it forward as true.
- Checkable: passes — It can be checked against evidence.
- Load-bearing: unclear — It is unclear whether the paper’s conclusions depend on it.
- Based: passes — The paper gives a reason why it holds.
It may state two separate claims as one.
- Rests on an assumption: The coalescence of any two maize genotypes occurred more recently than the ~12M ya whole-genome duplication.
The paper states this without a source or data behind it here, so there is nothing to check it against. The quote shows it is in the paper.
In the paper
“For example, there are 1096 non-syntenic orthologs (6.3% of all orthologs) between human and chimpanzee.”
§ GENESPACE tracks regions of interest and gene copy number variation across multiple genomes > Results and discussion > GENESPACE syntenic orthology methods to compare multiple complex genomes
plain- Asserted: passes — The authors put it forward as true.
- Checkable: passes — It can be checked against evidence.
- Load-bearing: fails — The paper’s conclusions may not depend on it.
- Based: passes — The paper gives a reason why it holds.
Probably not a substantial claim. The paper’s conclusions may not depend on it.
The paper states this without a source or data behind it here, so there is nothing to check it against. The quote shows it is in the paper.
In the paper
“it will be far better to set orthofinderInBlk to TRUE, so that pairs of genomes are considered and genes without a solid hit in the outgroup are not excluded.”
§ GENESPACE tracks regions of interest and gene copy number variation across multiple genomes > Materials and methods > Additional considerations for comparative genomics parameterization
plaindirect- Asserted: passes — The authors put it forward as true.
- Checkable: passes — It can be checked against evidence.
- Load-bearing: fails — The paper’s conclusions may not depend on it.
- Based: passes — The paper gives a reason why it holds.
Probably not a substantial claim. The paper’s conclusions may not depend on it. It may state two separate claims as one.
The paper states this without a source or data behind it here, so there is nothing to check it against. The quote shows it is in the paper.
In the paper
“however, it is not clear that this offers much improvement over global orthogroups between purely haploid genomes.”
§ GENESPACE tracks regions of interest and gene copy number variation across multiple genomes > Materials and methods > GENESPACE pipeline: estimating syntenic orthogroups
hedged- Asserted: passes — The authors put it forward as true.
- Checkable: passes — It can be checked against evidence.
- Load-bearing: fails — The paper’s conclusions may not depend on it.
- Based: fails — The paper may give no reason why it holds.
Probably not a substantial claim. The paper’s conclusions may not depend on it. The paper may give no reason why it holds.
The paper states this without a source or data behind it here, so there is nothing to check it against. The quote shows it is in the paper.
In the paper
“While these genes do not have functional annotations relating to drought,”
§ GENESPACE tracks regions of interest and gene copy number variation across multiple genomes > Results and discussion > Exploiting synteny to track candidate genes in grasses
plain- Asserted: passes — The authors put it forward as true.
- Checkable: passes — It can be checked against evidence.
- Load-bearing: fails — The paper’s conclusions may not depend on it.
- Based: passes — The paper gives a reason why it holds.
Probably not a substantial claim. The paper’s conclusions may not depend on it.
The paper states this without a source or data behind it here, so there is nothing to check it against. The quote shows it is in the paper.
In the paper
“GENESPACE was originally designed for work with plants”
§ GENESPACE tracks regions of interest and gene copy number variation across multiple genomes > Materials and methods > Additional considerations for comparative genomics parameterization
plain- Asserted: passes — The authors put it forward as true.
- Checkable: passes — It can be checked against evidence.
- Load-bearing: fails — The paper’s conclusions may not depend on it.
- Based: passes — The paper gives a reason why it holds.
Probably not a substantial claim. The paper’s conclusions may not depend on it.
A result the paper reports from its own data — it cites no other source for it, so there is none to check. The quote shows it is in the paper.
In the paper
“For example, in the comparison between human and chicken, GENESPACE resolved 2% and 1.8% more single-copy orthogroups and syntenic blocks than default OrthoFinder and orthogroup-constrained MCScanX, respectively.”
§ GENESPACE tracks regions of interest and gene copy number variation across multiple genomes > Results and discussion > GENESPACE syntenic orthology methods to compare multiple complex genomes
plaindirectSingle case- Asserted: passes — The authors put it forward as true.
- Checkable: passes — It can be checked against evidence.
- Load-bearing: unclear — It is unclear whether the paper’s conclusions depend on it.
- Based: passes — The paper gives a reason why it holds.
It may state two separate claims as one.
A result the paper reports from its own data — it cites no other source for it, so there is none to check. The quote shows it is in the paper.
In the paper
“However, these ratios were highly variable among genomes, particularly among the C3 species (wheat, rice, B. distachyon), which had far more absences than the C4 species (15.3% vs. 5.5%, odds ratio = 3.1, p = 6.25 × 10⁻⁸, Figure 3B).”
§ GENESPACE tracks regions of interest and gene copy number variation across multiple genomes > Results and discussion > Exploiting synteny to track candidate genes in grasses
plaincorrelational- Asserted: passes — The authors put it forward as true.
- Checkable: passes — It can be checked against evidence.
- Load-bearing: unclear — It is unclear whether the paper’s conclusions depend on it.
- Based: passes — The paper gives a reason why it holds.
It may state two separate claims as one.
A result the paper reports from its own data — it cites no other source for it, so there is none to check. The quote shows it is in the paper.
In the paper
“Interestingly, the entirety of the echidna X4 and 47.6 M bp (67.9%) of the genic region of the platypus X5 chromosomes are syntenic with the avian Z chromosome (Figure 2).”
§ GENESPACE tracks regions of interest and gene copy number variation across multiple genomes > Results and discussion > Synteny-anchored exploration of vertebrate sex chromosomes
plaincorrelational- Asserted: passes — The authors put it forward as true.
- Checkable: passes — It can be checked against evidence.
- Load-bearing: unclear — It is unclear whether the paper’s conclusions depend on it.
- Based: passes — The paper gives a reason why it holds.
It may state two separate claims as one.
The paper states this without a source or data behind it here, so there is nothing to check it against. The quote shows it is in the paper.
In the paper
“GENESPACE offers an ‘outgroup’ parameter, which specifies the genomes that should be included in the orthofinder run but excluded from all downstream analyses.”
§ GENESPACE tracks regions of interest and gene copy number variation across multiple genomes > Materials and methods > Additional considerations for comparative genomics parameterization
plain- Asserted: passes — The authors put it forward as true.
- Checkable: passes — It can be checked against evidence.
- Load-bearing: passes — The paper’s conclusions depend on it.
- Based: passes — The paper gives a reason why it holds.
Probably not a substantial claim.
A result the paper reports from its own data — it cites no other source for it, so there is none to check. The quote shows it is in the paper.
In the paper
“This resulted in 159 pan-genome entries: nearly always two placements for each gene in the paleo-tetraploid maize genome.”
§ GENESPACE tracks regions of interest and gene copy number variation across multiple genomes > Results and discussion > Exploiting synteny to track candidate genes in grasses
plaindirect- Asserted: passes — The authors put it forward as true.
- Checkable: passes — It can be checked against evidence.
- Load-bearing: unclear — It is unclear whether the paper’s conclusions depend on it.
- Based: passes — The paper gives a reason why it holds.
It may state two separate claims as one.
The paper states this without a source or data behind it here, so there is nothing to check it against. The quote shows it is in the paper.
In the paper
“Note that if OrthoFinder was run using the ‘fast’ orthofinderMethod, orthologs will not be produced nor added into the pan-genome annotation.”
§ GENESPACE tracks regions of interest and gene copy number variation across multiple genomes > Materials and methods > GENESPACE pipeline: constructing pan-genome annotations
plaindirect- Asserted: passes — The authors put it forward as true.
- Checkable: passes — It can be checked against evidence.
- Load-bearing: fails — The paper’s conclusions may not depend on it.
- Based: passes — The paper gives a reason why it holds.
Probably not a substantial claim. The paper’s conclusions may not depend on it.
A result the paper reports from its own data — it cites no other source for it, so there is none to check. The quote shows it is in the paper.
In the paper
“further, the only genome with complete segregation of the two paralogs, wheat, also retains these regions in the center of all six chromosomes (Figure 4C).”
§ GENESPACE tracks regions of interest and gene copy number variation across multiple genomes > Results and discussion > Studying the WGD that led to the diversification of the grasses
plaincorrelationalSingle case- Asserted: passes — The authors put it forward as true.
- Checkable: passes — It can be checked against evidence.
- Load-bearing: passes — The paper’s conclusions depend on it.
- Based: passes — The paper gives a reason why it holds.
It may state two separate claims as one.
The paper states this without a source or data behind it here, so there is nothing to check it against. The quote shows it is in the paper.
In the paper
“However, whole-genome duplications (WGDs), chromosomal deletions, and variable rates of sequence evolution, such as subgenome dominance in polyploids, can confound the evidence of orthology from sequence similarity alone.”
§ GENESPACE tracks regions of interest and gene copy number variation across multiple genomes > Introduction
plaindirect- Asserted: passes — The authors put it forward as true.
- Checkable: passes — It can be checked against evidence.
- Load-bearing: passes — The paper’s conclusions depend on it.
- Based: fails — The paper may give no reason why it holds.
Probably not a substantial claim. The paper may give no reason why it holds.
In the paper
“consistent with the previous discovery that the Rho duplication predated the split among most extant grasses (Ma et al., 2021).”
§ GENESPACE tracks regions of interest and gene copy number variation across multiple genomes > Results and discussion > Studying the WGD that led to the diversification of the grasses
What the sources say
- Not matchedcites Ma et al., 2021
Couldn’t be matched to a paper in Crossref, so it can’t be checked.
plain- Asserted: passes — The authors put it forward as true.
- Checkable: passes — It can be checked against evidence.
- Load-bearing: fails — The paper’s conclusions may not depend on it.
- Based: passes — The paper gives a reason why it holds.
Probably not a substantial claim. The paper’s conclusions may not depend on it.
- Not matched
The paper states this without a source or data behind it here, so there is nothing to check it against. The quote shows it is in the paper.
In the paper
“Paralogs derived from these WGDs notoriously obscure contrasts between orthologs in these systems.”
§ GENESPACE tracks regions of interest and gene copy number variation across multiple genomes > Results and discussion > GENESPACE syntenic orthology methods to compare multiple complex genomes
boosteddirect- Asserted: passes — The authors put it forward as true.
- Checkable: passes — It can be checked against evidence.
- Load-bearing: passes — The paper’s conclusions depend on it.
- Based: fails — The paper may give no reason why it holds.
Probably not a substantial claim. The paper may give no reason why it holds.
The paper states this without a source or data behind it here, so there is nothing to check it against. The quote shows it is in the paper.
In the paper
“There are two major violations of this assumption that cause copy number variation within a syntenic block: (1) tandem arrays and (2) gene PAV.”
§ GENESPACE tracks regions of interest and gene copy number variation across multiple genomes > Results and discussion > GENESPACE syntenic orthology methods to compare multiple complex genomes
plaindirect- Asserted: passes — The authors put it forward as true.
- Checkable: passes — It can be checked against evidence.
- Load-bearing: passes — The paper’s conclusions depend on it.
- Based: passes — The paper gives a reason why it holds.
Probably not a substantial claim.
- The authors state this as an assumption: Homologs should be exactly single copy within any syntenic region between a pair of genomes.
A conclusion the paper draws from its own results — it cites no other source for it, so there is none to check. The quote shows it is in the paper.
In the paper
“however, the defaults are sufficient for most high-quality genomes and evolutionary scenarios.”
§ GENESPACE tracks regions of interest and gene copy number variation across multiple genomes > Materials and methods > GENESPACE pipeline: extracting syntenic blast hits
plain- Asserted: passes — The authors put it forward as true.
- Checkable: passes — It can be checked against evidence.
- Load-bearing: fails — The paper’s conclusions may not depend on it.
- Based: passes — The paper gives a reason why it holds.
Probably not a substantial claim. The paper’s conclusions may not depend on it.
The paper states this without a source or data behind it here, so there is nothing to check it against. The quote shows it is in the paper.
In the paper
“Given GENESPACE’s reliance on syntenic regions between genomes, errors in syntenic block coordinates can have major effects on downstream estimates.”
§ GENESPACE tracks regions of interest and gene copy number variation across multiple genomes > Results and discussion > GENESPACE syntenic orthology methods to compare multiple complex genomes
plaindirect- Asserted: passes — The authors put it forward as true.
- Checkable: passes — It can be checked against evidence.
- Load-bearing: passes — The paper’s conclusions depend on it.
- Based: passes — The paper gives a reason why it holds.
Probably not a substantial claim.
A conclusion the paper draws from its own results — it cites no other source for it, so there is none to check. The quote shows it is in the paper.
In the paper
“Since we want to extract PAV by physical coordinates, all syntenic orthogroups, even those that do not include a reference genome gene model, need to have reference positional information.”
§ GENESPACE tracks regions of interest and gene copy number variation across multiple genomes > Materials and methods > GENESPACE pipeline: constructing pan-genome annotations
plaindirect- Asserted: passes — The authors put it forward as true.
- Checkable: passes — It can be checked against evidence.
- Load-bearing: passes — The paper’s conclusions depend on it.
- Based: passes — The paper gives a reason why it holds.
Probably not a substantial claim.
A conclusion the paper draws from its own results — it cites no other source for it, so there is none to check. The quote shows it is in the paper.
In the paper
“Nonetheless, the mammalian X and sand lizard Z chromosomes partially share syntenic orthology, an outcome that would be consistent with common descent from a shared ancestral sex chromosome or autosome containing sex-related genes.”
§ GENESPACE tracks regions of interest and gene copy number variation across multiple genomes > Results and discussion > Synteny-anchored exploration of vertebrate sex chromosomes
hedgedconditionalSingle case- Asserted: passes — The authors put it forward as true.
- Checkable: passes — It can be checked against evidence.
- Load-bearing: passes — The paper’s conclusions depend on it.
- Based: passes — The paper gives a reason why it holds.
It may state two separate claims as one.
The paper states this without a source or data behind it here, so there is nothing to check it against. The quote shows it is in the paper.
In the paper
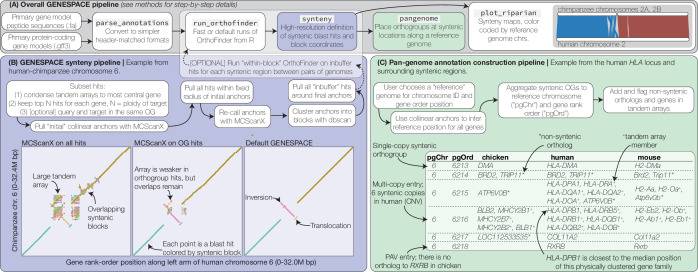
“These issues boil down to a simple circular problem: a priori knowledge of gene copy number is needed to effectively infer orthology and synteny, yet measures of synteny and orthology are needed to infer copy number between a pair of sequences.”
§ GENESPACE tracks regions of interest and gene copy number variation across multiple genomes > Results and discussion > GENESPACE syntenic orthology methods to compare multiple complex genomes
plaindirect- Asserted: passes — The authors put it forward as true.
- Checkable: passes — It can be checked against evidence.
- Load-bearing: passes — The paper’s conclusions depend on it.
- Based: fails — The paper may give no reason why it holds.
Probably not a substantial claim. The paper may give no reason why it holds. It may state two separate claims as one.
A conclusion the paper draws from its own results — it cites no other source for it, so there is none to check. The quote shows it is in the paper.
In the paper
“First, physically proximate multigene families (hereon, ‘tandem arrays’, Box 1) are condensed to the physically most central gene of the array. Gene rank order along the genome is recalculated on these ‘array representative’ genes, effectively masking copy number variation due to tandem arrays.”
§ GENESPACE tracks regions of interest and gene copy number variation across multiple genomes > Results and discussion > GENESPACE syntenic orthology methods to compare multiple complex genomes
plaindirect- Asserted: passes — The authors put it forward as true.
- Checkable: passes — It can be checked against evidence.
- Load-bearing: passes — The paper’s conclusions depend on it.
- Based: passes — The paper gives a reason why it holds.
It may state two separate claims as one.
What the paper did — it cites no source for this, so there is none to check. The quote shows it is in the paper.
In the paper
“As such, we treated all genomes as haploid and did not include an outgroup; therefore, orthogroups should not include homeologs since the genomes share a common ancestor that arose after the WGD (see ‘additional considerations’ methods section: Outgroups and the phylogenetic context of orthology inference).”
§ GENESPACE tracks regions of interest and gene copy number variation across multiple genomes > Results and discussion > GENESPACE syntenic orthology methods to compare multiple complex genomes
plaindirect- Asserted: passes — The authors put it forward as true.
- Checkable: passes — It can be checked against evidence.
- Load-bearing: passes — The paper’s conclusions depend on it.
- Based: passes — The paper gives a reason why it holds.
It may state two separate claims as one.
- Rests on an assumption: The genomes in each comparison share a common ancestor that arose after the WGD.
A conclusion the paper draws from its own results — it cites no other source for it, so there is none to check. The quote shows it is in the paper.
In the paper
“Here, we presented the GENESPACE R package as a framework to help bridge the current gaps between comparative and quantitative genomics, especially in complex evolutionary systems.”
§ GENESPACE tracks regions of interest and gene copy number variation across multiple genomes > Results and discussion > Conclusions
plain- Asserted: passes — The authors put it forward as true.
- Checkable: fails — It may be too vague to check against evidence.
- Load-bearing: passes — The paper’s conclusions depend on it.
- Based: passes — The paper gives a reason why it holds.
Probably not a substantial claim. It may be too vague to check against evidence.
What the paper did — it cites no source for this, so there is none to check. The quote shows it is in the paper.
In the paper
“The orthologs and syntenic mapping between these versions are included as text files in the data repository.”
§ GENESPACE tracks regions of interest and gene copy number variation across multiple genomes > Materials and methods > Description of the vignettes
plain- Asserted: passes — The authors put it forward as true.
- Checkable: passes — It can be checked against evidence.
- Load-bearing: fails — The paper’s conclusions may not depend on it.
- Based: passes — The paper gives a reason why it holds.
Probably not a substantial claim. The paper’s conclusions may not depend on it.
In the paper
“Such a ‘pan-genome annotation’ framework (Lovell et al., 2021a) permits access to multi-genome networks of high-confidence orthologs and paralogs, regardless of ploidy or other complicating aspects of genome biology.”
§ GENESPACE tracks regions of interest and gene copy number variation across multiple genomes > Introduction
What the sources say
- Not matchedcites Lovell et al., 2021a
Couldn’t be matched to a paper in Crossref, so it can’t be checked.
plaindirect- Asserted: passes — The authors put it forward as true.
- Checkable: passes — It can be checked against evidence.
- Load-bearing: passes — The paper’s conclusions depend on it.
- Based: passes — The paper gives a reason why it holds.
Probably not a substantial claim.
- Not matched
What the paper did — it cites no source for this, so there is none to check. The quote shows it is in the paper.
In the paper
“The reference pan-genome built in step 3 only acts on direct syntenic blast hits (edges), which allows for strict construction of interpolated positions without the potential polluting positional effects of orthogroups in minor or miss-assembled syntenic blocks.”
§ GENESPACE tracks regions of interest and gene copy number variation across multiple genomes > Materials and methods > GENESPACE pipeline: constructing pan-genome annotations
plaindirect- Asserted: passes — The authors put it forward as true.
- Checkable: passes — It can be checked against evidence.
- Load-bearing: passes — The paper’s conclusions depend on it.
- Based: passes — The paper gives a reason why it holds.
Probably not a substantial claim.
A conclusion the paper draws from its own results — it cites no other source for it, so there is none to check. The quote shows it is in the paper.
In the paper
“Since the final coding of blocks is conducted within broad syntenic regions, the parameters passed should be robust to variation in ploidy and sequence divergence between genomes.”
§ GENESPACE tracks regions of interest and gene copy number variation across multiple genomes > Materials and methods > GENESPACE pipeline: extracting syntenic blast hits
hedgedconditional- Asserted: passes — The authors put it forward as true.
- Checkable: passes — It can be checked against evidence.
- Load-bearing: fails — The paper’s conclusions may not depend on it.
- Based: fails — The paper may give no reason why it holds.
Probably not a substantial claim. The paper’s conclusions may not depend on it. The paper may give no reason why it holds.
In the paper
“While the same or similar genomic regions often recurrently evolve into sex chromosomes, perhaps due to ancestral gene functions involved in gonadogenesis, evidence about the nonrandomness of sex chromosome evolution is still contentious (Kratochvíl et al., 2021).”
§ GENESPACE tracks regions of interest and gene copy number variation across multiple genomes > Results and discussion > Synteny-anchored exploration of vertebrate sex chromosomes
What the sources say
- Not checked — no full text of the sourcecites Kratochvíl et al., 2021 source
plain- Asserted: passes — The authors put it forward as true.
- Checkable: passes — It can be checked against evidence.
- Load-bearing: fails — The paper’s conclusions may not depend on it.
- Based: passes — The paper gives a reason why it holds.
Probably not a substantial claim. The paper’s conclusions may not depend on it.
A conclusion the paper draws from its own results — it cites no other source for it, so there is none to check. The quote shows it is in the paper.
In the paper
“Since inversions reduce recombination, it is possible that multiple Mo18W causal variants have been fixed in linkage disequilibrium in this NAM population.”
§ GENESPACE tracks regions of interest and gene copy number variation across multiple genomes > Results and discussion > Exploiting synteny to track candidate genes in grasses
hedgedcorrelational- Asserted: passes — The authors put it forward as true.
- Checkable: passes — It can be checked against evidence.
- Load-bearing: fails — The paper’s conclusions may not depend on it.
- Based: passes — The paper gives a reason why it holds.
Probably not a substantial claim. The paper’s conclusions may not depend on it.
- Rests on an assumption: Inversions reduce recombination.
A conclusion the paper draws from its own results — it cites no other source for it, so there is none to check. The quote shows it is in the paper.
In the paper
“GENESPACE resolves this circular problem by operating on a foundational assumption: homologs should be exactly single copy within any syntenic region between a pair of genomes.”
§ GENESPACE tracks regions of interest and gene copy number variation across multiple genomes > Results and discussion > GENESPACE syntenic orthology methods to compare multiple complex genomes
plaindirect- Asserted: passes — The authors put it forward as true.
- Checkable: passes — It can be checked against evidence.
- Load-bearing: passes — The paper’s conclusions depend on it.
- Based: fails — The paper may give no reason why it holds.
Probably not a substantial claim. The paper may give no reason why it holds.
- The authors state this as an assumption: Homologs should be exactly single copy within any syntenic region between a pair of genomes.
A conclusion the paper draws from its own results — it cites no other source for it, so there is none to check. The quote shows it is in the paper.
In the paper
“However, we do not want to rely on single-copy references, so GENESPACE allows multiple placements not only for each nonreference gene, but also for genes in the reference genome itself.”
§ GENESPACE tracks regions of interest and gene copy number variation across multiple genomes > Materials and methods > GENESPACE pipeline: constructing pan-genome annotations
plaindirect- Asserted: passes — The authors put it forward as true.
- Checkable: passes — It can be checked against evidence.
- Load-bearing: passes — The paper’s conclusions depend on it.
- Based: passes — The paper gives a reason why it holds.
It may state two separate claims as one.
None of the sources cited for this claim have been checked yet.
In the paper
“For example, maize is an 11.4 M ya paleo-polyploid (Gaut and Doebley, 1997), allo-tetraploid switchgrass formed 4–6 M ya (Lovell et al., 2021b), and allo-hexaploid bread wheat arose about 8 k ya (Haas et al., 2019).”
§ GENESPACE tracks regions of interest and gene copy number variation across multiple genomes > Results and discussion > Exploiting synteny to track candidate genes in grasses
What the sources say
plain- Asserted: passes — The authors put it forward as true.
- Checkable: passes — It can be checked against evidence.
- Load-bearing: fails — The paper’s conclusions may not depend on it.
- Based: passes — The paper gives a reason why it holds.
Probably not a substantial claim. The paper’s conclusions may not depend on it. It may state two separate claims as one.
A conclusion the paper draws from its own results — it cites no other source for it, so there is none to check. The quote shows it is in the paper.
In the paper
“The incorporation of synteny and orthology into comparative genomics and quantitative genetics pipelines offers a mechanism to bridge these disparate disciplines.”
§ GENESPACE tracks regions of interest and gene copy number variation across multiple genomes > Results and discussion > Conclusions
plaindirect- Asserted: passes — The authors put it forward as true.
- Checkable: fails — It may be too vague to check against evidence.
- Load-bearing: passes — The paper’s conclusions depend on it.
- Based: fails — The paper may give no reason why it holds.
Probably not a substantial claim. It may be too vague to check against evidence. The paper may give no reason why it holds.
In the paper
“OrthoFinder can also use gene trees to split orthogroups into pairwise orthologs (Emms and Kelly, 2019), which represent a stricter definition of orthology.”
§ GENESPACE tracks regions of interest and gene copy number variation across multiple genomes > Materials and methods > GENESPACE pipeline: estimating syntenic orthogroups
What the sources say
- Not checked yetcites Emms and Kelly, 2019 source
plaindirect- Asserted: passes — The authors put it forward as true.
- Checkable: passes — It can be checked against evidence.
- Load-bearing: passes — The paper’s conclusions depend on it.
- Based: passes — The paper gives a reason why it holds.
Probably not a substantial claim. It may state two separate claims as one.
A conclusion the paper draws from its own results — it cites no other source for it, so there is none to check. The quote shows it is in the paper.
In the paper
“Combined, the historical abundance of genetic mapping studies and ongoing proliferation of genome resources provides a strong foundation for the integration of comparative and quantitative genomics to accelerate discoveries in evolutionary biology, medicine, and agriculture.”
§ GENESPACE tracks regions of interest and gene copy number variation across multiple genomes > Results and discussion > Conclusions
boosteddirect- Asserted: passes — The authors put it forward as true.
- Checkable: fails — It may be too vague to check against evidence.
- Load-bearing: passes — The paper’s conclusions depend on it.
- Based: fails — The paper may give no reason why it holds.
Probably not a substantial claim. It may be too vague to check against evidence. The paper may give no reason why it holds.
A conclusion the paper draws from its own results — it cites no other source for it, so there is none to check. The quote shows it is in the paper.
In the paper
“Here, we present GENESPACE, an analytical pipeline that explicitly links synteny and sequence similarity to provide high-confidence inference about networks of genes that share a common ancestor and represents these networks as a ‘pan-genome annotation’.”
§ GENESPACE tracks regions of interest and gene copy number variation across multiple genomes > Introduction
plaincorrelational- Asserted: passes — The authors put it forward as true.
- Checkable: passes — It can be checked against evidence.
- Load-bearing: passes — The paper’s conclusions depend on it.
- Based: passes — The paper gives a reason why it holds.
It may state two separate claims as one.
A conclusion the paper draws from its own results — it cites no other source for it, so there is none to check. The quote shows it is in the paper.
In the paper
“Nonetheless, this result suggests a possible role of gene loss or gain as an evolutionary mechanism for drought- and heat-adapted photosynthesis.”
§ GENESPACE tracks regions of interest and gene copy number variation across multiple genomes > Results and discussion > Exploiting synteny to track candidate genes in grasses
hedgedconditional- Asserted: passes — The authors put it forward as true.
- Checkable: passes — It can be checked against evidence.
- Load-bearing: fails — The paper’s conclusions may not depend on it.
- Based: passes — The paper gives a reason why it holds.
Probably not a substantial claim. The paper’s conclusions may not depend on it.
The paper states this without a source or data behind it here, so there is nothing to check it against. The quote shows it is in the paper.
In the paper
“Despite the tremendous genetic resources of these and other grasses, genomic comparisons among grasses are difficult, in part because of an ancient polyploid origin (see the next section), and because subsequent WGDs are a feature of most clades of grasses.”
§ GENESPACE tracks regions of interest and gene copy number variation across multiple genomes > Results and discussion > Exploiting synteny to track candidate genes in grasses
plaindirect- Asserted: passes — The authors put it forward as true.
- Checkable: passes — It can be checked against evidence.
- Load-bearing: passes — The paper’s conclusions depend on it.
- Based: passes — The paper gives a reason why it holds.
It may state two separate claims as one.
A conclusion the paper draws from its own results — it cites no other source for it, so there is none to check. The quote shows it is in the paper.
In the paper
“Second, synteny is inferred in a pairwise manner only using ‘potential anchor’ protein BLAST hits (hereon ‘hits’) where both the query and target genes are in the same orthogroup. The rank-order positions of these potential anchor genes are also recalculated prior to synteny inference, which effectively masks orthogroups missing a gene in one genome (i.e., PAV).”
§ GENESPACE tracks regions of interest and gene copy number variation across multiple genomes > Results and discussion > GENESPACE syntenic orthology methods to compare multiple complex genomes
plaindirect- Asserted: passes — The authors put it forward as true.
- Checkable: passes — It can be checked against evidence.
- Load-bearing: passes — The paper’s conclusions depend on it.
- Based: passes — The paper gives a reason why it holds.
It may state two separate claims as one.
None of the sources cited for this claim have been checked yet.
In the paper
“Only the first X chromosomes are ancestral to both echidna and platypus (Rens et al., 2007), and all are unrelated to the mammalian X chromosomes (Figure 2—figure supplement 1), consistent with their independent evolution (Rens et al., 2007).”
§ GENESPACE tracks regions of interest and gene copy number variation across multiple genomes > Results and discussion > Synteny-anchored exploration of vertebrate sex chromosomes
What the sources say
- Not checked yetcites Rens et al., 2007 source
Checked before — its earlier verdict is held back until a new check runs.
plain- Asserted: passes — The authors put it forward as true.
- Checkable: passes — It can be checked against evidence.
- Load-bearing: unclear — It is unclear whether the paper’s conclusions depend on it.
- Based: passes — The paper gives a reason why it holds.
It may state two separate claims as one.
- Not checked yet
A conclusion the paper draws from its own results — it cites no other source for it, so there is none to check. The quote shows it is in the paper.
In the paper
“Given our analysis, the avian Z chromosome clearly did not evolve from either of the two reptile Z chromosomes sampled here, but instead likely arose from autosomal regions or unsampled ancestral sex chromosomes.”
§ GENESPACE tracks regions of interest and gene copy number variation across multiple genomes > Results and discussion > Synteny-anchored exploration of vertebrate sex chromosomes
boosted- Asserted: passes — The authors put it forward as true.
- Checkable: passes — It can be checked against evidence.
- Load-bearing: passes — The paper’s conclusions depend on it.
- Based: passes — The paper gives a reason why it holds.
It may state two separate claims as one.
The paper states this without a source or data behind it here, so there is nothing to check it against. The quote shows it is in the paper.
In the paper
“In some cases, homeologous gene duplications from polyploidy have generated genetic diversity that can be targeted for crop improvement; however, in other cases the genetic basis of trait variation may be restricted to sequences that arose in a single subgenome.”
§ GENESPACE tracks regions of interest and gene copy number variation across multiple genomes > Results and discussion > Exploiting synteny to track candidate genes in grasses
hedgedconditional- Asserted: passes — The authors put it forward as true.
- Checkable: passes — It can be checked against evidence.
- Load-bearing: passes — The paper’s conclusions depend on it.
- Based: fails — The paper may give no reason why it holds.
Probably not a substantial claim. The paper may give no reason why it holds. It may state two separate claims as one.
What the paper did — it cites no source for this, so there is none to check. The quote shows it is in the paper.
In the paper
“All results were generated programmatically; the accompanying scripts and key output are available on github: jtlovell/GENESPACE_data.”
§ GENESPACE tracks regions of interest and gene copy number variation across multiple genomes > Materials and methods > GENESPACE pipeline and analysis overview
plain- Asserted: passes — The authors put it forward as true.
- Checkable: passes — It can be checked against evidence.
- Load-bearing: fails — The paper’s conclusions may not depend on it.
- Based: passes — The paper gives a reason why it holds.
Probably not a substantial claim. The paper’s conclusions may not depend on it. It may state two separate claims as one.
The authors state this as an assumption.
Homologs should be exactly single copy within any syntenic region between a pair of genomes.
“GENESPACE resolves this circular problem by operating on a foundational assumption: homologs should be exactly single copy within any syntenic region between a pair of genomes.”
The paper relies on this without support.
The three vertebrate genome comparisons have no recent history of WGDs, while WGDs predated evolutionary divergence of the four plant contrasts.
“The three comparisons between vertebrate genomes have no recent history of WGDs, while WGDs predated evolutionary divergence of the four plant contrasts: maize is a 12 M ya paleo-tetraploid, cotton is a 1.6 M ya meso-tetraploid, and the ~70 M ya Rho WGD predated grass diversification.”
The paper relies on this without support.
The genomes in each comparison share a common ancestor that arose after the WGD.
“As such, we treated all genomes as haploid and did not include an outgroup; therefore, orthogroups should not include homeologs since the genomes share a common ancestor that arose after the WGD (see ‘additional considerations’ methods section: Outgroups and the phylogenetic context of orthology inference).”
The paper relies on this without support.
The heteromorphic chromosomes (Y and W) are often unassembled, or, where assemblies exist, lack sufficient synteny to provide a useful metric for comparative genomics.
“The heteromorphic chromosomes (Y and W) are often unassembled, or, where assemblies exist, lack sufficient synteny to provide a useful metric for comparative genomics.”
The paper relies on this without support.
Many genetic mapping populations now have reference genome sequences for all parents.
“However, many genetic mapping populations now have reference genome sequences for all parents; this offers an opportunity to explore variation among functional alleles and PAV, which would be impossible with a single reference genome.”
The paper relies on this without support.
Inversions reduce recombination.
“Since inversions reduce recombination, it is possible that multiple Mo18W causal variants have been fixed in linkage disequilibrium in this NAM population.”
The paper relies on this without support.
In most pairwise comparisons between genomes, some syntenic orthogroups will be missing in the reference.
“In most pairwise comparisons between genomes, some syntenic orthogroups will be missing in the reference.”
The paper relies on this without support.
Most plant lineages have undergone one or more whole-genome duplications.
“most plant lineages have undergone one or more WGDs”
The paper relies on this without support.
The coalescence of any two maize genotypes occurred more recently than the ~12M ya whole-genome duplication.
“the coalescence of any two maize genotypes occurred more recently than the ~12M ya WGD”
Self-check
Percentages, sums and reported differences re-computed from the paper’s own numbers.
Each contradiction between two passages listed here was confirmed by an independent check.
Rated minor: it would not touch a result — a value no result rests on, a p-value that stays on the same side of the significance level, or a conflict that is clerical, resolved elsewhere in the paper, or outside its own findings.
In the paper
§ GENESPACE tracks regions of interest and gene copy number variation across multiple genomes > Materials and methods > Description of the vignettes
“All GENESPACE runs used default parameterization, with the following exceptions: (1) the Rho grass run allowed a single secondary hit (default is 0, this is how the paralogs are explicitly searched for) and maximum number of gaps in secondary regions of 10 (default is 5, relaxed to reduce ancient paralogous block splitting), and (2) the maize run used the ‘fast’ OrthoFinder method”
§ GENESPACE tracks regions of interest and gene copy number variation across multiple genomes > Results and discussion > GENESPACE syntenic orthology methods to compare multiple complex genomes
“to avoid confusion between subgenomes, blkSize, and nGaps parameters were increased from 5 (default) to 10 genes.”
Citations
Cites
Wickham, H. (2016) · Use R! · doi:10.1007/978-3-319-24277-4 · Cited by 34,873
The igraph software package for complex network research
Csárdi, G., & Nepusz, T. (2006) · Medical Entomology and Zoology · Cited by 10,078
OrthoFinder: phylogenetic orthology inference for comparative genomics
Emms, D. M., & Kelly, S. (2019) · Genome Biology · doi:10.1186/s13059-019-1832-y · Cited by 7,676
Self-citationMCScanX: a toolkit for detection and evolutionary analysis of gene synteny and collinearity
Wang, Y., Tang, H., DeBarry, J. D., Tan, X., Li, J., Wang, X., Lee, T.-H., Jin, H., Marler, B., Guo, H., et al. (2012) · Nucleic Acids Research · doi:10.1093/nar/gkr1293 · Cited by 7,093
Phytozome: a comparative platform for green plant genomics
Goodstein, D. M., Shu, S., Howson, R. W., Neupane, R., Hayes, R. D., Fazo, J., Mitros, T., Dirks, W., Hellsten, U., Putnam, N. H., et al. (2011) · Nucleic Acids Research · doi:10.1093/nar/gkr944 · Cited by 5,509
Self-citationSensitive protein alignments at tree-of-life scale using DIAMOND
Buchfink, B., Reuter, K., & Drost, H.-G. (2021) · Nature Methods · doi:10.1038/s41592-021-01101-x · Cited by 5,097
Emms, D. M., & Kelly, S. (2015) · Genome Biology · doi:10.1186/s13059-015-0721-2 · Cited by 3,408
Self-citationThe Sorghum bicolor genome and the diversification of grasses
Paterson, A. H., Bowers, J., Bruggmann, R., Dubchak, I. L., Grimwood, J., Gundlach, H., Haberer, G., Hellsten, U., Mitros, T., Poliakov, A., et al. (2009) · Nature · doi:10.1038/nature07723 · Cited by 3,150
Self-citationThe complete sequence of a human genome
Nurk, S., Koren, S., Rhie, A., Rautiainen, M., Bzikadze, A. V., Mikheenko, A., Vollger, M. R., Altemose, N., Uralsky, L., Gershman, A., et al. (2022) · Science · doi:10.1126/science.abj6987 · Cited by 3,136
Towards complete and error-free genome assemblies of all vertebrate species
Rhie, A., McCarthy, S. A., Fedrigo, O., Damas, J., Formenti, G., Koren, S., Uliano-Silva, M., Chow, W., Fungtammasan, A., Kim, J., et al. (2021) · Nature · doi:10.1038/s41586-021-03451-0 · Cited by 3,097
Cited by
Sorted by citations
Items 301–392 of 392
The assembly and annotation of two teinturier grapevine varieties, Dakapo and Rubired
Ritter, E. J., Cochetel, N., Minio, A., Cousins, P. S., Cantù, D., & Niederhuth, C. E. (2025) · Gigabyte · doi:10.46471/gigabyte.149
Davis, J. T., Li, Q., Grassa, C. J., Davis, M. W., Strauss, S. Y., Gremer, J. R., Rieseberg, L. H., & Maloof, J. (2025) · G3 Genes Genomes Genetics · doi:10.1093/g3journal/jkaf022
PanVA: a visual analytics tool for pangenomic variant analysisPreprint
van den Brandt, A., de Vries, F., van Esch, R., Vlugter, S., van Workum, D. M., van de Wetering, H., Vilanova, A., & Smit, S. (2025) · bioRxiv (Cold Spring Harbor Laboratory) · doi:10.1101/2025.06.23.661080
Jackson, C. J., McLay, T. G. B., Holmes, G. D., Allnutt, T. R., & ROBINSON, A. S. (2025) · PLoS ONE · doi:10.1371/journal.pone.0322885
Shibata, T., & Uehara, T. (2025) · Methods in molecular biology · doi:10.1007/978-1-0716-4702-8_3
Courtier‐Orgogozo, V. (2025) · eLife · doi:10.7554/elife.107393.1.sa3
Widespread male–female expression imbalance of X-linked genes across phrynosomatid lizards
Hale, M. D., de Mello, P. L. H., Nondorf, D., Robinson, C. D., John‐Alder, H. B., Cox, C. L., & Cox, R. M. (2026) · Molecular Biology and Evolution · doi:10.1093/molbev/msag232
Jarrell, A. F., Hamilton, J. P., Wood, J. C., Vaillancourt, B., Norling, J., Douches, D. S., & Buell, C. R. (2025) · G3 Genes Genomes Genetics · doi:10.1093/g3journal/jkaf253
Lan, W., Wright, S., Barrett, S. C. H., & Bai, W. (2025) · Molecular Ecology · doi:10.1111/mec.70199
Dols-Serrate, D., Tenaguillo-Arriola, I., Pisarenco, V. A., Olivé‐Muñiz, M., Rozas, J., & Riutort, M. (2025) · bioRxiv (Cold Spring Harbor Laboratory) · doi:10.64898/2025.12.11.693146
Nachtigall, P. G., Mason, A. J., Rokyta, D. R., Gibbs, H. L., Grazziotin, F. G., & Junqueira-de-Azevedo, I. L. M. (2025) · Genome Biology and Evolution · doi:10.1093/gbe/evaf243
Contreras‐Moreira, B., Saraf, S., Naamati, G., Casas, A. M., Amberkar, S., Flicek, P., Jones, A. R., & Dyer, S. C. (2023) · Figshare · doi:10.6084/m9.figshare.24257488
Contreras‐Moreira, B., Saraf, S., Naamati, G., Casas, A. M., Amberkar, S., Flicek, P., Jones, A. R., & Dyer, S. C. (2024) · Figshare · doi:10.6084/m9.figshare.24257604
Comparative genomic analysis of Lepidoptera for an integrated understanding of chromosomal evolution
山部, 貴., & Yamabe, T. (2025) · Institutional Repositories DataBase (IRDB)
Nolte, N. (2025) · dCOBISS.SI Digital Repository · doi:10.5281/zenodo.17590759
When cells rebel: a comparative genomics investigation into marsupial cancer susceptibility
Petrohilos, C., Peel, E., Silver, L. W., O'Neill, R. J. W., Grady, P. G. S., Hogg, C. J., & Belov, K. (2026) · Molecular Biology and Evolution · doi:10.1093/molbev/msag010
Pangenome graph analysis reveals evolution of resistance breaking in spinach downy mildew
Skiadas, P., Mendel, M. N., Elberse, J., den Ackerveken, G. F. J. M. V., de Jonge, R., & Seidl, M. F. (2026) · PLoS Biology · doi:10.1371/journal.pbio.3003596
Nojiri, K., Kin, K., Someya, A., Kon, T., Kon‐Nanjo, K., Shimizu, H., Arakawa, K., & Susaki, E. A. (2026) · Genome Biology and Evolution · doi:10.1093/gbe/evag218
Rössner, L.-H., Rössner, C., Kong, D., Lotz, D., Weisert, A., Yamada, Y., Sato, F., Davies, K. M., Rupp, O., Fuchs, J., et al. (2026) · The Plant Cell · doi:10.1093/plcell/koag039
Self-citationBaalsrud, H. T., Tørresen, O. K., Danneels, B., Ferrari, G., Tooming‐Klunderud, A., Skage, M., Kollias, S., Árnyasi, M., Svensen, E., Kukliński, P., et al. (2026) · Journal of Heredity · doi:10.1093/jhered/esag013
Huang, J., Xiao, P.-X., Cui, L., Tan, L., Zhu, S., Ye, J., & Jiao, W. (2026) · Horticulture Research · doi:10.1093/hr/uhag048
Biello, R., Scapolatiello, A., Fava, S., Mora, V. H. M., Palle, S. D., Santos, P., Iannucci, A., Tilley, T., Jain, N., Balacco, J., et al. (2026) · Journal of Heredity · doi:10.1093/jhered/esag023
The curious case of a Chilean copepod ( Tigriopus aff. angulatus ) genome assembly
Neylan, I. P., Vaidya, R. V., Dassanayake, M., Navarrete, S. A., Kelly, M. W., & Faircloth, B. C. (2026) · Journal of Heredity · doi:10.1093/jhered/esag065
Nawaz, K., Orduna, I. O., Koo, D., Molina‐Freaner, F. E., Bell, H. L., Miculan, M., Llaca, V., Harrington, J., Eppley, S. M., & Poland, J. (2026) · Plant Communications · doi:10.1016/j.xplc.2026.101827
Dean, L. L., Holmes, N. J., Dobbs, P., & Loose, M. (2026) · BMC Genomics · doi:10.1186/s12864-026-12703-0
Benestan, L., Cormier, A., Destanque, T., Romatif, O., Vidal‐Dupiol, J., Jones, D. B., Jerry, D. R., Ky, C., & Luyer, J. L. (2026) · Scientific Data · doi:10.1038/s41597-026-06905-0
Law, S. T. S., Nong, W., Au, M. F. F., Cheung, L., Shum, C. W. Y., Lee, S. Y., Cheung, S. G., & Hui, J. H. L. (2026) · Scientific Data · doi:10.1038/s41597-026-07119-0
Genomes of two arid-zone marsupials uncover contrasting responses to climatic changePreprint
Feigin, C. Y., Trybulec, E., Ferguson, R., Scicluna, E. L., Sauermann, R., Hartley, G. A., O'Neill, R. J. W., & Pask, A. J. (2026) · bioRxiv (Cold Spring Harbor Laboratory) · doi:10.64898/2026.03.30.708387
The genome sequence of the gastric gland parasite, Cryptosporidium proliferans
Wiśniewska, M. M., Tůmová, L., Silberman, J. D., Salomaki, E. D., Bielawski, J. P., Táborský, P., Hlásková, L., Sak, B., Kváč, M., & Kolísko, M. (2026) · iScience · doi:10.1016/j.isci.2026.115597
Tan, L., Zhu, S., Ye, J., & Jiao, W. (2026) · Molecular Biology and Evolution · doi:10.1093/molbev/msag075
Lv, Q., Liu, Y., Xu, N., Zhang, X., Yang, Y., Li, C., Mao, H., Liu, M., & Liu, X. (2026) · Advanced Science · doi:10.1002/advs.202523161
REVOLUTA regulates cell fate and wall patterning in the fruit endocarpPreprint
Emonet, A., Schneider, I., Kelly, C., Tikhomirov, N., Dunemann, S., Brombach, L., Raissig, M. T., Pauly, M., & Hay, A. (2026) · bioRxiv (Cold Spring Harbor Laboratory) · doi:10.64898/2026.04.20.719616
Geng, J., Xu, W., Chen, G., Cai, L., Peng, X., Wang, Z., Zhao, B., & Cui, R. (2026) · Journal of Heredity · doi:10.1093/jhered/esag033
How to be dispensable: genomic and transcriptomic determinants in maize genesPreprint
Joets, J., Mollion, M., Baudry, K., Fagny, M., Turc, O., Cabrera‐Bosquet, L., Coursol, S., Welcker, C., Rogowsky, P., Belcram, H., et al. (2026) · bioRxiv (Cold Spring Harbor Laboratory) · doi:10.64898/2026.04.25.720561
Large population sizes shape genome evolution in barnaclesPreprint
Rivera‐Colón, A. G., Small, S. T., Jezuit, E., Wares, J. P., & Kern, A. D. (2026) · bioRxiv (Cold Spring Harbor Laboratory) · doi:10.64898/2026.04.27.721231
Liu, J., Cai, X., Xiao, Y., Chen, X., Cao, W., Ding, S., Zhan, S., Li, Z., & Yang, D. (2026) · Insect Systematics and Diversity · doi:10.1093/isd/ixag020
Rencken, S. D., Tushev, G., Hain, D., Ciirdaeva, E., Simakov, O., & Laurent, G. (2026) · eLife · doi:10.7554/elife.107393.3.sa4
Marchi, F. D., Acquadro, A., Moglia, A., Gaccione, L., Mannino, G., Gramazio, P., Barchi, L., Bertea, C. M., Portis, E., Prohens, J., et al. (2026) · Frontiers in Plant Science · doi:10.3389/fpls.2026.1832029
An Aspergillus lncRNA atlas reveals a novel modulator of aflatoxin biosynthesisPreprint
Fabre, M. L., Bok, J. W., Haefner, B. J., Keller, N. P., & Barber, A. E. (2026) · bioRxiv (Cold Spring Harbor Laboratory) · doi:10.64898/2026.05.29.728754
Eurmsirilerd, E., Resendiz, M., Lana, G., Li, Q., Nawmi, F., Chang, R., Zhang, W., Wu, T. X., Sun, Z., Wang, L., et al. (2026) · bioRxiv (Cold Spring Harbor Laboratory) · doi:10.64898/2026.06.04.730269
Synteny detection, visualization, and its trending applications
Zhang, X., & Smith, D. R. (2026) · Trends in Plant Science · doi:10.1016/j.tplants.2026.05.010
Evidence for dual pathways of Tc1/mariner domestication in Drosophila
Guseva, I. O., Rezvykh, A. P., Zelentsova, E. S., Kulikova, D. A., Evgen’ev, M. B., & Funikov, S. Y. (2026) · BMC Biology · doi:10.1186/s12915-026-02655-y
Bellini, N. K., Nachtigall, P. G., de Lima, P. L. C., Silva, H. G. D. S., Pires, D. D. S., de Souza, V. C., Rabuffo, C., de Carvalho, D. B., Feno, Y. M., Lima, A. P. C. D. A., et al. (2026) · BMC Genomics · doi:10.1186/s12864-026-13072-4
Assembly of a high-quality reference genome for the rat tapeworm Hymenolepis diminuta
Choudhary, S., Sundaresha, N., Ye, K., Bergman, C., & Rozario, T. (2026) · G3 Genes Genomes Genetics · doi:10.1093/g3journal/jkag298
Chen, W., Chen, S., Wang, J., Meng, D., Li, J., & Guo, L. (2026) · Genome biology · doi:10.1186/s13059-026-04163-2
The dynamic genomes of Salvinia reshape our understanding of fern chromosome evolution
Rizzieri, Y. C., Limpanasittichai, P., Hernández, F., Mendez-Reneau, J. I., Holt, S. D., Sutherland, B., Mandáková, T. M., Beck, J. B., Kuo, L., Kooyers, N. J., et al. (2026) · Proceedings of the National Academy of Sciences · doi:10.1073/pnas.2602084123
Assembly of a high-quality reference genome for the rat tapeworm Hymenolepis diminutaPreprint
Choudhary, S., Sundaresha, N., Ye, K., Bergman, C., & Rozario, T. (2026) · bioRxiv (Cold Spring Harbor Laboratory) · doi:10.64898/2026.06.23.734100
Milosavljevic, S., Copetti, D., Tong, K. Y., Morishima, A., Sese, J., Robinson, M. D., Shimizu, K. K., & Shimizu‐Inatsugi, R. (2026) · Nature Communications · doi:10.1038/s41467-026-75042-4
Souza, R. S., Clevenger, J. P., Jenkins, J. W., Korani, W., Schmutz, J., Grimwood, J., Plott, C., Brandvain, Y. J., Turner, M. K., Miller, A. J., et al. (2026) · Nature Communications · doi:10.1038/s41467-026-75205-3
Self-citationZhao, H., Ding, Y., Xu, Y., Li, J., Sun, H., Zhang, Y., Li, T., Liu, W., & Liu, S. (2026) · Scientia Horticulturae · doi:10.1016/j.scienta.2026.115026
The pangenome of the flooded gum, Eucalyptus grandisPreprint
Lötter, A., Brůna, T., Zama, S., Pierneef, R., Barry, K., Lipzen, A., Daum, C. G., Yoshinaga, Y., Grimwood, J., Boston, L., et al. (2026) · Research Square · doi:10.21203/rs.3.rs-10148330/v1
Self-citationCHITRA: an interactive visualization tool for comparative genomic rearrangement analysis
Pruthi, P., Bhatia, A., Agarwal, P., Shukla, N., Rani, L., & Narayan, J. (2026) · Bioinformatics Advances · doi:10.1093/bioadv/vbag200
Li, W., Li, Y., Lin, X., Chen, R., Li, W., You, C., Chen, D., Gao, L., Li, X., Luo, S., et al. (2026) · Molecular Plant · doi:10.1016/j.molp.2026.07.014
Nolte, N., Gruden, K., & Petek, M. (2026) · Plant Methods · doi:10.1186/s13007-026-01569-8
Zhu, Z., Chen, E., Navrátilová, P., Schreiber, M., Padmarasu, S., König, P., Himmelbach, A., MacAulay, M. A., Waugh, R., Mascher, M., et al. (2026) · bioRxiv (Cold Spring Harbor Laboratory) · doi:10.64898/2026.07.24.740502
Co-option of ancestral stem regulators drove recurrent evolution of underground storage organs
Brose, J., Martin, D., Wang, Y.-W., Wood, J. C., Vaillancourt, B., Hamilton, J. P., Mailloux, K., Edger, P. P., & Buell, C. R. (2026) · Proceedings of the National Academy of Sciences · doi:10.1073/pnas.2606323123
The Polyploid History of Cultivated DahliaPreprint
Meharg, Z., Albrecht, K., Webber, J., Boston, L. B., Grimwood, J., Walbot, V., & Harkess, A. (2026) · bioRxiv (Cold Spring Harbor Laboratory) · doi:10.64898/2026.07.24.740608
Self-citationWebster, C., Fetter, K. C., He, A., Guzman-Torres, C. R., Jara, C., Chagari, K., Mueller, A., Wnuk, S., Akella, H., Strickland, E., et al. (2026) · bioRxiv (Cold Spring Harbor Laboratory) · doi:10.64898/2026.07.29.740795
Genomic and eco-geographic features of locally adapted inversions in wild sunflowersPreprint
Yu, Y., González‐Segovia, E., Wang, J., Legendre, A., Gautier, V., Muños, S., Todesco, M., & Rieseberg, L. H. (2026) · bioRxiv (Cold Spring Harbor Laboratory) · doi:10.64898/2026.08.04.742882
orthoSynAssign: refine orthogroups using synteny informationPreprint
Tsai, C.-H., Páez, C. G. P., & Stajich, J. (2026) · bioRxiv (Cold Spring Harbor Laboratory) · doi:10.64898/2026.08.10.744007
Tangerine : A new family of Starships from lichen-forming fungi
Tagirdzhanova, G. M., Brown, N. E., Bucknell, A., Cameron, E. S., Finn, R. D., Blaxter, M., McDonald, M. C., Gluck‐Thaler, E., & Talbot, N. J. (2026) · Proceedings of the National Academy of Sciences · doi:10.1073/pnas.2534402123
Belny, A., Desaint, H., Rigal, M., Carrère, S., Gouzy, J., Bonnet, G., Labourey, C., Albert, E., Grivet, L., Roux, F., et al. (2026) · PLoS Genetics · doi:10.1371/journal.pgen.1011820
Draft hybrid assembly and annotation of the Drosophila palustris and Drosophila subpalustris genomes
Dion, W. A., Washeleski, E., Steenwinkel, T. E., Taylor, E., Kokate, P. P., VanDrie, A., Werner, T., & Goetsch, P. D. (2026) · G3 Genes Genomes Genetics · doi:10.1093/g3journal/jkag226
Chromosome-scale genome assembly and annotation of the Vietnamese indica rice cultivar Khang Dan 18Preprint
Trung, N. Q., Do, H. D. K., Vu, M. T., & Hoang, N. V. (2026) · bioRxiv (Cold Spring Harbor Laboratory) · doi:10.64898/2026.08.15.742683
Whole genome sequences and annotations of Japanese and French strains of Heterosigma akashiwoPreprint
Kondo, T., Sakamoto, M., Tokumaru, M., Tanizawa, Y., Nakamura, Y., Toyoda, A., & Ueki, S. (2026) · bioRxiv (Cold Spring Harbor Laboratory) · doi:10.64898/2026.08.19.745619
Raiyemo, D. A., Werle, I. S., Kaur, R., Whitt, L., Carey, S. B., Hale, H., Lewis, K. J., Womack, L., Harkess, A., Llaca, V., et al. (2026) · bioRxiv (Cold Spring Harbor Laboratory) · doi:10.64898/2026.08.21.746229
Self-citationXie, X., Chen, Y., Zhang, Y., Wang, Z., Wang, Y., Zhao, P., Peng, H., Xie, C., Yao, Y., Ni, Z., et al. (2026) · Molecular Plant · doi:10.1016/j.molp.2026.08.021
Su, X., Peng, Y., Yang, X., Zhang, F., Xu, Q., Ma, Z., Dong, Y., Zhou, L., Xue, H., Cao, X., et al. (2026) · bioRxiv (Cold Spring Harbor Laboratory) · doi:10.64898/2026.08.27.747553
Same Sex Chromosomes With Independent Origins in Haplochromine Cichlids
Smith, S. H., Musilová, Z., & Böhne, A. (2026) · Genome Biology and Evolution · doi:10.1093/gbe/evag223
The tortured past and present of young polymorphic neo-sex chromosomes of the mountain pine beetle
Lagunas‐Robles, G., Bentz, B., Verma, M., Vandygriff, J., Hansen, M., Simmonds, T. J., Corpuz, R. L., Kauwe, A. N., Geib, S. M., & Bracewell, R. (2026) · Evolution Letters · doi:10.1093/evlett/qrag040
Veselská, T., Kolařík, M., & Bracewell, R. (2026) · bioRxiv (Cold Spring Harbor Laboratory) · doi:10.64898/2026.09.15.751753
Kroll, E., Wood, A., Nicolli, C. P., de Klerk, A., Urban, M., Ponte, E. M. D., Hassani‐Pak, K., & Hammond-Kosack, K. E. (2026) · bioRxiv (Cold Spring Harbor Laboratory) · doi:10.64898/2026.09.16.752100
Dillon, K. C., Sprong, H., Ronai, I., Choudhary, S., Grant, C., Baptista, R. P., Ray, D. A., & Glenn, T. C. (2026) · bioRxiv (Cold Spring Harbor Laboratory) · doi:10.64898/2026.09.18.752137
Feulner, H., Švara, A., Zhao, X., Fei, Z., & Khan, A. (2026) · bioRxiv (Cold Spring Harbor Laboratory) · doi:10.64898/2026.09.23.753852
Calla, B., Sim, S. B., Yeats, M. S., Johnson, K. M., Chávez‐Congrains, K., Kauwe, A. N., Plough, L. V., & Geib, S. M. (2026) · bioRxiv (Cold Spring Harbor Laboratory) · doi:10.64898/2026.09.23.753890
Son, J. H., Luecke, D. M., Bista, B., Manat, Y., Cao, W., Beukeboom, L., Bopp, D., Ellison, C. E., Saelao, P., & Meisel, R. P. (2026) · bioRxiv (Cold Spring Harbor Laboratory) · doi:10.64898/2026.09.26.754726
Apomixis imposes evolutionary costs by reducing recombination efficiency and disrupting segregation
Wang, N., Zhang, W., Yang, Y., Zhang, S., Chai, L., Guo, W., Xu, Q., Zhou, Y., Lascoux, M., & Deng, X. (2026) · Proceedings of the National Academy of Sciences · doi:10.1073/pnas.2618289123
Bjornson, M., Hardigan, M. A., Debernardi, J. M., Brukental, H., Pincot, D. D. A., Vachev, M. V., Famula, R. A., Cole, G. S., Velasco, D., Rwahnih, M. A., et al. (2026) · PLANT PHYSIOLOGY · doi:10.1093/plphys/kiag684
Woolfenden, H. C., Wells, R., & Morris, R. J. (2026) · The Plant Journal · doi:10.1111/tpj.71145
Qiu, R., Mann, S. G. A., do Nascimento, T. H., Perley, J. O., Richardson, M. B., Deschênes, D. A. R., Bezerra, M., Alves, A. B. D. C., Alves, A. O., Schietti, J., et al. (2026) · bioRxiv (Cold Spring Harbor Laboratory) · doi:10.64898/2026.10.06.754717
Self-citationHidden Genomic Architectures Shaping Variation in Arabidopsis thaliana
Lensink, M. E. (2026) · eScholarship (California Digital Library)
Smith, S. H., Kukowka, S., & Böhne, A. (2026) · Journal of Evolutionary Biology · doi:10.1093/jeb/voag062
Martelossi, J., Krasheninnikova, K., Denton, A., Wood, J. M. D., Mathers, T. C., Durbin, R. M., Fong, N., Bentley, D. L., Clark, M. S., & Bista, I. (2026) · Genome biology · doi:10.1186/s13059-026-04293-7
Panagram reveals pangenome architectures underlying trait variation in plants and animalsPreprint
Jenike, K. M., Brown, N. L., Kovaka, S., Larivière, D., Burns, R., Chen, F. L., Shohat, H., Benoit, M., Collins, T. C., Daniels, R. F., et al. (2026) · bioRxiv (Cold Spring Harbor Laboratory) · doi:10.64898/2026.10.21.760756
Recurring X-autosome fusions in Aeshna dragonflies break 300 million years of karyotypic stasisPreprint
Hu, Z., Kaunisto, K., Kohli, M. K., & Toups, M. A. (2026) · bioRxiv (Cold Spring Harbor Laboratory) · doi:10.64898/2026.10.16.759710
Steigerwald, E., Scheim, D., Rivera, M. D. J., McEvoy, S. L., Hasenstab‐Lehman, K. E., Guilliams, C. M., & Meyer, R. S. (2026) · bioRxiv (Cold Spring Harbor Laboratory) · doi:10.64898/2026.10.25.761743
Deciphering the Fine Anthocyanin Regulation in Eggplant: a multi –omics approach
MARCHI, F. D. (n.d.) · Institutional Research Information System University of Turin (University of Turin)
Grover, C. E., Arick, M. A., Ning, W., Bridgeland, A., Yu, J. Z., Simpson, S., Wood, M., Youngblood, R. C., Hulse‐Kemp, A. M., Wendel, J. F., et al. (2026) · bioRxiv (Cold Spring Harbor Laboratory) · doi:10.64898/2026.11.02.763792
Siblings in Flight: Unravelling Reproductive Barriers Between Two Butterfly Sister Species
Torrado‐Blanco, L., Vila, R., Lukhtanov, V. A., Seoane‐Rodríguez, C., Cornet, C., Lucek, K., & Vila, M. (2026) · Ecology and Evolution · doi:10.1002/ece3.74533
Metadata
- Authors
- Lovell, J. T., Sreedasyam, A., Schranz, M. E., Wilson, M., Carlson, J. W., Harkess, A., Emms, D., Goodstein, D. M., & Schmutz, J.
- Affiliations
- Lawrence Berkeley National Laboratory (US)
- HudsonAlpha Institute for Biotechnology (US)
- Wageningen University & Research (NL)
- Arizona State University (US)
- University of Oxford (GB)
- Corresponding author
- Lovell, John T
- ORCID
- Venue
- eLife
- Publisher
- eLife Sciences Publications, Ltd
- Published
- 2022-09-09
- Volume
- 11
- ISSN
- 2050-084X (ISSN-L)
- PMC
- PMC9462846
- OpenAlex
- W4295078843
- Cited by
- 391
- References
- 54
- Citations by year
- 2026: 144 · 2025: 130 · 2024: 78 · 2023: 37 · 2022: 2
- FWCI
- 18.24
- Type
- journal article
- Language
- en
- Open access
- gold
- doi.org
- Licence
- Locations
- eLife (publishedVersion, cc-by)
- bioRxiv (Cold Spring Harbor Laboratory) (submittedVersion, cc-by-nc-nd)
- PubMed Central (publishedVersion, cc-by)
- PubMed (publishedVersion)
- Socio-Environmental Systems Modeling (acceptedVersion, cc-by)
- DOAJ (DOAJ: Directory of Open Access Journals) (submittedVersion, cc-by-sa)
- eScholarship (California Digital Library) (submittedVersion)
- OSTI OAI (U.S. Department of Energy Office of Scientific and Technical Information) (submittedVersion)
- Data Archiving and Networked Services (DANS) (submittedVersion, cc-by)
- Funders
- U.S. Department of Energy (DE-AC02-05CH1123)
- National Institute of General Medical Sciences (R35GM124827)
- Topics
- Life Sciences › Biochemistry, Genetics and Molecular Biology › Molecular Biology › Genomics and Phylogenetic Studies
- Life Sciences › Biochemistry, Genetics and Molecular Biology › Genetics › Chromosomal and Genetic Variations
- Life Sciences › Biochemistry, Genetics and Molecular Biology › Genetics › Genome Rearrangement Algorithms
- Keywords
- gene order, orthology, synteny, copy number variation, presence/absence variation, structural variants, sex chromosome evolution, Poaceae, maize varieties, polyploidy, comparative genomics, R package
- MeSH terms
- Gene Dosage, Genome, Plant, Evolution, Molecular, Synteny, Quantitative Trait Loci, DNA Copy Number Variations
About these checks
Registry, retraction, Cites and statistics results are computed, not judged, with one exception: a printed reference that no index lists is read once by a model before it counts as a citation error. Claims are extracted by a model and kept only when their quote appears verbatim in the text; each cited source is then checked, with a model’s help, for whether it says what the claim relies on. Those verdicts can be wrong — read the claim’s quote and the cited source before relying on one.
A language model drew the claims from the paper on 2026-11-10, under version 3 of the claim definition (model deepseek-v4.1-flash, prompt extract-v3).
A second model labelled each claim on 2026-11-10 (model jev-1.13-20260917, definition revision gold-guideline-v0.2).
Cited sources are checked with a language model’s help (gpt-6-sol).
Statistics and arithmetic are recomputed, not judged.
Confidence bands are shown only for fields calibrated on our annotated test set. None is calibrated yet, so no band is shown.
What counts as a claim ›How we measure confidence ›How we check this ›
Are you an author, or do you see a problem with this page? Request a review
