

The DOI matches its Crossref record; 71 of the 71 references it cites were found in a registry or an index; 4 of the 50 sources its claims cite were checked for support.
Proinflammatory NFkB signalling promotes mitochondrial dysfunction in skeletal muscle in response to cellular fuel overloading
Open accessAbstract
Sustained nutrient (fuel) excess, as occurs during obesity and diabetes, has been linked to increased inflammation, impaired mitochondrial homeostasis, lipotoxicity, and insulin resistance in skeletal muscle. Precisely how mitochondrial dysfunction is initiated and whether it contributes to insulin resistance in this tissue remains a poorly resolved issue. Herein, we examine the contribution that an increase in proinflammatory NFkB signalling makes towards regulation of mitochondrial bioenergetics, morphology, and dynamics and its impact upon insulin action in skeletal muscle cells subject to chronic fuel (glucose and palmitate) overloading. We show sustained nutrient excess of L6 myotubes promotes activation of the IKKβ-NFkB pathway (as judged by a six-fold increase in IL-6 mRNA expression; an NFkB target gene) and that this was associated with a marked reduction in mitochondrial respiratory capacity (>50%), a three-fold increase in mitochondrial fragmentation and 2.5-fold increase in mitophagy. Under these circumstances, we also noted a reduction in the mRNA and protein abundance of PGC1α and that of key mitochondrial components (SDHA, ANT-1, UCP3, and MFN2) as well as an increase in cellular ROS and impaired insulin action in myotubes. Strikingly, pharmacological or genetic repression of NFkB activity ameliorated disturbances in mitochondrial respiratory function/morphology, attenuated loss of SDHA, ANT-1, UCP3, and MFN2 and mitigated the increase in ROS and the associated reduction in myotube insulin sensitivity. Our findings indicate that sustained oversupply of metabolic fuel to skeletal muscle cells induces heightened NFkB signalling and that this serves as a critical driver for disturbances in mitochondrial function and morphology, redox status, and insulin signalling.
Overview
AI snapshot
Written from the paper’s full text.
TL;DR
In L6 and human myotubes, sustained glucose plus palmitate overload activates IKKβ–NF-κB signaling and produces mitochondrial respiratory impairment, fragmentation, mitophagy, ROS, and insulin resistance. Pharmacological or genetic NF-κB repression ameliorates these mitochondrial and insulin-action defects.
Key findings
- 16 h glucose (5 mM) + palmitate (0.4 mM) activated IKKβ–NF-κB (sixfold increase in IL-6 mRNA; reduced IκBα) and was associated with >50% reduction in mitochondrial respiratory capacity, threefold increase in mitochondrial fragmentation, and 2.5-fold increase in mitophagy.
- Fuel overload increased mitochondrial superoxide and H₂O₂; 2DG or mitochondrial antioxidants suppressed ROS, and 2DG preserved respiration/morphology. Combined GLC+PA reduced basal respiration, OXPHOS coupling, and respiratory capacity; PA alone at 0.7 mM recapitulated the basal respiration decline.
- NF-κB inhibition with BI605906 (IKKβ inhibitor; IC50 380 nM) or adenoviral IκBαS32A/S36A ameliorated respiratory dysfunction and fragmentation, attenuated loss of SDHA, ANT-1, UCP3, and MFN2, reduced ROS, and improved insulin-stimulated Akt phosphorylation and glucose uptake. Insulin-stimulated Akt phosphorylation was blunted by ~58% under GLC/PA and was mitigated by NF-κB repression.
- Mitochondrial mass proxies (mtDNA, citrate synthase) did not change significantly, despite reduced PGC1α and mitochondrial protein/mRNA abundance; mitophagy increased and was restrained by BI605906.
Methods
- Rat L6 myotubes and human LHCN-M2 myotubes; 16 h treatments with glucose (5 mM), palmitate (0.4 mM unless noted), 2DG (5 mM), BI605906 (10 μM), adenoviral IκBαS32A/S36A, mitochondrial antioxidants, and other inhibitors as indicated.
- Measurements included Seahorse XF24 respiration, qPCR, immunoblotting, subcellular fractionation, Mitospy confocal morphology, mCherry-GFP-Fis1 mitophagy reporter, Mitosox/MitoPYI ROS detection, glucose uptake, and Akt phosphorylation.
- Statistics used one-way ANOVA with Tukey post hoc test, significance at P < 0.05; experiments were repeated at least three to five times.
Limitations
- Stated: the mitophagy reporter does not quantitatively assess mitophagic flux; future work is needed to distinguish transcriptional versus post-transcriptional control of PGC1α, SDHA, ANT-1, and UCP3; mtDNA measures may include mitochondria in early mitophagy, potentially masking differences.
- Evident: mechanistic work is mainly in L6 rat myotubes, with human LHCN-M2 data shown in supplementary figures; no in vivo causal test of NF-κB repression in muscle is provided.
- Evident: mitochondrial antioxidants limited fragmentation but did not rescue respiratory capacity or loss of UCP3, ANT-1, or PGC1α, suggesting ROS effects may be downstream/secondary; 16 h in vitro overload may not fully model chronic obesity/diabetes.
Model-written summary. Check it against the paper before relying on it.
Integrity signals
Registry
Cites
Statistics
Figures
Verification
Claims the paper makes
59 Own result · 23 Not checked yet · 20 Own interpretation · 3 Partly supported · 1 Own method · 1 No basis given · accuracy not yet measured
A result the paper reports from its own data — it cites no other source for it, so there is none to check. The quote shows it is in the paper.
In the paper
“We show sustained nutrient excess of L6 myotubes promotes activation of the IKKβ-NFkB pathway (as judged by a six-fold increase in IL-6 mRNA expression; an NFkB target gene) and that this was associated with a marked reduction in mitochondrial respiratory capacity (>50%), a three-fold increase in mitochondrial fragmentation and 2.5-fold increase in mitophagy.”
§ Proinflammatory NFkB signalling promotes mitochondrial dysfunction in skeletal muscle in response to cellular fuel overloading > Abstract
boostedcorrelational- Asserted: passes — The authors put it forward as true.
- Checkable: passes — It can be checked against evidence.
- Load-bearing: passes — The paper’s conclusions depend on it.
- Based: passes — The paper gives a reason why it holds.
A result the paper reports from its own data — it cites no other source for it, so there is none to check. The quote shows it is in the paper.
In the paper
“Under these circumstances, we also noted a reduction in the mRNA and protein abundance of PGC1α and that of key mitochondrial components (SDHA, ANT-1, UCP3, and MFN2) as well as an increase in cellular ROS and impaired insulin action in myotubes.”
§ Proinflammatory NFkB signalling promotes mitochondrial dysfunction in skeletal muscle in response to cellular fuel overloading > Abstract
plaindirect- Asserted: passes — The authors put it forward as true.
- Checkable: passes — It can be checked against evidence.
- Load-bearing: passes — The paper’s conclusions depend on it.
- Based: passes — The paper gives a reason why it holds.
A result the paper reports from its own data — it cites no other source for it, so there is none to check. The quote shows it is in the paper.
In the paper
“We show sustained nutrient excess of L6 myotubes promotes activation of the IKKβ-NFkB pathway (as judged by a six-fold increase in IL-6 mRNA expression; an NFkB target gene) and that this was associated with a marked reduction in mitochondrial respiratory capacity (>50%), a three-fold increase in mitochondrial fragmentation and 2.5-fold increase in mitophagy.”
§ Proinflammatory NFkB signalling promotes mitochondrial dysfunction in skeletal muscle in response to cellular fuel overloading > Abstract
boostedcorrelational- Asserted: passes — The authors put it forward as true.
- Checkable: passes — It can be checked against evidence.
- Load-bearing: passes — The paper’s conclusions depend on it.
- Based: passes — The paper gives a reason why it holds.
A result the paper reports from its own data — it cites no other source for it, so there is none to check. The quote shows it is in the paper.
In the paper
“We show sustained nutrient excess of L6 myotubes promotes activation of the IKKβ-NFkB pathway (as judged by a six-fold increase in IL-6 mRNA expression; an NFkB target gene)”
§ Proinflammatory NFkB signalling promotes mitochondrial dysfunction in skeletal muscle in response to cellular fuel overloading > Abstract
boosteddirect- Asserted: passes — The authors put it forward as true.
- Checkable: passes — It can be checked against evidence.
- Load-bearing: passes — The paper’s conclusions depend on it.
- Based: passes — The paper gives a reason why it holds.
A result the paper reports from its own data — it cites no other source for it, so there is none to check. The quote shows it is in the paper.
In the paper
“Under these circumstances, we also noted a reduction in the mRNA and protein abundance of PGC1α and that of key mitochondrial components (SDHA, ANT-1, UCP3, and MFN2) as well as an increase in cellular ROS and impaired insulin action in myotubes.”
§ Proinflammatory NFkB signalling promotes mitochondrial dysfunction in skeletal muscle in response to cellular fuel overloading > Abstract
plaindirect- Asserted: passes — The authors put it forward as true.
- Checkable: passes — It can be checked against evidence.
- Load-bearing: passes — The paper’s conclusions depend on it.
- Based: passes — The paper gives a reason why it holds.
A result the paper reports from its own data — it cites no other source for it, so there is none to check. The quote shows it is in the paper.
In the paper
“Under these circumstances, we also noted a reduction in the mRNA and protein abundance of PGC1α and that of key mitochondrial components (SDHA, ANT-1, UCP3, and MFN2) as well as an increase in cellular ROS and impaired insulin action in myotubes.”
§ Proinflammatory NFkB signalling promotes mitochondrial dysfunction in skeletal muscle in response to cellular fuel overloading > Abstract
plaindirect- Asserted: passes — The authors put it forward as true.
- Checkable: passes — It can be checked against evidence.
- Load-bearing: passes — The paper’s conclusions depend on it.
- Based: passes — The paper gives a reason why it holds.
A result the paper reports from its own data — it cites no other source for it, so there is none to check. The quote shows it is in the paper.
In the paper
“We show sustained nutrient excess of L6 myotubes promotes activation of the IKKβ-NFkB pathway (as judged by a six-fold increase in IL-6 mRNA expression; an NFkB target gene) and that this was associated with a marked reduction in mitochondrial respiratory capacity (>50%), a three-fold increase in mitochondrial fragmentation and 2.5-fold increase in mitophagy.”
§ Proinflammatory NFkB signalling promotes mitochondrial dysfunction in skeletal muscle in response to cellular fuel overloading > Abstract
boostedcorrelational- Asserted: passes — The authors put it forward as true.
- Checkable: passes — It can be checked against evidence.
- Load-bearing: passes — The paper’s conclusions depend on it.
- Based: passes — The paper gives a reason why it holds.
A result the paper reports from its own data — it cites no other source for it, so there is none to check. The quote shows it is in the paper.
In the paper
“Under these circumstances, we also noted a reduction in the mRNA and protein abundance of PGC1α and that of key mitochondrial components (SDHA, ANT-1, UCP3, and MFN2) as well as an increase in cellular ROS and impaired insulin action in myotubes.”
§ Proinflammatory NFkB signalling promotes mitochondrial dysfunction in skeletal muscle in response to cellular fuel overloading > Abstract
plaindirect- Asserted: passes — The authors put it forward as true.
- Checkable: passes — It can be checked against evidence.
- Load-bearing: passes — The paper’s conclusions depend on it.
- Based: passes — The paper gives a reason why it holds.
A result the paper reports from its own data — it cites no other source for it, so there is none to check. The quote shows it is in the paper.
In the paper
“Furthermore, we contest that the increase in ROS, we see in response to GLC/PA overloading is principally mitochondrial generated given that treating myotubes with either Mitotempo or MitoQ, two mitochondrial targeted anti-oxidants, which, respectively, scavenge O2–. and quench H2O2, effectively suppress increases in both ROS initiated by fuel oversupply (Supplementary Fig. S1D and S2D).”
§ Proinflammatory NFkB signalling promotes mitochondrial dysfunction in skeletal muscle in response to cellular fuel overloading > Results > Effects of palmitate oversupply on proinflammatory signalling, ROS generation and mitochondrial function in myotubes
plaindirect- Asserted: passes — The authors put it forward as true.
- Checkable: passes — It can be checked against evidence.
- Load-bearing: passes — The paper’s conclusions depend on it.
- Based: passes — The paper gives a reason why it holds.
A result the paper reports from its own data — it cites no other source for it, so there is none to check. The quote shows it is in the paper.
In the paper
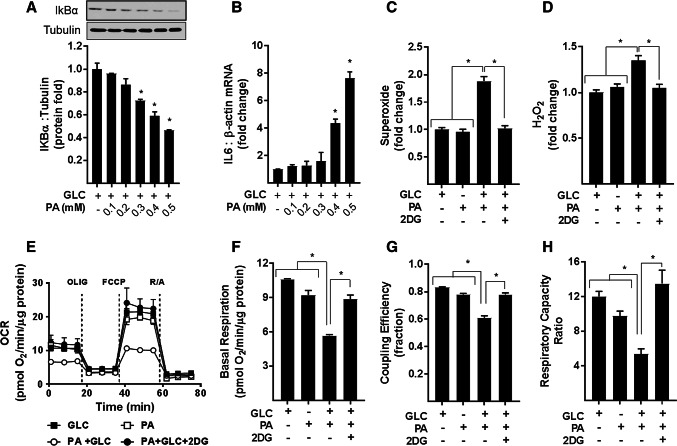
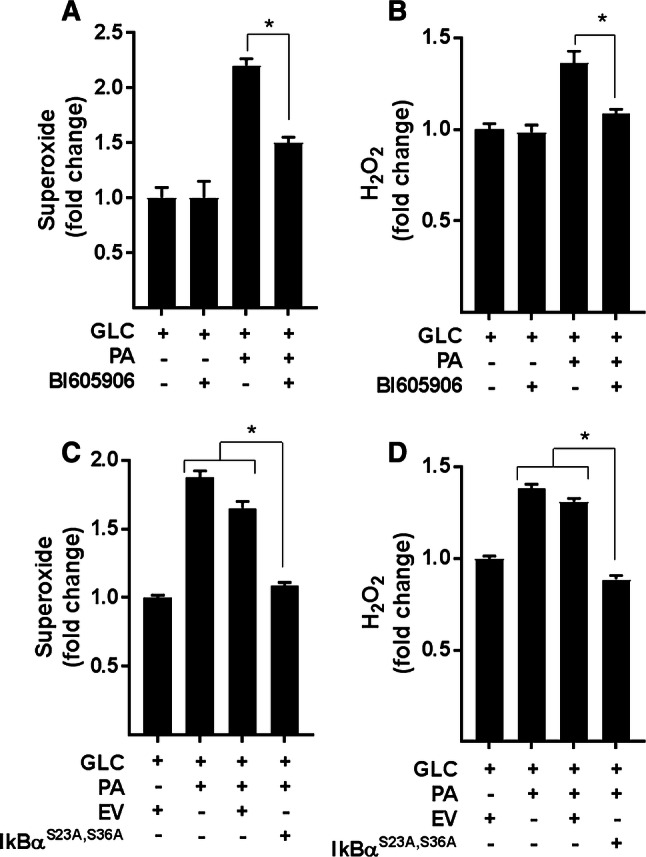
“Whilst incubation of myotubes with 5 mM GLC or 0.4 mM PA alone had no significant effect on ROS production in myotubes, the combined presence of both nutrients induced a significant increase in O2–. and H2O2 (Fig. 1c, d).”
§ Proinflammatory NFkB signalling promotes mitochondrial dysfunction in skeletal muscle in response to cellular fuel overloading > Results > Effects of palmitate oversupply on proinflammatory signalling, ROS generation and mitochondrial function in myotubes
plaindirect- Asserted: passes — The authors put it forward as true.
- Checkable: passes — It can be checked against evidence.
- Load-bearing: passes — The paper’s conclusions depend on it.
- Based: passes — The paper gives a reason why it holds.
- Probably not a substantial claim. 12
- It may state two separate claims as one. 32
The cited sources support only part of this claim — read each source’s verdict below.
In the paper
“Indeed, mitochondrial dysfunction and/or a reduction in mitochondrial content, as characterised by a fall in oxidative capacity, has been reported in skeletal muscle and adipose tissue from obese and diabetic subjects [8, 9].”
§ Proinflammatory NFkB signalling promotes mitochondrial dysfunction in skeletal muscle in response to cellular fuel overloading > Introduction
What the sources say
- Not checked yetcites [8] Kelley DE et al (2002) Dysfunction of mitochondria in human skeletal muscle in type 2 diabetes. Diabetes 51:2944–2950 source
- Partly supportedcites [9] Ritov VB et al (2005) Deficiency of subsarcolemmal mitochondria in obesity and type 2 diabetes. Diabetes 54:8–14 sourceExperimental — accuracy not yet measured
The Subcellular distribution of mitochondria section reports reduced skeletal-muscle mitochondrial DNA content and electron transport chain activity in obese and type 2 diabetic subjects relative to lean volunteers. The paper does not report corresponding findings in adipose tissue, so it supports only the skeletal-muscle part of the cited sentence. Page numbers are unavailable in our copy. (LLM, conf=0.88)
plaincorrelational- Asserted: passes — The authors put it forward as true.
- Checkable: passes — It can be checked against evidence.
- Load-bearing: passes — The paper’s conclusions depend on it.
- Based: passes — The paper gives a reason why it holds.
Probably not a substantial claim.
The cited sources support only part of this claim — read each source’s verdict below.
In the paper
“In skeletal muscle, reduced mitochondrial respiration has also been linked to aberrant control of mitochondrial dynamics [64–67].”
§ Proinflammatory NFkB signalling promotes mitochondrial dysfunction in skeletal muscle in response to cellular fuel overloading > Discussion
What the sources say
- Partly supportedcites [64] Johnson ML, Robinson MM, Nair KS (2013) Skeletal muscle aging and the mitochondrion. Trends Endocrinol Metab 24:247–256 sourceExperimental — accuracy not yet measured
The “Mitochondrial dysfunction” section reports reduced mitochondrial ATP production in aging skeletal muscle and describes enlarged, disrupted mitochondria. It does not establish that reduced respiration is linked to aberrant control of mitochondrial dynamics, so the claimed link is unsupported. (LLM, conf=0.78)
- Not checked yetcites [65] Iqbal S et al (2013) Expression of mitochondrial fission and fusion regulatory proteins in skeletal muscle during chronic use and disuse. Muscle Nerve 48:963–970 source
- Partly supportedcites [66] Jheng HF et al (2012) Mitochondrial fission contributes to mitochondrial dysfunction and insulin resistance in skeletal muscle. Mol Cell Biol 32:309–319 sourceExperimental — accuracy not yet measured
The Abstract links aberrant mitochondrial fission in skeletal muscle cells to mitochondrial dysfunction, including loss of ATP production. But the paper does not report reduced respiration linked to altered dynamics in skeletal muscle: the Introduction’s explicit examples of decreased respiration concern fibroblasts and HeLa cells, and the Discussion notes unchanged muscle respiration rates in cited short-term feeding studies. The claim is supported for mitochondrial dysfunction, but not for respiration specifically. (LLM, conf=0.83)
- Not checked yetcites [67] Smith ME et al (2013) Mitochondrial fission mediates ceramide-induced metabolic disruption in skeletal muscle. Biochem J 456:427–439 source
plaincorrelational- Asserted: passes — The authors put it forward as true.
- Checkable: passes — It can be checked against evidence.
- Load-bearing: fails — The paper’s conclusions may not depend on it.
- Based: passes — The paper gives a reason why it holds.
Probably not a substantial claim. The paper’s conclusions may not depend on it.
- Partly supported
The cited sources support only part of this claim — read each source’s verdict below.
In the paper
“MEF cells lacking IKKα (but not IKKβ) exhibit reduced cellular expression of OPA-1 and display enhanced mitochondrial fission [69].”
§ Proinflammatory NFkB signalling promotes mitochondrial dysfunction in skeletal muscle in response to cellular fuel overloading > Discussion
What the sources say
- Partly supportedcites [69] Laforge M et al (2016) NF-kappaB pathway controls mitochondrial dynamics. Cell Death Differ 23:89–98 sourceExperimental — accuracy not yet measured
The Results and discussion report that IKKα-deficient MEFs, but not IKKβ-deficient MEFs, have markedly lower OPA1 levels. They also report a fragmented mitochondrial network in IKKα-deficient MEFs, but do not establish that mitochondrial fission itself is enhanced; fragmentation could also reflect reduced fusion. (LLM, conf=0.84)
plaindirect- Asserted: passes — The authors put it forward as true.
- Checkable: passes — It can be checked against evidence.
- Load-bearing: fails — The paper’s conclusions may not depend on it.
- Based: passes — The paper gives a reason why it holds.
Probably not a substantial claim. The paper’s conclusions may not depend on it. It may state two separate claims as one.
- Partly supported
A result the paper reports from its own data — it cites no other source for it, so there is none to check. The quote shows it is in the paper.
In the paper
“Figure 1a, b shows that myotubes exposed to increasing PA concentrations exhibit a dose-dependent reduction in cellular IkBα abundance that was associated with a concomitant increase in IL-6 gene expression.”
§ Proinflammatory NFkB signalling promotes mitochondrial dysfunction in skeletal muscle in response to cellular fuel overloading > Results > Effects of palmitate oversupply on proinflammatory signalling, ROS generation and mitochondrial function in myotubes
plaindirect- Asserted: passes — The authors put it forward as true.
- Checkable: passes — It can be checked against evidence.
- Load-bearing: passes — The paper’s conclusions depend on it.
- Based: passes — The paper gives a reason why it holds.
It may state two separate claims as one.
A result the paper reports from its own data — it cites no other source for it, so there is none to check. The quote shows it is in the paper.
In the paper
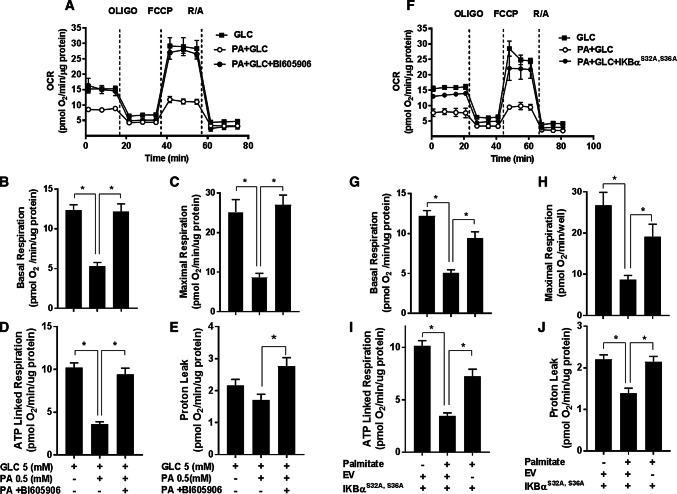
“Figure 1e–h shows that compared to myotubes incubated with either 5 mM GLC or 0.4 mM PA alone, those exposed to both carbon fuels simultaneously had a lower OCR and also exhibited a significant reduction in basal respiration, OXPHOS coupling, and respiratory capacity.”
§ Proinflammatory NFkB signalling promotes mitochondrial dysfunction in skeletal muscle in response to cellular fuel overloading > Results > Effects of palmitate oversupply on proinflammatory signalling, ROS generation and mitochondrial function in myotubes
plaincorrelational- Asserted: passes — The authors put it forward as true.
- Checkable: passes — It can be checked against evidence.
- Load-bearing: passes — The paper’s conclusions depend on it.
- Based: passes — The paper gives a reason why it holds.
It may state two separate claims as one.
A result the paper reports from its own data — it cites no other source for it, so there is none to check. The quote shows it is in the paper.
In the paper
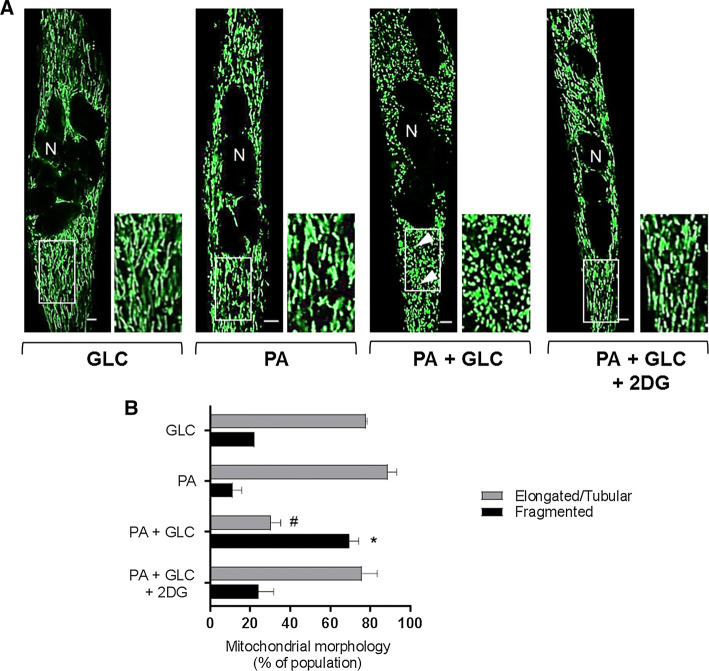
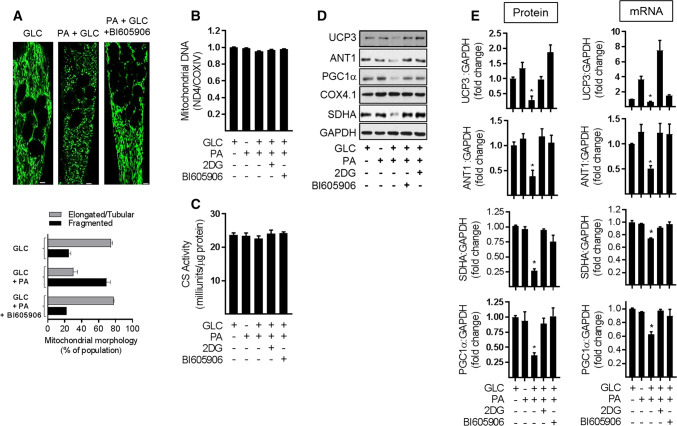
“Strikingly, in myotubes that had been incubated with GLC or PA alone, the green-fluorescent mitochondrial dye highlights that ~ 80% of the mitochondrial population is part of an organised elongated/tubular network, which becomes structurally fragmented and spheroid in nature when myotubes are subjected to a sustained period of fuel overloading with GLC and PA (Fig. 3a, b).”
§ Proinflammatory NFkB signalling promotes mitochondrial dysfunction in skeletal muscle in response to cellular fuel overloading > Results > Effects of mitochondrial fuel overload and glycolytic inhibition on mitochondrial morphology
plaindirect- Asserted: passes — The authors put it forward as true.
- Checkable: passes — It can be checked against evidence.
- Load-bearing: passes — The paper’s conclusions depend on it.
- Based: passes — The paper gives a reason why it holds.
It may state two separate claims as one.
A result the paper reports from its own data — it cites no other source for it, so there is none to check. The quote shows it is in the paper.
In the paper
“Analysis of ROS production in L6 myotubes revealed that in the absence of PA provision, BI605906 per se has no detectable effect upon cellular O2–. or H2O2, but significantly reduces the increase in both species when myotubes were subjected to chronic nutrient oversupply (Fig. 5a, b).”
§ Proinflammatory NFkB signalling promotes mitochondrial dysfunction in skeletal muscle in response to cellular fuel overloading > Results > Is proinflammatory NFkB signalling a driver of ROS generation in response to nutrient overloading?
plaindirect- Asserted: passes — The authors put it forward as true.
- Checkable: passes — It can be checked against evidence.
- Load-bearing: passes — The paper’s conclusions depend on it.
- Based: passes — The paper gives a reason why it holds.
It may state two separate claims as one.
A result the paper reports from its own data — it cites no other source for it, so there is none to check. The quote shows it is in the paper.
In the paper
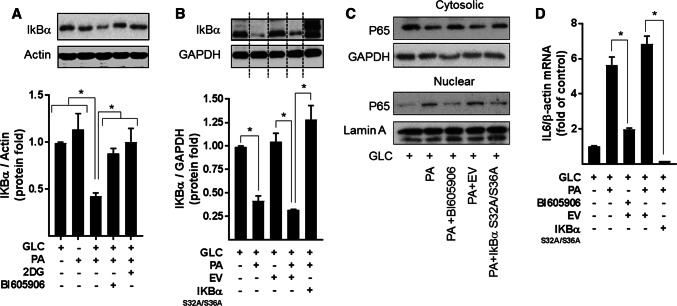
“Moreover, consistent with this observation, both BI605906 and IκBαS32A/S36A expression attenuated nuclear localisation of the p65 subunit of NFkB and reduced transcription of the IL-6 gene (an NFkB target gene) that is otherwise seen in GLC+PA-overloaded myotubes (Fig. 4c, d).”
§ Proinflammatory NFkB signalling promotes mitochondrial dysfunction in skeletal muscle in response to cellular fuel overloading > Results > Is proinflammatory NFkB signalling a driver of ROS generation in response to nutrient overloading?
plaindirect- Asserted: passes — The authors put it forward as true.
- Checkable: passes — It can be checked against evidence.
- Load-bearing: passes — The paper’s conclusions depend on it.
- Based: passes — The paper gives a reason why it holds.
It may state two separate claims as one.
- Rests on an assumption: Mutation of Ser32 and Ser36 to alanine renders IκBα resistant to IKK phosphorylation, protecting it from proteasomal degradation and retaining its capacity to hold NFκB in an inhibited state.
A result the paper reports from its own data — it cites no other source for it, so there is none to check. The quote shows it is in the paper.
In the paper
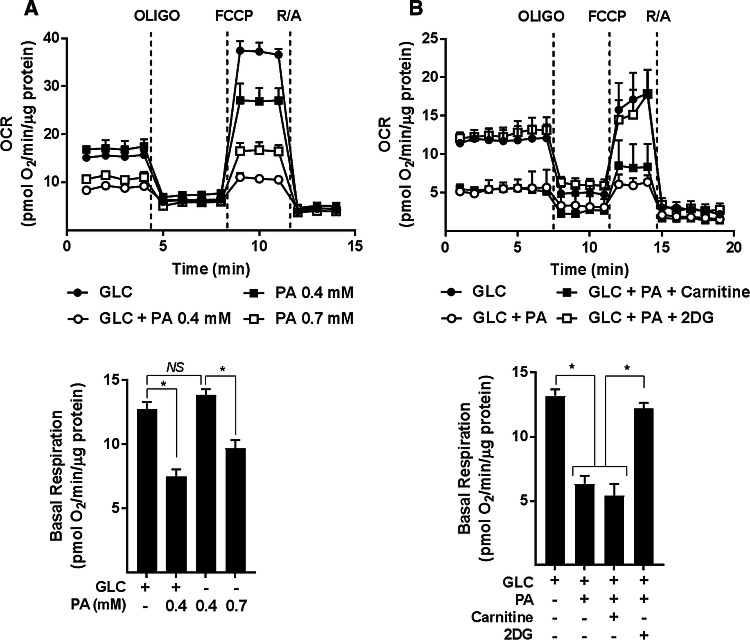
“In line with the findings presented in Fig. 1e–h, sustained (16 h) exposure of myotubes to nutrient excess (GLC and PA) induced a significant decline in the basal and maximal respiratory rate, which was associated with a reduction in ATP-linked respiration and a modest decline in mitochondrial proton leak (Fig. 6a–j).”
§ Proinflammatory NFkB signalling promotes mitochondrial dysfunction in skeletal muscle in response to cellular fuel overloading > Results > Is increased NFkB signalling a causal factor for mitochondrial dysfunction in myotubes during nutrient overload?
plaincorrelational- Asserted: passes — The authors put it forward as true.
- Checkable: passes — It can be checked against evidence.
- Load-bearing: passes — The paper’s conclusions depend on it.
- Based: passes — The paper gives a reason why it holds.
It may state two separate claims as one.
A result the paper reports from its own data — it cites no other source for it, so there is none to check. The quote shows it is in the paper.
In the paper
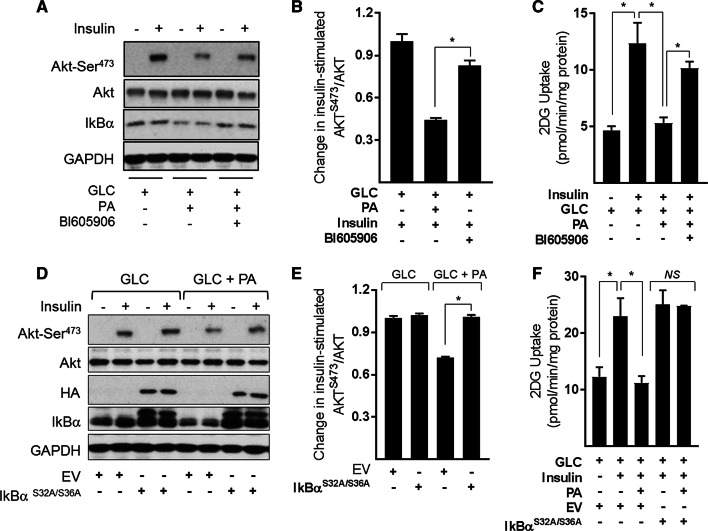
“However, cotreatment of fuel-loaded myotubes with BI605906 or expression of the IκBαS32A/S36A super-repressor (Fig. 9d) not only mitigates the reduction in insulin-stimulated Akt phosphorylation (Fig. 9a, b, d, e), but also partially rescues the loss in hormone-stimulated glucose uptake (Fig. 9c, f).”
§ Proinflammatory NFkB signalling promotes mitochondrial dysfunction in skeletal muscle in response to cellular fuel overloading > Results > Effects of suppressing NFkB signalling in substrate-loaded myotubes on insulin sensitivity
plaindirect- Asserted: passes — The authors put it forward as true.
- Checkable: passes — It can be checked against evidence.
- Load-bearing: passes — The paper’s conclusions depend on it.
- Based: passes — The paper gives a reason why it holds.
It may state two separate claims as one.
- Rests on an assumption: Mutation of Ser32 and Ser36 to alanine renders IκBα resistant to IKK phosphorylation, protecting it from proteasomal degradation and retaining its capacity to hold NFκB in an inhibited state.
A result the paper reports from its own data — it cites no other source for it, so there is none to check. The quote shows it is in the paper.
In the paper
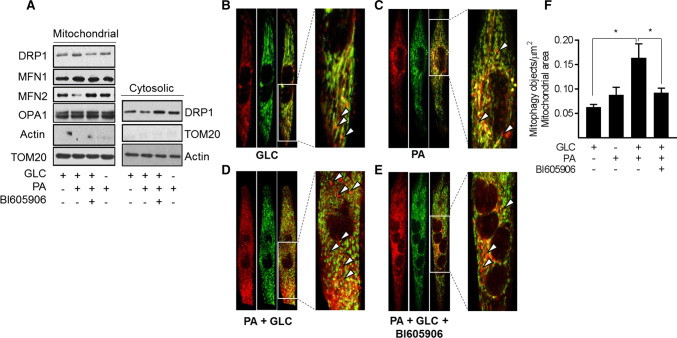
“Whilst this approach does not quantitatively assess mitophagic flux, it indicates that the combined provision of GLC and PA induces a significant increase in mitophagic particles (Fig. 8d, f) whose appearance is restrained upon cotreatment of myotubes with BI605906 (Fig. 8e, f).”
§ Proinflammatory NFkB signalling promotes mitochondrial dysfunction in skeletal muscle in response to cellular fuel overloading > Results > Effects of mitochondrial substrate overload on mitophagy
hedgeddirect- Asserted: passes — The authors put it forward as true.
- Checkable: passes — It can be checked against evidence.
- Load-bearing: passes — The paper’s conclusions depend on it.
- Based: passes — The paper gives a reason why it holds.
It may state two separate claims as one.
A result the paper reports from its own data — it cites no other source for it, so there is none to check. The quote shows it is in the paper.
In the paper
“Furthermore, allied to these observations, it is worth stressing that withholding either GLC or PA from the media or inhibiting GLC use as a metabolic fuel in the presence of PA not only averts activation of the NFkB pathway but antagonises mitochondrial fragmentation and the loss in respiratory function (Figs. 1b, 3a, 4a).”
§ Proinflammatory NFkB signalling promotes mitochondrial dysfunction in skeletal muscle in response to cellular fuel overloading > Discussion
plaindirectSingle case- Asserted: passes — The authors put it forward as true.
- Checkable: passes — It can be checked against evidence.
- Load-bearing: passes — The paper’s conclusions depend on it.
- Based: passes — The paper gives a reason why it holds.
It may state two separate claims as one.
A result the paper reports from its own data — it cites no other source for it, so there is none to check. The quote shows it is in the paper.
In the paper
“Strikingly, our data indicate that pharmacological or genetic inhibition of the IKK–NFkB axis not only obviates detrimental changes in mitochondrial morphology and function, but also helps ameliorate disturbances in insulin signalling and insulin-dependent glucose uptake.”
§ Proinflammatory NFkB signalling promotes mitochondrial dysfunction in skeletal muscle in response to cellular fuel overloading > Discussion
hedgeddirect- Asserted: passes — The authors put it forward as true.
- Checkable: passes — It can be checked against evidence.
- Load-bearing: passes — The paper’s conclusions depend on it.
- Based: passes — The paper gives a reason why it holds.
It may state two separate claims as one.
- Rests on an assumption: Mutation of Ser32 and Ser36 to alanine renders IκBα resistant to IKK phosphorylation, protecting it from proteasomal degradation and retaining its capacity to hold NFκB in an inhibited state.
A result the paper reports from its own data — it cites no other source for it, so there is none to check. The quote shows it is in the paper.
In the paper
“However, our analysis indicates that whilst exposing myotubes to two distinct mitochondrial targeted anti-oxidants (Mitotempo and Mito Q) limits fragmentation of the mitochondrial network induced by nutrient oversupply, neither compound could rescue the loss in UCP3, ANT1, or PGC1α expression or prevent the decline in mitochondrial respiratory capacity (Supplementary Fig. S4).”
§ Proinflammatory NFkB signalling promotes mitochondrial dysfunction in skeletal muscle in response to cellular fuel overloading > Results > Effects of repressing NFkB signalling on mitochondrial morphology and expression of proteins important for mitochondrial function
hedgeddirect- Asserted: passes — The authors put it forward as true.
- Checkable: passes — It can be checked against evidence.
- Load-bearing: passes — The paper’s conclusions depend on it.
- Based: passes — The paper gives a reason why it holds.
It may state two separate claims as one.
A result the paper reports from its own data — it cites no other source for it, so there is none to check. The quote shows it is in the paper.
In the paper
“pharmacological inhibition of the IKK–NFkB axis in GLC/PA-overloaded myotubes not only suppresses the relative changes in Drp1 and MFN2, but reduces fragmentation of the mitochondrial network, in which, significantly, we find was also associated with amelioration in cellular respiratory capacity and insulin action.”
§ Proinflammatory NFkB signalling promotes mitochondrial dysfunction in skeletal muscle in response to cellular fuel overloading > Discussion
plaindirect- Asserted: passes — The authors put it forward as true.
- Checkable: passes — It can be checked against evidence.
- Load-bearing: passes — The paper’s conclusions depend on it.
- Based: passes — The paper gives a reason why it holds.
It may state two separate claims as one.
In the paper
“The fact that suppressing NFkB activation in fuel-overloaded myotubes with BI605906 or 2DG antagonises loss of UCP3 and ANT-1 and that, under these circumstances, we not only see a measurable increase in mitochondrial proton leak, but observe improved insulin sensitivity in L6 myotubes (Fig. 9) and in muscle of obese Zucker rats [17] is fully congruent with this view.”
§ Proinflammatory NFkB signalling promotes mitochondrial dysfunction in skeletal muscle in response to cellular fuel overloading > Discussion
What the sources say
- Not checked yetcites [17] Lipina C et al (2013) Mitochondrial substrate availability and its role in lipid-induced insulin resistance and proinflammatory signalling in skeletal muscle. Diabetes 62:3426–3436 source
plaindirect- Asserted: passes — The authors put it forward as true.
- Checkable: passes — It can be checked against evidence.
- Load-bearing: passes — The paper’s conclusions depend on it.
- Based: passes — The paper gives a reason why it holds.
It may state two separate claims as one.
A result the paper reports from its own data — it cites no other source for it, so there is none to check. The quote shows it is in the paper.
In the paper
“The increase in Drp1 (a profission protein) and reduction in MFN2 (a profusion protein) that we see within a mitochondrial-enriched membrane fraction is fully consistent with this view.”
§ Proinflammatory NFkB signalling promotes mitochondrial dysfunction in skeletal muscle in response to cellular fuel overloading > Discussion
plaincorrelational- Asserted: passes — The authors put it forward as true.
- Checkable: passes — It can be checked against evidence.
- Load-bearing: passes — The paper’s conclusions depend on it.
- Based: passes — The paper gives a reason why it holds.
It may state two separate claims as one.
A result the paper reports from its own data — it cites no other source for it, so there is none to check. The quote shows it is in the paper.
In the paper
“we observed a significant increase in the number of mitophagic particles in myotubes subjected to GLC/PA loading, and in line with the protective effects, we suggest that the inhibition of canonical NFkB signalling confers upon mitochondrial integrity and function; this increase in mitophagy was blunted in myotubes that had been cotreated with BI606906.”
§ Proinflammatory NFkB signalling promotes mitochondrial dysfunction in skeletal muscle in response to cellular fuel overloading > Discussion
plaindirect- Asserted: passes — The authors put it forward as true.
- Checkable: passes — It can be checked against evidence.
- Load-bearing: passes — The paper’s conclusions depend on it.
- Based: passes — The paper gives a reason why it holds.
It may state two separate claims as one.
None of the sources cited for this claim have been checked yet.
In the paper
“In support of this latter idea, signalling initiated by toll-like receptor-4 (TLR-4) and the tumor necrosis factor-α (TNF-α) receptor results in activation of the NFkB pathway, which has been linked to reduced mitochondrial respiration and suppressed activation of transcriptional regulators that promote mitochondrial biogenesis and the shift towards a muscle oxidative phenotype [23, 24].”
§ Proinflammatory NFkB signalling promotes mitochondrial dysfunction in skeletal muscle in response to cellular fuel overloading > Introduction
What the sources say
- Not checked yetcites [23] Kwon OS et al (2016) Intramyocellular ceramides and skeletal muscle mitochondrial respiration are partially regulated by Toll-like receptor 4 during hindlimb unloading. Am J Physiol Regul Integr Comp Physiol 311:R879–R887 source
- Not checked yetcites [24] Remels AH et al (2010) TNF-alpha impairs regulation of muscle oxidative phenotype: implications for cachexia? FASEB J 24:5052–5062
plaindirect- Asserted: passes — The authors put it forward as true.
- Checkable: passes — It can be checked against evidence.
- Load-bearing: passes — The paper’s conclusions depend on it.
- Based: passes — The paper gives a reason why it holds.
It may state two separate claims as one.
In the paper
“This metabolic inflexibility imposes a major substrate burden on the oxidative machinery of muscle and the continued oversupply of carbon fuel eventually surpasses the respiratory drive and cellular demand for ATP synthesis [10].”
§ Proinflammatory NFkB signalling promotes mitochondrial dysfunction in skeletal muscle in response to cellular fuel overloading > Introduction
What the sources say
- Not checked yetcites [10] Muoio DM (2014) Metabolic inflexibility: when mitochondrial indecision leads to metabolic gridlock. Cell 159:1253–1262 source
plaindirect- Asserted: passes — The authors put it forward as true.
- Checkable: passes — It can be checked against evidence.
- Load-bearing: passes — The paper’s conclusions depend on it.
- Based: passes — The paper gives a reason why it holds.
It may state two separate claims as one.
None of the sources cited for this claim have been checked yet.
In the paper
“As a result, FAs undergo incomplete oxidation and greater partitioning into lipotoxic derivatives [e.g., diacylglycerol (DAG) and ceramides] which have been strongly implicated in the pathogenesis of insulin resistance [11, 12].”
§ Proinflammatory NFkB signalling promotes mitochondrial dysfunction in skeletal muscle in response to cellular fuel overloading > Introduction
What the sources say
- Not checked yetcites [11] Koves TR et al (2008) Mitochondrial overload and incomplete fatty acid oxidation contribute to skeletal muscle insulin resistance. Cell Metab 7:45–56 source
- Not checked yetcites [12] Lipina C, Hundal HS (2011) Sphingolipids: agents provocateurs in the pathogenesis of insulin resistance. Diabetologia 54:1596–1607 source
boostedcorrelational- Asserted: passes — The authors put it forward as true.
- Checkable: passes — It can be checked against evidence.
- Load-bearing: passes — The paper’s conclusions depend on it.
- Based: passes — The paper gives a reason why it holds.
It may state two separate claims as one.
A conclusion the paper draws from its own results — it cites no other source for it, so there is none to check. The quote shows it is in the paper.
In the paper
“which most likely forms part of a cellular defence mechanism designed to help limit oxidative damage/stress under these circumstances”
§ Proinflammatory NFkB signalling promotes mitochondrial dysfunction in skeletal muscle in response to cellular fuel overloading > Results > Is proinflammatory NFkB signalling a driver of ROS generation in response to nutrient overloading?
hedgedconditional- Asserted: passes — The authors put it forward as true.
- Checkable: passes — It can be checked against evidence.
- Load-bearing: fails — The paper’s conclusions may not depend on it.
- Based: passes — The paper gives a reason why it holds.
Probably not a substantial claim. The paper’s conclusions may not depend on it.
A conclusion the paper draws from its own results — it cites no other source for it, so there is none to check. The quote shows it is in the paper.
In the paper
“potentially signifying increased mitochondrial uncoupling that would also help offset ROS generation.”
§ Proinflammatory NFkB signalling promotes mitochondrial dysfunction in skeletal muscle in response to cellular fuel overloading > Results > Is increased NFkB signalling a causal factor for mitochondrial dysfunction in myotubes during nutrient overload?
hedgedconditional- Asserted: passes — The authors put it forward as true.
- Checkable: passes — It can be checked against evidence.
- Load-bearing: fails — The paper’s conclusions may not depend on it.
- Based: passes — The paper gives a reason why it holds.
Probably not a substantial claim. The paper’s conclusions may not depend on it.
In the paper
“The first utilised BI605906, a potent pharmacological inhibitor that shows high selectivity for IKKβ (IC50 = 380 nM) when tested against over 100 kinases in a panel screen [36]”
§ Proinflammatory NFkB signalling promotes mitochondrial dysfunction in skeletal muscle in response to cellular fuel overloading > Results > Is proinflammatory NFkB signalling a driver of ROS generation in response to nutrient overloading?
What the sources say
- Not checked yetcites [36] Clark K et al (2011) Novel cross-talk within the IKK family controls innate immunity. Biochem J 434:93–104 source
plain- Asserted: passes — The authors put it forward as true.
- Checkable: passes — It can be checked against evidence.
- Load-bearing: passes — The paper’s conclusions depend on it.
- Based: passes — The paper gives a reason why it holds.
It may state two separate claims as one.
A conclusion the paper draws from its own results — it cites no other source for it, so there is none to check. The quote shows it is in the paper.
In the paper
“This increase in mitochondrial-associated Drp1 may have resulted from its recruitment from a cytoplasmic pool, which showed a corresponding decline in its abundance.”
§ Proinflammatory NFkB signalling promotes mitochondrial dysfunction in skeletal muscle in response to cellular fuel overloading > Results > Effects of mitochondrial substrate overload on mitophagy
hedgedconditional- Asserted: passes — The authors put it forward as true.
- Checkable: passes — It can be checked against evidence.
- Load-bearing: fails — The paper’s conclusions may not depend on it.
- Based: passes — The paper gives a reason why it holds.
Probably not a substantial claim. The paper’s conclusions may not depend on it.
A conclusion the paper draws from its own results — it cites no other source for it, so there is none to check. The quote shows it is in the paper.
In the paper
“These nutrient-induced changes collectively signal a marked loss in mitochondrial integrity/function that impact negatively upon myocellular energy metabolism and, by extension, upon processes involved in fuel utilisation, such as glucose uptake and its regulation by insulin.”
§ Proinflammatory NFkB signalling promotes mitochondrial dysfunction in skeletal muscle in response to cellular fuel overloading > Discussion
plaindirectSingle case- Asserted: passes — The authors put it forward as true.
- Checkable: passes — It can be checked against evidence.
- Load-bearing: passes — The paper’s conclusions depend on it.
- Based: passes — The paper gives a reason why it holds.
It may state two separate claims as one.
A conclusion the paper draws from its own results — it cites no other source for it, so there is none to check. The quote shows it is in the paper.
In the paper
“It is plausible that the increased respiratory drive seen in myotubes that have been subject to fuel overloading, but in which activation of the NFkB pathway has been blunted (Fig. 6) is a benefit derived from suppressing mitochondrial ROS production (Fig. 5).”
§ Proinflammatory NFkB signalling promotes mitochondrial dysfunction in skeletal muscle in response to cellular fuel overloading > Results > Effects of repressing NFkB signalling on mitochondrial morphology and expression of proteins important for mitochondrial function
hedgedconditional- Asserted: fails — The authors may not put it forward as true.
- Checkable: passes — It can be checked against evidence.
- Load-bearing: fails — The paper’s conclusions may not depend on it.
- Based: fails — The paper may give no reason why it holds.
Probably not a substantial claim. The authors may not put it forward as true. The paper’s conclusions may not depend on it. The paper may give no reason why it holds.
A conclusion the paper draws from its own results — it cites no other source for it, so there is none to check. The quote shows it is in the paper.
In the paper
“The relative changes in mitochondrial Drp1 and MFN2 is consistent with a shift in mitochondrial dynamics that favours increased fission and would be in line with our morphological analysis (Fig. 7a).”
§ Proinflammatory NFkB signalling promotes mitochondrial dysfunction in skeletal muscle in response to cellular fuel overloading > Results > Effects of mitochondrial substrate overload on mitophagy
hedgedcorrelational- Asserted: passes — The authors put it forward as true.
- Checkable: passes — It can be checked against evidence.
- Load-bearing: passes — The paper’s conclusions depend on it.
- Based: passes — The paper gives a reason why it holds.
It may state two separate claims as one.
None of the sources cited for this claim have been checked yet.
In the paper
“we have shown previously that its cellular abundance declines dramatically when the presence of PA in GLC-containing media is raised above 0.4 mM [17, 31].”
§ Proinflammatory NFkB signalling promotes mitochondrial dysfunction in skeletal muscle in response to cellular fuel overloading > Results > Effects of repressing NFkB signalling on mitochondrial morphology and expression of proteins important for mitochondrial function
What the sources say
- Not checked yetcites [17] Lipina C et al (2013) Mitochondrial substrate availability and its role in lipid-induced insulin resistance and proinflammatory signalling in skeletal muscle. Diabetes 62:3426–3436 source
- Not checked yetcites [31] Macrae K et al (2013) Defining the role of DAG, mitochondrial function and lipid deposition in palmitate-induced proinflammatory signalling and its counter-modulation by palmitoleate. J Lipid Res 54:2366–2378 source
boosteddirect- Asserted: passes — The authors put it forward as true.
- Checkable: passes — It can be checked against evidence.
- Load-bearing: fails — The paper’s conclusions may not depend on it.
- Based: passes — The paper gives a reason why it holds.
Probably not a substantial claim. The paper’s conclusions may not depend on it.
A conclusion the paper draws from its own results — it cites no other source for it, so there is none to check. The quote shows it is in the paper.
In the paper
“This observation is most likely explained by the fact that neither anti-oxidant was able to mitigate activation of the IKK–NFkB pathway that we believe initiates the loss of key mitochondrial proteins, such as SDHA, UCP3, and ANT-1 in fuel-overloaded myotubes (Supplementary Fig. S4).”
§ Proinflammatory NFkB signalling promotes mitochondrial dysfunction in skeletal muscle in response to cellular fuel overloading > Discussion
hedgedconditional- Asserted: passes — The authors put it forward as true.
- Checkable: passes — It can be checked against evidence.
- Load-bearing: passes — The paper’s conclusions depend on it.
- Based: passes — The paper gives a reason why it holds.
It may state two separate claims as one.
None of the sources cited for this claim have been checked yet.
In the paper
“its expression in cultured myotubes and rodent skeletal muscle has been linked to modulation of fatty acid oxidation [56–58], mitochondrial integrity, and to management of ROS/oxidative stress [59–62].”
§ Proinflammatory NFkB signalling promotes mitochondrial dysfunction in skeletal muscle in response to cellular fuel overloading > Discussion
What the sources say
- Not checked yetcites [56] Costford SR et al (2008) Long-term high-fat feeding induces greater fat storage in mice lacking UCP3. Am J Physiol Endocrinol Metab 295:E1018–E1024 source
- Not checked yetcites [57] Senese R et al (2011) Uncoupling protein 3 expression levels influence insulin sensitivity, fatty acid oxidation, and related signaling pathways. Pflug Arch 461:153–164 source
- Not checked yetcites [58] MacLellan JD et al (2005) Physiological increases in uncoupling protein 3 augment fatty acid oxidation and decrease reactive oxygen species production without uncoupling respiration in muscle cells. Diabetes 54:2343–2350 source
- Not checked yetcites [59] Sellares J et al (2007) Oxidative stress time course in the rat diaphragm after freezing-thawing cycles. Respir Physiol Neurobiol 155:156–166 source
- Not checked yetcites [60] Jiang N et al (2009) Upregulation of uncoupling protein-3 in skeletal muscle during exercise: a potential antioxidant function. Free Radic Biol Med 46:138–145 source
- Not checked yetcites [61] Brand MD et al (2002) Oxidative damage and phospholipid fatty acyl composition in skeletal muscle mitochondria from mice underexpressing or overexpressing uncoupling protein 3. Biochem J 368:597–603 source
- Not checked yetcites [62] Klumpe I et al (2016) Transgenic overexpression of adenine nucleotide translocase 1 protects ischemic hearts against oxidative stress. J Mol Med (Berl) 94:645–653 source
plaincorrelational- Asserted: passes — The authors put it forward as true.
- Checkable: passes — It can be checked against evidence.
- Load-bearing: fails — The paper’s conclusions may not depend on it.
- Based: passes — The paper gives a reason why it holds.
Probably not a substantial claim. The paper’s conclusions may not depend on it.
None of the sources cited for this claim have been checked yet.
In the paper
“The production of ceramide and certain DAG species may, in turn, feedback to further suppress the activity of respiratory chain complexes [40, 41], which, associated with the reduced expression of succinate dehydrogenase (complex II) that is induced in response to chronic fuel excess, is likely to impair electron transfer within the respiratory chain.”
§ Proinflammatory NFkB signalling promotes mitochondrial dysfunction in skeletal muscle in response to cellular fuel overloading > Discussion
What the sources say
- Not checked yetcites [40] Di PM, Cocco T, Lorusso M (2000) Ceramide interaction with the respiratory chain of heart mitochondria. Biochemistry 39:6660–6668 source
- Not checked yetcites [41] Perreault L et al (2018) Intracellular localization of diacylglycerols and sphingolipids influences insulin sensitivity and mitochondrial function in human skeletal muscle. JCI Insight 3(3):e96805. https://doi.org/10.1172/jci.insight.96805 source
hedgedconditional- Asserted: passes — The authors put it forward as true.
- Checkable: passes — It can be checked against evidence.
- Load-bearing: unclear — It is unclear whether the paper’s conclusions depend on it.
- Based: passes — The paper gives a reason why it holds.
It may state two separate claims as one.
In the paper
“However, one potential mechanism by which NFkB may modulate myocellular energy metabolism is via its well-established role as a regulator of gene expression [47].”
§ Proinflammatory NFkB signalling promotes mitochondrial dysfunction in skeletal muscle in response to cellular fuel overloading > Discussion
What the sources say
- Not checked yetcites [47] Gilmore TD, Garbati MR (2011) Inhibition of NF-kappaB signaling as a strategy in disease therapy. Curr Top Microbiol Immunol 349:245–263
hedgedconditional- Asserted: passes — The authors put it forward as true.
- Checkable: passes — It can be checked against evidence.
- Load-bearing: fails — The paper’s conclusions may not depend on it.
- Based: passes — The paper gives a reason why it holds.
Probably not a substantial claim. The paper’s conclusions may not depend on it.
In the paper
“recent work in human glioblastoma cells has highlighted that activated NFkB can bind to two response elements within the gene promoter of the ADP/ATP translocase, ANT-1, resulting in its reduced expression and concomitant decline in mitochondrial ATP production [48].”
§ Proinflammatory NFkB signalling promotes mitochondrial dysfunction in skeletal muscle in response to cellular fuel overloading > Discussion
What the sources say
- Not checked yetcites [48] Zhang C et al (2017) Transcription factor NF-kappa B represses ANT1 transcription and leads to mitochondrial dysfunctions. Sci Rep 7:44708 source
plaindirect- Asserted: passes — The authors put it forward as true.
- Checkable: passes — It can be checked against evidence.
- Load-bearing: fails — The paper’s conclusions may not depend on it.
- Based: passes — The paper gives a reason why it holds.
Probably not a substantial claim. The paper’s conclusions may not depend on it. It may state two separate claims as one.
None of the sources cited for this claim have been checked yet.
In the paper
“Increased exposure of myotubes to PA and fatty acid derivatives such as ceramide promote a low mitochondrial fusion to fission ratio resulting in fragmented, discontinuous mitochondria that not only exhibit diminished capacity for respiration and ATP synthesis, but also is thought to be causally linked to impaired insulin sensitivity and metabolic function [66–68].”
§ Proinflammatory NFkB signalling promotes mitochondrial dysfunction in skeletal muscle in response to cellular fuel overloading > Discussion
What the sources say
- Not checked yetcites [66] Jheng HF et al (2012) Mitochondrial fission contributes to mitochondrial dysfunction and insulin resistance in skeletal muscle. Mol Cell Biol 32:309–319 source
- Not checked yetcites [67] Smith ME et al (2013) Mitochondrial fission mediates ceramide-induced metabolic disruption in skeletal muscle. Biochem J 456:427–439 source
- Not checked yetcites [68] Sebastian D et al (2012) Mitofusin 2 (Mfn2) links mitochondrial and endoplasmic reticulum function with insulin signaling and is essential for normal glucose homeostasis. Proc Natl Acad Sci USA 109:5523–5528 source
hedgeddirect- Asserted: passes — The authors put it forward as true.
- Checkable: passes — It can be checked against evidence.
- Load-bearing: passes — The paper’s conclusions depend on it.
- Based: passes — The paper gives a reason why it holds.
It may state two separate claims as one.
In the paper
“very recent work has shown that sustained inhibition of NFkB can adversely affect muscle development and mitochondrial function during early life its repression has no detrimental effect in adult muscle [71].”
§ Proinflammatory NFkB signalling promotes mitochondrial dysfunction in skeletal muscle in response to cellular fuel overloading > Discussion
What the sources say
- Not checked yetcites [71] Valentine JM et al (2018) NFkappaB regulates muscle development and mitochondrial function. J Gerontol A Biol Sci Med Sci. https://doi.org/10.1093/gerona/gly262 source
plaindirect- Asserted: passes — The authors put it forward as true.
- Checkable: passes — It can be checked against evidence.
- Load-bearing: passes — The paper’s conclusions depend on it.
- Based: passes — The paper gives a reason why it holds.
It may state two separate claims as one.
A conclusion the paper draws from its own results — it cites no other source for it, so there is none to check. The quote shows it is in the paper.
In the paper
“In conclusion, our findings indicate that muscle cells subjected to sustained oversupply of metabolic fuel exhibit an increase in proinflammatory NFkB signalling that is mechanistically linked to diminished mitochondrial function as evidenced by our ability to antagonise the marked decline in respiratory capacity, expression of key mitochondrial maker proteins and the increased fission and mitoph”
§ Proinflammatory NFkB signalling promotes mitochondrial dysfunction in skeletal muscle in response to cellular fuel overloading > Discussion
hedgeddirect- Asserted: passes — The authors put it forward as true.
- Checkable: passes — It can be checked against evidence.
- Load-bearing: passes — The paper’s conclusions depend on it.
- Based: passes — The paper gives a reason why it holds.
It may state two separate claims as one.
In the paper
“studies in cultured C2C12 myotubes, in which partial silencing of ANT-1 results in reduced cellular sensitivity to fatty acid-induced uncoupling and a significant reduction in insulin-stimulated glucose uptake [63].”
§ Proinflammatory NFkB signalling promotes mitochondrial dysfunction in skeletal muscle in response to cellular fuel overloading > Discussion
What the sources say
- Not checked yetcites [63] Sparks LM et al (2016) ANT1-mediated fatty acid-induced uncoupling as a target for improving myocellular insulin sensitivity. Diabetologia 59:1030–1039 source
plaindirect- Asserted: passes — The authors put it forward as true.
- Checkable: passes — It can be checked against evidence.
- Load-bearing: unclear — It is unclear whether the paper’s conclusions depend on it.
- Based: passes — The paper gives a reason why it holds.
It may state two separate claims as one.
A conclusion the paper draws from its own results — it cites no other source for it, so there is none to check. The quote shows it is in the paper.
In the paper
“One potential explanation for this apparent paradox is that whilst our mitophagy reporter assay is highly sensitive and the loss in mitochondrial proteins may be accounted for by a reduction in the transcription and/or translation of their respective genes and products, analysis of mitochondrial DNA may also capture that present within mitochondria during the early stages of the mitophagic process”
§ Proinflammatory NFkB signalling promotes mitochondrial dysfunction in skeletal muscle in response to cellular fuel overloading > Discussion
hedgedconditional- Asserted: passes — The authors put it forward as true.
- Checkable: passes — It can be checked against evidence.
- Load-bearing: fails — The paper’s conclusions may not depend on it.
- Based: passes — The paper gives a reason why it holds.
Probably not a substantial claim. The paper’s conclusions may not depend on it. It may state two separate claims as one.
In the paper
“the activation of the classical NFkB pathway in C2C12 myotubes can result in suppressed IKKα expression and that this has implications for expression of OXPHOS genes [70].”
§ Proinflammatory NFkB signalling promotes mitochondrial dysfunction in skeletal muscle in response to cellular fuel overloading > Discussion
What the sources say
- Not checked yetcites [70] Remels AH et al (2014) Activation of alternative NF-kappaB signaling during recovery of disuse-induced loss of muscle oxidative phenotype. Am J Physiol Endocrinol Metab 306:E615–E626 source
plainconditional- Asserted: passes — The authors put it forward as true.
- Checkable: passes — It can be checked against evidence.
- Load-bearing: unclear — It is unclear whether the paper’s conclusions depend on it.
- Based: passes — The paper gives a reason why it holds.
It may state two separate claims as one.
In the paper
“in addition to catalysing the exchange of cytoplasmic ADP for mitochondrial ATP, ANT-1 can mediate fatty acid-induced uncoupling via its ability to transfer fatty acid anions across the inner mitochondrial membrane [63].”
§ Proinflammatory NFkB signalling promotes mitochondrial dysfunction in skeletal muscle in response to cellular fuel overloading > Discussion
What the sources say
- Not checked yetcites [63] Sparks LM et al (2016) ANT1-mediated fatty acid-induced uncoupling as a target for improving myocellular insulin sensitivity. Diabetologia 59:1030–1039 source
plaindirect- Asserted: passes — The authors put it forward as true.
- Checkable: passes — It can be checked against evidence.
- Load-bearing: unclear — It is unclear whether the paper’s conclusions depend on it.
- Based: passes — The paper gives a reason why it holds.
It may state two separate claims as one.
The paper relies on this without support.
The precise mechanism initiating mitochondrial dysfunction and whether it contributes to insulin resistance in skeletal muscle is poorly resolved.
“Precisely how mitochondrial dysfunction is initiated and whether it contributes to insulin resistance in this tissue remains a poorly resolved issue.”
The paper relies on this without support.
The L6 myotube model and the 16 h GLC/PA overloading protocol recapitulate the metabolic and inflammatory state of skeletal muscle in obesity and Type II diabetes.
“Our findings indicate that sustained oversupply of metabolic fuel to skeletal muscle cells induces heightened NFkB signalling and that this serves as a critical driver for disturbances in mitochondrial function and morphology, redox status, and insulin signalling.”
The paper relies on this without support.
Mutation of Ser32 and Ser36 to alanine renders IκBα resistant to IKK phosphorylation, protecting it from proteasomal degradation and retaining its capacity to hold NFκB in an inhibited state.
“Mutation of Ser32 and Ser36 to alanine renders IκBα resistant to IKK phosphorylation, thereby protecting it from proteasomal degradation and retaining its capacity to hold NFκB in an inhibited state.”
The paper relies on this without support.
Mitochondria become functionally compromised when supply of metabolic fuel chronically exceeds cellular energy demand.
“This proposition is based on the view that whilst mitochondria play a crucial role in balancing energy supply with demand under normal circumstances, they become functionally compromised when supply of metabolic fuel chronically exceeds cellular energy demand.”
The paper relies on this without support.
Mitochondrial DNA copy number and citrate synthase activity are proxies of mitochondrial mass.
“Both these measures are considered a proxy of mitochondrial mass.”
The paper relies on this without support.
Studies linking classical NFkB signalling to mitochondrial dysfunction in muscle cells in response to fuel overloading are extremely sparse.
“studies linking classical NFkB signalling to mitochondrial dysfunction in muscle cells in response to fuel over loading are extremely sparse.”
The paper relies on this without support.
An increase in mitochondrial biogenesis/content may serve as an initial response to nutrient excess, but such compensation typically fails in the face of sustained nutrient oversupply.
“An increase in mitochondrial biogenesis/content may serve as an initial response to nutrient excess, but such compensation typically fails in the face of sustained nutrient oversupply.”
The paper relies on this without support.
SDHA is a critical component within both the TCA cycle and ETC, and its loss will impact negatively upon both mitochondrial processes.
“SDHA is a critical component within both the TCA cycle and ETC, and consequently, its loss will impact negatively upon both mitochondrial processes.”
The paper relies on this without support.
Non-canonical NFkB signalling, which is independent of IKKβ and IKKγ (NEMO) but dependent on IKKα dimers, can also influence mitochondrial fragmentation.
“this process can also be influenced by non-canonical NFkB signalling, which is independent of IKKβ and IKKγ (NEMO) but dependent on IKKα dimers.”
The paper relies on this without support.
ROS generated by the ETC are considered important for preserving the normal biological functionality of the respiratory chain.
“ROS generated by the ETC are considered important for preserving the normal biological functionality of the respiratory chain.”
The paper relies on this without support.
Under certain circumstances, including mitochondrial substrate overload, sustained and elevated generation of ROS supersedes the capacity of anti-oxidant defence mechanisms leading to increased oxidative stress.
“under certain circumstances, including mitochondrial substrate overload, sustained and elevated generation of ROS supersedes the capacity of anti-oxidant defence mechanisms leading to increased oxidative stress.”
The paper relies on this without support.
Notable NFkB gene targets include those encoding mitochondrial proteins or transcription factors that regulate expression of key mitochondrial genes.
“Notable NFkB gene targets include those encoding mitochondrial proteins or transcription factors that regulate expression of key mitochondrial genes.”
The paper relies on this without support.
Regardless of the stimulus promoting a shift towards greater fission, whilst some of the fragmented mitochondria may retain their functional capacity, the structural integrity of others is likely to be compromised and, if not recoverable, will be targeted for clearance by mitophagy.
“Regardless of the stimulus promoting a shift towards greater fission, whilst some of the fragmented mitochondria may retain their functional capacity, the structural integrity of others is likely to be compromised (as reflected by an overall reduction in cellular respiratory capacity) and, if not recoverable, will be targeted for clearance by mitophagy.”
Claims other papers make about this one
Each is checked against this paper’s own text: does it say what the citing paper says it does?
In the citing paper
“Moreover, proinflammatory cytokines present in the muscle trigger the nuclear factor κ-light-chain-enhancer of activated B cells (NF-κB) signaling pathways to mediate muscle degradation [8,9].”
From Nutraceuticals in the Prevention and Treatment of the Muscle Atrophy (2021) · cites this paper as [9]
Self-check
Percentages, sums and reported differences re-computed from the paper’s own numbers.
Each contradiction between two passages listed here was confirmed by an independent check.
Rated minor: it would not touch a result — a value no result rests on, a p-value that stays on the same side of the significance level, or a conflict that is clerical, resolved elsewhere in the paper, or outside its own findings.
In the paper
§ Proinflammatory NFkB signalling promotes mitochondrial dysfunction in skeletal muscle in response to cellular fuel overloading > Discussion
“this increase in mitophagy was blunted in myotubes that had been cotreated with BI606906.”
§ Proinflammatory NFkB signalling promotes mitochondrial dysfunction in skeletal muscle in response to cellular fuel overloading > Results > Effects of mitochondrial substrate overload on mitophagy
“Wild type L6 myotubes or those stably expressing a retroviral vector encoding a GFP–mCherry–Fis1 mitophagy reporter were incubated with GLC (5 mM), PA (0.4 mM) and BI605906 (10 μM) for 16 h”
Citations
Cites
1 retracted
Lipina, C., Macrae, K., Suhm, T., Weigert, C., Blachnio-Zabielska, A., Baranowski, M., Gorski, J., Burgess, K., & Hundal, H. S. (2013) · Diabetes · doi:10.2337/db13-0264 · Cited by 26
Self-citationRetractedBradford, M. M. (1976) · Analytical Biochemistry · doi:10.1016/0003-2697(76)90527-3 · Cited by 255,302
Crosstalk of reactive oxygen species and NF-κB signaling
Morgan, M. J., & Liu, Z.-G. (2011) · Cell Research · doi:10.1038/cr.2010.178 · Cited by 3,505
Dysfunction of Mitochondria in Human Skeletal Muscle in Type 2 Diabetes
Kelley, D. E., He, J., Menshikova, E. V., & Ritov, V. B. (2002) · Diabetes · doi:10.2337/diabetes.51.10.2944 · Cited by 2,321
Impaired Mitochondrial Activity in the Insulin-Resistant Offspring of Patients with Type 2 Diabetes
Petersen, K. F., Dufour, S., Befroy, D., Garcia, R., & Shulman, G. I. (2004) · New England Journal of Medicine · doi:10.1056/nejmoa031314 · Cited by 2,193
Koves, T. R., Ussher, J. R., Noland, R. C., Slentz, D., Mosedale, M., Ilkayeva, O., Bain, J., Stevens, R., Dyck, J. R. B., Newgard, C. B., et al. (2008) · Cell Metabolism · doi:10.1016/j.cmet.2007.10.013 · Cited by 1,990
Holland, W. L., Brozinick, J. T., Wang, L.-P., Hawkins, E. D., Sargent, K. M., Liu, Y., Narra, K., Hoehn, K. L., Knotts, T. A., Siesky, A., et al. (2007) · Cell Metabolism · doi:10.1016/j.cmet.2007.01.002 · Cited by 1,232
Deficiency of subsarcolemmal mitochondria in obesity and type 2 diabetes
Ritov, V. B., Menshikova, E. V., He, J., Ferrell, R. E., Goodpaster, B. H., & Kelley, D. E. (2005) · Diabetes · doi:10.2337/diabetes.54.1.8 · Cited by 887
Bonnard, C., Durand, A., Peyrol, S., Chanseaume, E., Chauvin, M.-A., Morio, B., Vidal, H., & Rieusset, J. (2008) · Journal of Clinical Investigation · doi:10.1172/jci32601 · Cited by 819
Sebastián, D., Hernández-Alvarez, M. I., Segalés, J., Sorianello, E., Muñoz, J. P., Sala, D., Waget, A., Liesa, M., Paz, J. C., Gopalacharyulu, P., et al. (2012) · Proceedings of the National Academy of Sciences · doi:10.1073/pnas.1108220109 · Cited by 673
Jheng, H.-F., Tsai, P.-J., Guo, S.-M., Kuo, L.-H., Chang, C.-S., Su, I.-J., Chang, C.-R., & Tsai, Y.-S. (2012) · Molecular and Cellular Biology · doi:10.1128/mcb.05603-11 · Cited by 650
Sparks, L. M., Xie, H., Koza, R. A., Mynatt, R., Hulver, M. W., Bray, G. A., & Smith, S. R. (2005) · Diabetes · doi:10.2337/diabetes.54.7.1926 · Cited by 629
Austin, S., & St‐Pierre, J. (2012) · Journal of Cell Science · doi:10.1242/jcs.113662 · Cited by 617
mito-QC illuminates mitophagy and mitochondrial architecture in vivo
McWilliams, T. G., Prescott, A. R., Allen, G. F. G., Tamjar, J., Munson, M. J., Thomson, C., Muqit, M. M. K., & Ganley, I. G. (2016) · The Journal of Cell Biology · doi:10.1083/jcb.201603039 · Cited by 561
Self-citationLoss of iron triggers PINK1/Parkin‐independent mitophagy
Allen, G. F. G., Toth, R., James, J., & Ganley, I. G. (2013) · The EMBO Reports · doi:10.1038/embor.2013.168 · Cited by 555
Self-citationDiacylglycerol-mediated insulin resistance
Erion, D. M., & Shulman, G. I. (2010) · Nature Medicine · doi:10.1038/nm0410-400 · Cited by 502
Metabolic Inflexibility: When Mitochondrial Indecision Leads to Metabolic Gridlock
Muoio, D. M. (2014) · Cell · doi:10.1016/j.cell.2014.11.034 · Cited by 438
Phielix, E., Schrauwen-Hinderling, V. B., Mensink, M., Lenaers, E., Meex, R., Hoeks, J., Kooi, M. E., Moonen-Kornips, E., Sels, J.-P., Hesselink, M. K. C., et al. (2008) · Diabetes · doi:10.2337/db08-0391 · Cited by 359
Oleate Reverses Palmitate-induced Insulin Resistance and Inflammation in Skeletal Muscle Cells
Coll, T., Eyre, E., Rodríguez-Calvo, R., Palomer, X., Sánchez, R. M., Merlos, M., Laguna, J. C., & Vázquez-Carrera, M. (2008) · Journal of Biological Chemistry · doi:10.1074/jbc.m708700200 · Cited by 347
The role of interleukins in insulin resistance and type 2 diabetes mellitus
Fève, B., & Bastard, J.-P. (2009) · Nature Reviews Endocrinology · doi:10.1038/nrendo.2009.62 · Cited by 343
Hajduch, E., Alessi, D. R., Hemmings, B. A., & Hundal, H. S. (1998) · Diabetes · doi:10.2337/diabetes.47.7.1006 · Cited by 335
Self-citationNovel cross-talk within the IKK family controls innate immunity
Clark, K., Peggie, M., Plater, L., Sorcek, R. J., Young, E. R. R., Madwed, J. B., Hough, J., McIver, E. G., & Cohen, P. (2011) · Biochemical Journal · doi:10.1042/bj20101701 · Cited by 326
Linking mitochondrial bioenergetics to insulin resistance via redox biology
Fisher-Wellman, K. H., & Neufer, P. D. (2012) · Trends in Endocrinology & Metabolism · doi:10.1016/j.tem.2011.12.008 · Cited by 316
Mitochondria and Reactive Oxygen Species: Physiology and Pathophysiology
Bolisetty, S., & Jaimes, E. A. (2013) · International Journal of Molecular Sciences · doi:10.3390/ijms14036306 · Cited by 287
Yuzefovych, L., Wilson, G., & Rachek, L. (2010) · American Journal of Physiology-Endocrinology and Metabolism · doi:10.1152/ajpendo.00238.2010 · Cited by 280
Fatty acid—induced inflammation and insulin resistance in skeletal muscle and liver
Boden, G. (2006) · Current Diabetes Reports · doi:10.1007/s11892-006-0031-x · Cited by 276
Weigert, C., Brodbeck, K., Staiger, H., Kausch, C., Machicao, F., Häring, H. U., & Schleicher, E. D. (2004) · Journal of Biological Chemistry · doi:10.1074/jbc.m312692200 · Cited by 269
POWELL, D. J., TURBAN, S., GRAY, A., HAJDUCH, E., & HUNDAL, H. S. (2004) · Biochemical Journal · doi:10.1042/bj20040139 · Cited by 267
Self-citationCeramide Interaction with the Respiratory Chain of Heart Mitochondria
Di Paola, M., Cocco, T., & Lorusso, M. (2000) · Biochemistry · doi:10.1021/bi9924415 · Cited by 262
Induction of proinflammatory cytokines by long-chain saturated fatty acids in human macrophages
Håversen, L., Danielsson, K. N., Fogelstrand, L., & Wiklund, O. (2008) · Atherosclerosis · doi:10.1016/j.atherosclerosis.2008.05.033 · Cited by 248
Dimopoulos, N., Watson, M., Sakamoto, K., & Hundal, H. S. (2006) · Biochemical Journal · doi:10.1042/bj20060244 · Cited by 247
Self-citationSkeletal muscle aging and the mitochondrion
Johnson, M. L., Robinson, M. M., & Nair, K. S. (2013) · Trends in Endocrinology & Metabolism · doi:10.1016/j.tem.2012.12.003 · Cited by 233
Activation of NF-κB by Palmitate in Endothelial Cells
Maloney, E. J., Sweet, I. R., Hockenbery, D. M., Pham, M., Rizzo, N. O., Tateya, S., Handa, P., Schwartz, M. W., & Kim, F. (2009) · Arteriosclerosis Thrombosis and Vascular Biology · doi:10.1161/atvbaha.109.188813 · Cited by 230
MacLellan, J. D., Gerrits, M. F., Gowing, A., Smith, P. J. S., Wheeler, M. B., & Harper, M.-E. (2005) · Diabetes · doi:10.2337/diabetes.54.8.2343 · Cited by 213
Regulation of Mitochondrial Biogenesis and Its Intersection with Inflammatory Responses
Cherry, A. D., & Piantadosi, C. A. (2015) · Antioxidants and Redox Signaling · doi:10.1089/ars.2014.6200 · Cited by 192
Álvarez-Guardia, D., Palomer, X., Coll, T., Davidson, M. M., Chan, T. O., Feldman, A. M., Laguna, J. C., & Vázquez‐Carrera, M. (2010) · Cardiovascular Research · doi:10.1093/cvr/cvq080 · Cited by 190
BRAND, M. D., PAMPLONA, R., PORTERO-OTÍN, M., REQUENA, J. R., ROEBUCK, S. J., BUCKINGHAM, J. A., CLAPHAM, J. C., & CADENAS, S. (2002) · Biochemical Journal · doi:10.1042/bj20021077 · Cited by 184
Heilbronn, L. K., Gan, S. K., Turner, N., Campbell, L. V., & Chisholm, D. J. (2007) · The Journal of Clinical Endocrinology & Metabolism · doi:10.1210/jc.2006-2210 · Cited by 184
Perreault, L., Newsom, S. A., Strauss, A., Kerege, A., Kahn, D. E., Harrison, K. A., Snell-Bergeon, J. K., Nemkov, T., D’Alessandro, A., Jackman, M. R., et al. (2018) · JCI Insight · doi:10.1172/jci.insight.96805 · Cited by 184
Iqbal, S., Ostojic, O., Singh, K., Joseph, A., & Hood, D. A. (2013) · Muscle & Nerve · doi:10.1002/mus.23838 · Cited by 169
Jové, M., Planavila, A., Laguna, J. C., & Vázquez-Carrera, M. (2005) · Endocrinology · doi:10.1210/en.2004-1560 · Cited by 133
Mitochondrial Deficiency Is Associated With Insulin Resistance
Goodpaster, B. H. (2013) · Diabetes · doi:10.2337/db12-1612 · Cited by 124
TNF-α impairs regulation of muscle oxidative phenotype: implications for cachexia?
Remels, A. H. V., Gosker, H. R., Schrauwen, P., Hommelberg, P. P. H., Sliwinski, P., Polkey, M., Galdiz, J., Wouters, E. F. M., Langen, R. C. J., & Schols, A. M. W. J. (2010) · The FASEB Journal · doi:10.1096/fj.09-150714 · Cited by 122
“Deficiency” of Mitochondria in Muscle Does Not Cause Insulin Resistance
Holloszy, J. O. (2013) · Diabetes · doi:10.2337/db12-1107 · Cited by 111
NF-κB pathway controls mitochondrial dynamics
Laforge, M., Rodrigues, V, Silvestre, R., Gautier, C., Weil, R., Corti, O., & Estaquier, J. (2016) · Cell Death & Differentiation · doi:10.1038/cdd.2015.42 · Cited by 105
Inhibition of NF-κB Signaling as a Strategy in Disease Therapy
Gilmore, T. D., & Garbati, M. R. (2010) · Current topics in microbiology and immunology · doi:10.1007/82_2010_105 · Cited by 104
Ji, C., Chen, X., Gao, C., Jiao, L., Wang, J., Xu, G., Fu, H., Guo, X., & Zhao, Y. (2011) · Journal of Bioenergetics and Biomembranes · doi:10.1007/s10863-011-9361-8 · Cited by 101
Yasuhara, R., Miyamoto, Y., Akaike, T., Akuta, T., Nakamura, M., Takami, M., Morimura, N., Yasu, K., & Kamijo, R. (2005) · Biochemical Journal · doi:10.1042/bj20041996 · Cited by 100
Jiang, N., Zhang, G., Bo, H., Qu, J., Ma, G., Cao, D., Wen, L., Liu, S., Ji, L. L., & Zhang, Y. (2009) · Free Radical Biology and Medicine · doi:10.1016/j.freeradbiomed.2008.09.026 · Cited by 93
Coll, T., Álvarez-Guardia, D., Barroso, E., Gómez-Foix, A. M., Palomer, X., Laguna, J. C., & Vázquez-Carrera, M. (2010) · Endocrinology · doi:10.1210/en.2009-1211 · Cited by 90
Saturated fatty acids and insulin resistance
Funaki, M. (2009) · The Journal of Medical Investigation · doi:10.2152/jmi.56.88 · Cited by 90
Mitochondrial fission mediates ceramide-induced metabolic disruption in skeletal muscle
Smith, M. E., Tippetts, T. S., Brassfield, E. S., Tucker, B. J., Ockey, A., Swensen, A. C., Anthonymuthu, T. S., Washburn, T. D., Kane, D. A., Prince, J. T., et al. (2013) · Biochemical Journal · doi:10.1042/bj20130807 · Cited by 87
Sphingolipids: agents provocateurs in the pathogenesis of insulin resistance
Lipina, C., & Hundal, H. S. (2011) · Diabetologia · doi:10.1007/s00125-011-2127-3 · Cited by 83
Self-citationGreen, C. J., Macrae, K., Fogarty, S., Hardie, D. G., Sakamoto, K., & Hundal, H. S. (2011) · Biochemical Journal · doi:10.1042/bj20101517 · Cited by 78
Self-citationLong-term high-fat feeding induces greater fat storage in mice lacking UCP3
Costford, S. R., Chaudhry, S. N., Crawford, S. A., Salkhordeh, M., & Harper, M.-E. (2008) · American Journal of Physiology-Endocrinology and Metabolism · doi:10.1152/ajpendo.00779.2007 · Cited by 64
Promoter analysis of the human succinate dehydrogenase iron‐protein gene
Au, H. C., & Scheffler, I. E. (1998) · European Journal of Biochemistry · doi:10.1046/j.1432-1327.1998.2510164.x · Cited by 61
Lipid induced overexpression of NF-κB in skeletal muscle cells is linked to insulin resistance
Barma, P., Bhattacharya, S., Bhattacharya, A., Kundu, R., Dasgupta, S., Biswas, A., Bhattacharya, S., Roy, S. S., & Bhattacharya, S. (2009) · Biochimica et Biophysica Acta (BBA) - Molecular Basis of Disease · doi:10.1016/j.bbadis.2008.11.014 · Cited by 59
4-Hydroxynonenal induces Nrf2-mediated UCP3 upregulation in mouse cardiomyocytes
López-Bernardo, E., Anedda, A., Sánchez-Pérez, P., Acosta‐Iborra, B., & Cadenas, S. (2015) · Free Radical Biology and Medicine · doi:10.1016/j.freeradbiomed.2015.03.032 · Cited by 58
Senese, R., Valli, V., Moreno, M., Lombardi, A., Busiello, R. A., Cioffi, F., Silvestri, E., Goglia, F., Lanni, A., & de Lange, P. (2011) · Pflügers Archiv - European Journal of Physiology · doi:10.1007/s00424-010-0892-3 · Cited by 52
Yoon, J. H., Kim, D., Jang, J.-H., Ghim, J., Park, S., Song, P., Kwon, Y., Kim, J. J., Hwang, D., Bae, Y., et al. (2015) · Molecular & Cellular Proteomics · doi:10.1074/mcp.m114.039651 · Cited by 46
Macrae, K., Stretton, C., Lipina, C., Blachnio-Zabielska, A., Baranowski, M., Gorski, J., Marley, A., & Hundal, H. S. (2013) · Journal of Lipid Research · doi:10.1194/jlr.m036996 · Cited by 46
Self-citationTranscription factor NF-kappa B represses ANT1 transcription and leads to mitochondrial dysfunctions
Zhang, C., Jiang, H., Wang, P., Liu, H., & Sun, X. (2017) · Scientific Reports · doi:10.1038/srep44708 · Cited by 37
Klumpe, I., Savvatis, K., Westermann, D., Tschöpe, C., Rauch, U., Landmesser, U., Schultheiss, H.-P., & Dörner, A. (2016) · Journal of Molecular Medicine · doi:10.1007/s00109-016-1413-4 · Cited by 35
Sparks, L. M., Gemmink, A., Phielix, E., Bosma, M., Schaart, G., Moonen-Kornips, E., Jörgensen, J. A., Nascimento, E. B. M., Hesselink, M. K. C., Schrauwen, P., et al. (2016) · Diabetologia · doi:10.1007/s00125-016-3885-8 · Cited by 34
Kwon, O. S., Nelson, D. S., Barrows, K. M., O'Connell, R. M., & Drummond, M. J. (2016) · American Journal of Physiology-Regulatory, Integrative and Comparative Physiology · doi:10.1152/ajpregu.00253.2016 · Cited by 24
Nisr, R. B., & Affourtit, C. (2016) · Biochimica et Biophysica Acta (BBA) - Bioenergetics · doi:10.1016/j.bbabio.2016.04.286 · Cited by 23
Self-citationNFκB Regulates Muscle Development and Mitochondrial Function
Valentine, J. M., Li, M. E., Shoelson, S. E., Zhang, N., Reddick, R. L., & Musi, N. (2020) · The Journals of Gerontology: Series A · doi:10.1093/gerona/gly262 · Cited by 23
Remels, A. H. V., Pansters, N. A., Gosker, H. R., Schols, A. M. W. J., & Langen, R. C. J. (2014) · American Journal of Physiology-Endocrinology and Metabolism · doi:10.1152/ajpendo.00452.2013 · Cited by 16
Insulin-stimulated Rac1-GTP binding is not impaired by palmitate treatment in L6 myotubes
Stierwalt, H. D., Ehrlicher, S. E., Bergman, B. C., Robinson, M. M., & Newsom, S. A. (2018) · Physiological Reports · doi:10.14814/phy2.13956 · Cited by 13
Senn, J. J. (2010) · Journal of Biological Chemistry · doi:10.1074/jbc.a109.513304 · Cited by 8
Oxidative stress time course in the rat diaphragm after freezing–thawing cycles
Sellares, J., Mas, S., Melo, E., Sánchez, F., Marin, J., Gea, J., & Barreiro, E. (2007) · Respiratory Physiology & Neurobiology · doi:10.1016/j.resp.2006.05.008 · Cited by 7
Cited by
Sorted by citations
The crucial role and mechanism of insulin resistance in metabolic disease
Zhao, X., An, X., Yang, C., Sun, W., Ji, H., & Lian, F. (2023) · Frontiers in Endocrinology · doi:10.3389/fendo.2023.1149239 · Cited by 675
Oxidative Stress, Plant Natural Antioxidants, and Obesity
Pérez-Torres, I., Castrejón-Téllez, V., Soto, M. E., Rubio-Ruiz, M. E., Manzano-Pech, L., & Guarner‐Lans, V. (2021) · International Journal of Molecular Sciences · doi:10.3390/ijms22041786 · Cited by 437
Mitochondrial dysfunction: roles in skeletal muscle atrophy
Chen, X., Ji, Y., Liu, R., Zhu, X., Wang, K., Yang, X., Liu, B., Gao, Z., Huang, Y. H., Shen, Y., et al. (2023) · Journal of Translational Medicine · doi:10.1186/s12967-023-04369-z · Cited by 362
Insulin resistance and insulin sensitizing agents
Mastrototaro, L., & Roden, M. (2021) · Metabolism · doi:10.1016/j.metabol.2021.154892 · Cited by 274
Small Molecule NF-κB Pathway Inhibitors in Clinic
Ramadass, V., Vaiyapuri, T., & Tergaonkar, V. (2020) · International Journal of Molecular Sciences · doi:10.3390/ijms21145164 · Cited by 214
Metadata
- Authors
- Nisr, R. B., Shah, D. S., Ganley, I. G., & Hundal, H. S.
- Affiliations
- University of Dundee (GB)
- Corresponding author
- Hundal, Harinder S.
- Venue
- Cellular and Molecular Life Sciences
- Published
- 2019-05-17
- Volume
- 76
- Issue
- 24
- Pages
- 4887-4904
- ISSN
- 1420-682X (ISSN-L)
- 1420-9071
- PMC
- PMC6881256
- OpenAlex
- W2946154416
- Cited by
- 142
- References
- 71
- Citations by year
- 2026: 20 · 2025: 12 · 2024: 21 · 2023: 29 · 2022: 18 · 2021: 23 · 2020: 15 · 2019: 4
- FWCI
- 4.97
- Type
- journal article
- Language
- en
- Open access
- hybrid
- doi.org
- Locations
- Cellular and Molecular Life Sciences (publishedVersion, cc-by)
- Europe PMC (PubMed Central) (publishedVersion, cc-by)
- PubMed Central (publishedVersion, cc-by)
- PubMed (publishedVersion)
- Discovery Research Portal (University of Dundee) (submittedVersion, cc-by)
- Funders
- Diabetes UK
- Biotechnology and Biological Sciences Research Council
- Medical Research Council UK
- Topics
- Life Sciences › Biochemistry, Genetics and Molecular Biology › Molecular Biology › Mitochondrial Function and Pathology
- Health Sciences › Medicine › Physiology (medical) › Adipose Tissue and Metabolism
- Life Sciences › Biochemistry, Genetics and Molecular Biology › Molecular Biology › Muscle Physiology and Disorders
- Keywords
- NF-κB signaling, skeletal muscle, mitochondrial dysfunction, nutrient excess, insulin resistance, mitochondrial dynamics, mitochondrial fragmentation, mitophagy, PGC-1α, reactive oxygen species, palmitate, obesity, diabetes mellitus, mitochondrial respiratory capacity, L6 myotubes, interleukin-6, IKKβ
- MeSH terms
- Peroxisome Proliferator-Activated Receptor Gamma Coactivator 1-alpha, Nutrients, Diabetes Mellitus, Energy Metabolism, Glucose, Humans, Inflammation, Insulin, Insulin Resistance, Mitochondria, Muscle, Obesity, Signal Transduction, NF-kappa B, Muscle, Skeletal, Muscle Fibers, Skeletal, Mitophagy
About these checks
Registry, retraction, Cites and statistics results are computed, not judged, with one exception: a printed reference that no index lists is read once by a model before it counts as a citation error. Claims are extracted by a model and kept only when their quote appears verbatim in the text; each cited source is then checked, with a model’s help, for whether it says what the claim relies on. Those verdicts can be wrong — read the claim’s quote and the cited source before relying on one.
A language model drew the claims from the paper on 2026-10-10, under version 3 of the claim definition (model deepseek-v4.1-flash, prompt extract-v3).
A second model labelled each claim on 2026-10-10 (model jev-1.13-20260917, definition revision gold-guideline-v0.2).
Cited sources are checked with a language model’s help (gpt-6-sol).
Statistics and arithmetic are recomputed, not judged.
Confidence bands are shown only for fields calibrated on our annotated test set. None is calibrated yet, so no band is shown.
What counts as a claim ›How we measure confidence ›How we check this ›
Are you an author, or do you see a problem with this page? Request a review
