

The DOI matches its Crossref record; 12 of the 12 references it cites were found in a registry or an index.
Truncated tau interferes with the autophagy and endolysosomal pathway and results in lipid accumulation
Published version of a preprint
Abstract
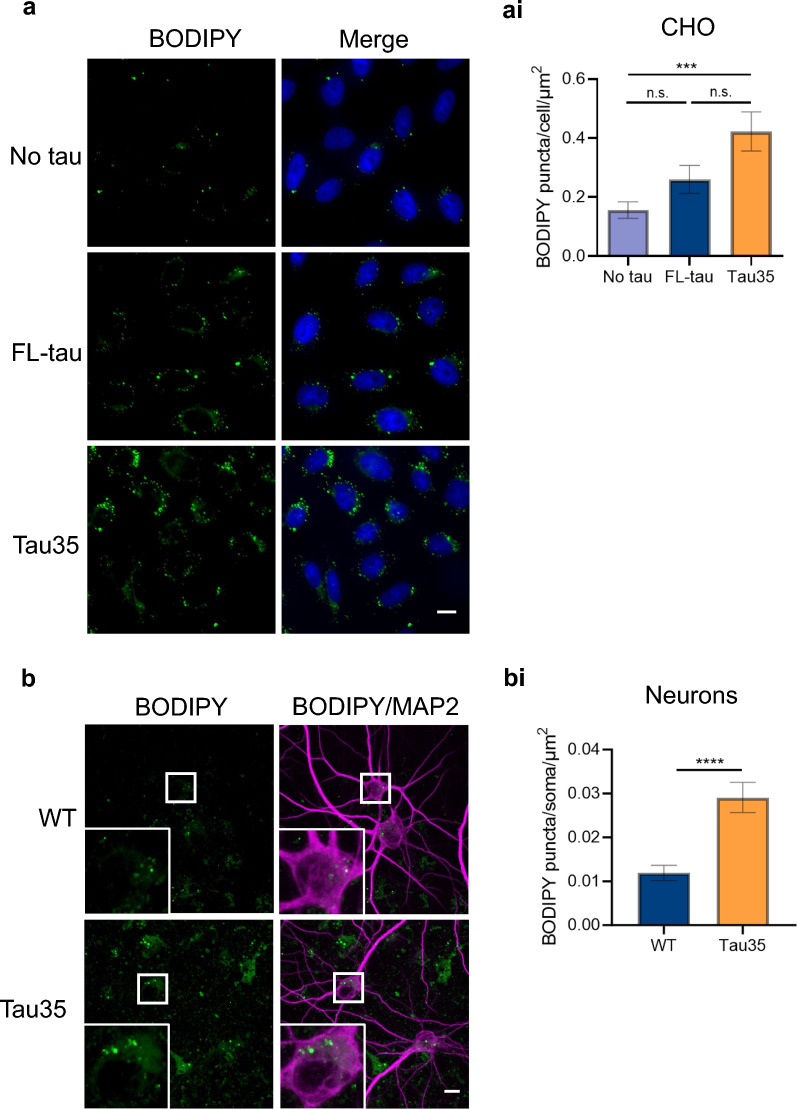
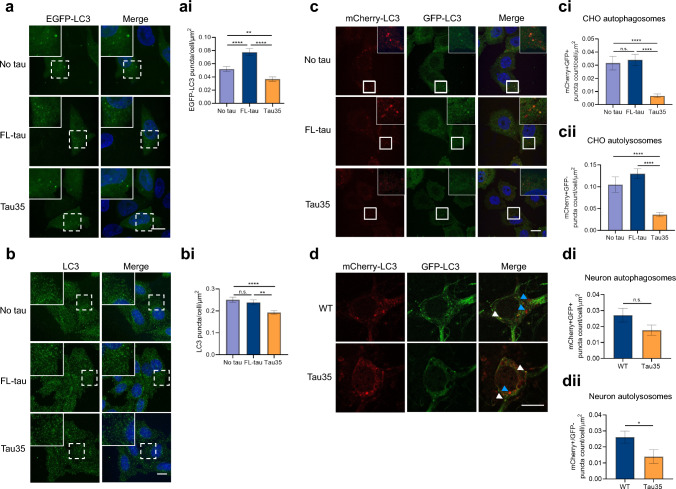
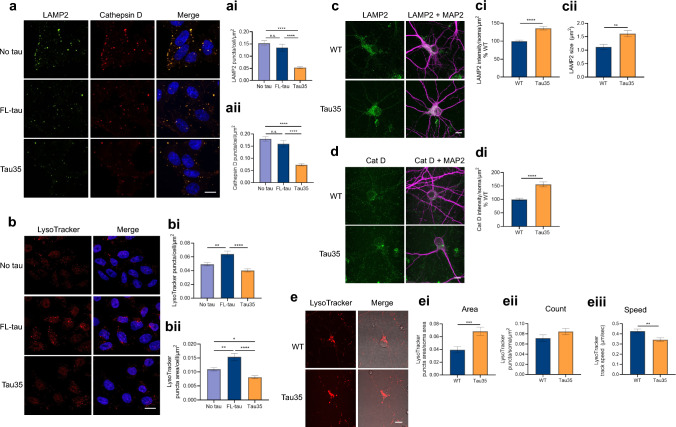
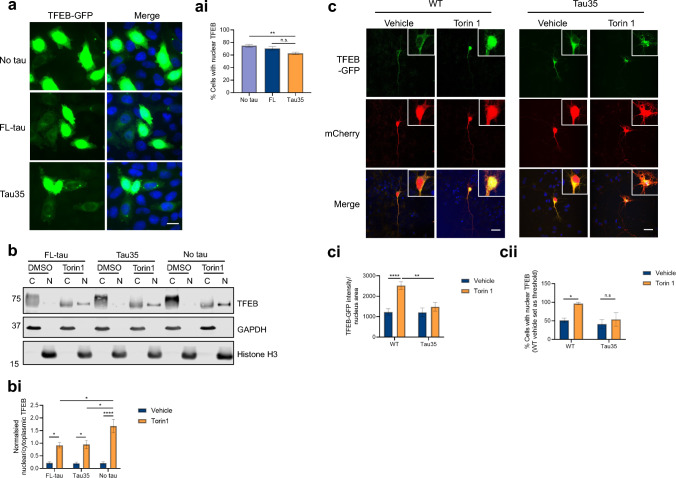
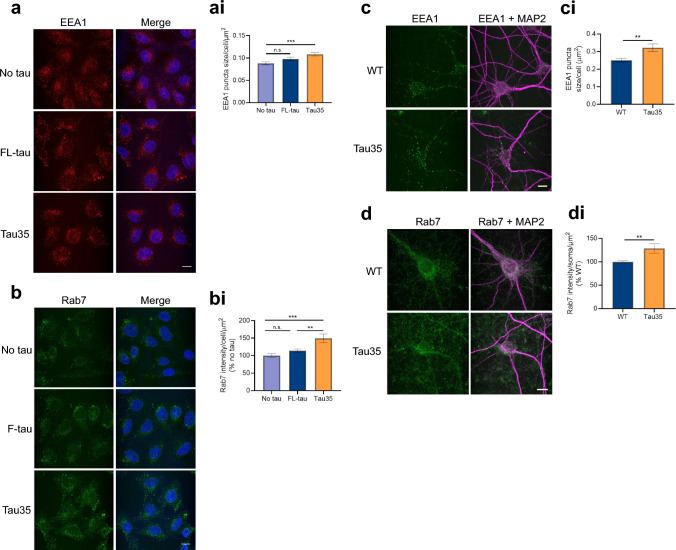
The autophagy-lysosomal pathway plays a critical role in the clearance of tau protein aggregates that deposit in the brain in tauopathies, and defects in this system are associated with disease pathogenesis. Here, we report that expression of Tau35, a tauopathy-associated carboxy-terminal fragment of tau, leads to lipid accumulation in cell lines and primary cortical neurons. Our findings suggest that this is likely due to a deleterious block of autophagic clearance and lysosomal degradative capacity by Tau35. Notably, upon induction of autophagy by Torin 1, Tau35 inhibited nuclear translocation of transcription factor EB (TFEB), a key regulator of lysosomal biogenesis. Both cell lines and primary cortical neurons expressing Tau35 also exhibited changes in endosomal protein expression. These findings implicate autophagic and endolysosomal dysfunction as key pathological mechanisms through which disease-associated tau fragments could lead to the development and progression of tauopathy.
Overview
The claims and statistics of this paper haven’t been checked yet.
Run the check — free, no account needed. It reads the open-access text and checks the sources it cites.
Integrity signals
Registry
Cites
Statistics
Figures
Verification
Claims the paper makes
The claims and statistics of this paper haven’t been checked yet.
Run the check — free, no account needed. It reads the open-access text and checks the sources it cites.
Claims other papers make about this one
Each is checked against this paper’s own text: does it say what the citing paper says it does?
The source backs part of the claim, not all of it — or backs it for a different population, condition or comparison.
In the citing paper
“Previous evidence suggests blocking autophagic flux by Bafilomycin A1 increases tau and lysosomal lipid accumulation42–46.”
From GRAMD1B is a regulator of lipid homeostasis, autophagic flux and phosphorylated tau (2025) · cites this paper as [42]
Experimental — accuracy not yet measured
Self-check
Percentages, sums and reported differences re-computed from the paper’s own numbers.
The self-check needs the paper’s full text.
Citations
Cites
How to Interpret LC3 Immunoblotting
Mizushima, N., & Yoshimori, T. (2007) · Autophagy · doi:10.4161/auto.4600 · Cited by 2,595
Autophagy and Neurodegeneration: Pathogenic Mechanisms and Therapeutic Opportunities
Menzies, F. M., Fleming, A., Caricasole, A., Bento, C. F., Andrews, S. P., Ashkenazi, A., Füllgrabe, J., Jackson, A., Jimenez Sanchez, M., Karabiyik, C., et al. (2017) · Neuron · doi:10.1016/j.neuron.2017.01.022 · Cited by 1,134 · cited 1×
“Autophagy is a highly conserved process, playing an essential role in regulating cell homeostasis and prolonging cell survival, through provision of energy and dietary components from recycling of intracellular proteins and organelles [13].”
BackgroundTau fragmentation, aggregation and clearance: the dual role of lysosomal processing
Wang, Y., Martinez-Vicente, M., Krüger, U., Kaushik, S., Wong, E., Mandelkow, E.-M., Cuervo, A. M., & Mandelkow, E. (2009) · Human Molecular Genetics · doi:10.1093/hmg/ddp367 · Cited by 617 · cited 2×
“Indeed, alterations in both pathways have been linked to AD [11, 12].”
BackgroundLeeman, D. S., Hebestreit, K., Ruetz, T., Webb, A. E., McKay, A., Pollina, E. A., Dulken, B. W., Zhao, X., Yeo, R. W., Ho, T. T., et al. (2018) · Science · doi:10.1126/science.aag3048 · Cited by 528
Vanlandingham, P. A., & Ceresa, B. P. (2009) · Journal of Biological Chemistry · doi:10.1074/jbc.m809277200 · Cited by 441
Nixon, R. A. (2017) · The FASEB Journal · doi:10.1096/fj.201700359 · Cited by 400 · cited 2×
“Disrupted endosomal protein expression has been reported within neurons in AD, with increasing evidence that disruption in endosomal trafficking is an early defect in AD [51].”
BackgroundApoE4 Impairs Neuron-Astrocyte Coupling of Fatty Acid Metabolism
Qi, G., Mi, Y., Shi, X., Gu, H., Brinton, R. D., & Yin, F. (2021) · Cell Reports · doi:10.1016/j.celrep.2020.108572 · Cited by 379
Cataldo, A. M., Barnett, J. L., Berman, S. A., Li, J., Quarless, S., Bursztajn, S., Lippa, C., & Nixon, R. A. (1995) · Neuron · doi:10.1016/0896-6273(95)90324-0 · Cited by 379
Stimulation of autophagy reduces neurodegeneration in a mouse model of human tauopathy
Schaeffer, V., Lavenir, I., Ozcelik, S., Tolnay, M., Winkler, D. T., & Goedert, M. (2012) · Brain · doi:10.1093/brain/aws143 · Cited by 343
Rapamycin attenuates the progression of tau pathology in P301S tau transgenic mice.
Ozcelik, S., Fraser, G., Castets, P., Schaeffer, V., Skachokova, Z., Breu, K., Clavaguera, F., Sinnreich, M., Kappos, L., Goedert, M., et al. (2013) · PLoS ONE · doi:10.1371/journal.pone.0062459 · Cited by 226
Endo-lysosomal dysregulations and late-onset Alzheimer’s disease: impact of genetic risk factors
Van Acker, Z. P., Bretou, M., & Annaert, W. (2019) · Molecular Neurodegeneration · doi:10.1186/s13024-019-0323-7 · Cited by 222
Degradation of tau protein by autophagy and proteasomal pathways
Wang, Y., & Mandelkow, E. (2012) · Biochemical Society Transactions · doi:10.1042/bst20120071 · Cited by 166
Research works printed but not linked: 56
- Guo T, Noble W, Hanger DP (2017) Roles of tau protein in health and disease. Acta Neuropathol 133(5):665–704 · DOI · Paper page
- Wang Y, Mandelkow E (2016) Tau in physiology and pathology. Nat Rev Neurosci 17(1):5–21 · DOI · Paper page
- Morris M, Knudsen GM, Maeda S, Trinidad JC, Ioanoviciu A, Burlingame AL, Mucke L (2015) Tau post-translational modifications in wild-type and human amyloid precursor protein transgenic mice. Nat Neurosci 18(8):1183–1189 · DOI · Paper page
- Chesser AS, Pritchard SM, Johnson GV (2013) Tau clearance mechanisms and their possible role in the pathogenesis of Alzheimer disease. Front Neurol 4:122 · DOI · Paper page
- Goedert M (2016) The ordered assembly of tau is the gain-of-toxic function that causes human tauopathies. Alzheimers Dement 12(10):1040–1050 · DOI
- Marciniak E et al (2017) Tau deletion promotes brain insulin resistance. J Exp Med 214(8):2257–2269 · DOI · Paper page
- Zhang Y, Chen X, Zhao Y, Ponnusamy M, Liu Y (2017) The role of ubiquitin proteasomal system and autophagy-lysosome pathway in Alzheimer’s disease. Rev Neurosci 28(8):861–868 · DOI
- Rodriguez-Martin T, Cuchillo-Ibanez I, Noble W, Nyenya F, Anderton BH, Hanger DP (2013) Tau phosphorylation affects its axonal transport and degradation. Neurobiol Aging 34(9):2146–2157 · DOI
- Vaz-Silva J, Gomes P, Jin Q, Zhu M, Zhuravleva V, Quintremil S, Meira T, Silva J, Dioli C, Soares-Cunha C, Daskalakis NP, Sousa N, Sotiropoulos I, Waites CL (2018) Endolysosomal degradation of Tau and its role in glucocorticoid-driven hippocampal malfunction. EMBO J. https://doi.org/10.15252/embj.201899084 · DOI · Paper page
- Piras A, Collin L, Gruninger F, Graff C, Ronnback A (2016) Autophagic and lysosomal defects in human tauopathies: analysis of post-mortem brain from patients with familial Alzheimer disease, corticobasal degeneration and progressive supranuclear palsy. Acta Neuropathol Commun 4:22 · DOI · Paper page
- Singh R, Kaushik S, Wang Y, Xiang Y, Novak I, Komatsu M, Tanaka K, Cuervo AM, Czaja MJ (2009) Autophagy regulates lipid metabolism. Nature 458(7242):1131–1135 · DOI · Paper page
- Ward C, Martinez-Lopez N, Otten EG, Carroll B, Maetzel D, Singh R, Sarkar S, Korolchuk VI (2016) Autophagy, lipophagy and lysosomal lipid storage disorders. Biochim Biophys Acta 1861(4):269–284 · DOI
- Farmer BC, Walsh AE, Kluemper JC, Johnson LA (2020) Lipid droplets in neurodegenerative disorders. Front Neurosci 14:742 · DOI · Paper page
- Hamilton LK, Dufresne M, Joppe SE, Petryszyn S, Aumont A, Calon F, Barnabe-Heider F, Furtos A, Parent M, Chaurand P, Fernandes KJ (2015) Aberrant lipid metabolism in the forebrain niche suppresses adult neural stem cell proliferation in an animal model of Alzheimer’s disease. Cell Stem Cell 17(4):397–411 · DOI · Paper page
- Pani A et al (2009) Accumulation of neutral lipids in peripheral blood mononuclear cells as a distinctive trait of Alzheimer patients and asymptomatic subjects at risk of disease. BMC Med 7:66 · DOI
- Napolitano G, Ballabio A (2016) TFEB at a glance. J Cell Sci 129(13):2475–2481 · DOI
- Napolitano G, Esposito A, Choi H, Matarese M, Benedetti V, Di Malta C, Monfregola J, Medina DL, Lippincott-Schwartz J, Ballabio A (2018) mTOR-dependent phosphorylation controls TFEB nuclear export. Nat Commun 9(1):3312 · DOI · Paper page
- Akwa Y et al (2023) Stimulation of synaptic activity promotes TFEB-mediated clearance of pathological MAPT/Tau in cellular and mouse models of tauopathies. Autophagy 19(2):660–677 · DOI
- Polito VA, Li H, Martini-Stoica H, Wang B, Yang L, Xu Y, Swartzlander DB, Palmieri M, di Ronza A, Lee VM, Sardiello M, Ballabio A, Zheng H (2014) Selective clearance of aberrant tau proteins and rescue of neurotoxicity by transcription factor EB. EMBO Mol Med 6(9):1142–1160 · DOI
- Song JX, Malampati S, Zeng Y, Durairajan SSK, Yang CB, Tong BC, Iyaswamy A, Shang WB, Sreenivasmurthy SG, Zhu Z, Cheung KH, Lu JH, Tang C, Xu N, Li M (2020) A small molecule transcription factor EB activator ameliorates beta-amyloid precursor protein and Tau pathology in Alzheimer’s disease models. Aging Cell 19(2):e13069 · DOI
- Wray S, Saxton M, Anderton BH, Hanger DP (2008) Direct analysis of tau from PSP brain identifies new phosphorylation sites and a major fragment of N-terminally cleaved tau containing four microtubule-binding repeats. J Neurochem 105(6):2343–2352 · DOI · Paper page
- Tamagnini F, Walsh DA, Brown JT, Bondulich MK, Hanger DP, Randall AD (2017) Hippocampal neurophysiology is modified by a disease-associated C-terminal fragment of tau protein. Neurobiol Aging 60:44–56 · DOI
- Bondulich MK, Guo T, Meehan C, Manion J, Rodriguez Martin T, Mitchell JC, Hortobagyi T, Yankova N, Stygelbout V, Brion JP, Noble W, Hanger DP (2016) Tauopathy induced by low level expression of a human brain-derived tau fragment in mice is rescued by phenylbutyrate. Brain 139(8):2290–2306 · DOI
- Guo T, Dakkak D, Rodriguez-Martin T, Noble W, Hanger DP (2019) A pathogenic tau fragment compromises microtubules, disrupts insulin signaling and induces the unfolded protein response. Acta Neuropathol Commun 7(1):2 · DOI
- Bader CA, Shandala T, Carter EA, Ivask A, Guinan T, Hickey SM, Werrett MV, Wright PJ, Simpson PV, Stagni S, Voelcker NH, Lay PA, Massi M, Plush SE, Brooks DA (2016) A molecular probe for the detection of polar lipids in live cells. PLoS One 11(8):e0161557 · DOI
- Kabeya Y, Mizushima N, Ueno T, Yamamoto A, Kirisako T, Noda T, Kominami E, Ohsumi Y, Yoshimori T (2000) LC3, a mammalian homologue of yeast Apg8p, is localized in autophagosome membranes after processing. EMBO J 19(21):5720–5728 · DOI · Paper page
- Sardiello M, Palmieri M, di Ronza A, Medina DL, Valenza M, Gennarino VA, Di Malta C, Donaudy F, Embrione V, Polishchuk RS, Banfi S, Parenti G, Cattaneo E, Ballabio A (2009) A gene network regulating lysosomal biogenesis and function. Science 325(5939):473–477 · DOI · Paper page
- Puertollano R, Ferguson SM, Brugarolas J, Ballabio A (2018) The complex relationship between TFEB transcription factor phosphorylation and subcellular localization. EMBO J. https://doi.org/10.15252/embj.201798804 · DOI
- Roczniak-Ferguson A, Petit CS, Froehlich F, Qian S, Ky J, Angarola B, Walther TC, Ferguson SM (2012) The transcription factor TFEB links mTORC1 signaling to transcriptional control of lysosome homeostasis. Sci Signal 5(228):ra42 · DOI
- Settembre C, Zoncu R, Medina DL, Vetrini F, Erdin S, Erdin S, Huynh T, Ferron M, Karsenty G, Vellard MC, Facchinetti V, Sabatini DM, Ballabio A (2012) A lysosome-to-nucleus signalling mechanism senses and regulates the lysosome via mTOR and TFEB. EMBO J 31(5):1095–1108 · DOI · Paper page
- Mu FT, Callaghan JM, Steele-Mortimer O, Stenmark H, Parton RG, Campbell PL, McCluskey J, Yeo JP, Tock EP, Toh BH (1995) EEA1, an early endosome-associated protein. EEA1 is a conserved alpha-helical peripheral membrane protein flanked by cysteine “fingers” and contains a calmodulin-binding IQ motif. J Biol Chem 270(22):13503–13511 · DOI
- Nixon RA (2013) The role of autophagy in neurodegenerative disease. Nat Med 19(8):983–997 · DOI · Paper page
- Nixon RA, Wegiel J, Kumar A, Yu WH, Peterhoff C, Cataldo A, Cuervo AM (2005) Extensive involvement of autophagy in Alzheimer disease: an immuno-electron microscopy study. J Neuropathol Exp Neurol 64(2):113–122 · DOI · Paper page
- Lim F, Hernandez F, Lucas JJ, Gomez-Ramos P, Moran MA, Avila J (2001) FTDP-17 mutations in tau transgenic mice provoke lysosomal abnormalities and Tau filaments in forebrain. Mol Cell Neurosci 18(6):702–714 · DOI
- Hamano T, Gendron TF, Causevic E, Yen SH, Lin WL, Isidoro C, Deture M, Ko LW (2008) Autophagic-lysosomal perturbation enhances tau aggregation in transfectants with induced wild-type tau expression. Eur J Neurosci 27(5):1119–1130 · DOI · Paper page
- Auer IA, Schmidt ML, Lee VM, Curry B, Suzuki K, Shin RW, Pentchev PG, Carstea ED, Trojanowski JQ (1995) Paired helical filament tau (PHFtau) in Niemann-Pick type C disease is similar to PHFtau in Alzheimer’s disease. Acta Neuropathol 90(6):547–551 · DOI
- Cao J, Zhong MB, Toro CA, Zhang L, Cai D (2019) Endo-lysosomal pathway and ubiquitin-proteasome system dysfunction in Alzheimer’s disease pathogenesis. Neurosci Lett 703:68–78 · DOI
- Cataldo AM, Hamilton DJ, Nixon RA (1994) Lysosomal abnormalities in degenerating neurons link neuronal compromise to senile plaque development in Alzheimer disease. Brain Res 640(1–2):68–80 · DOI · Paper page
- Corlier F et al (2015) Modifications of the endosomal compartment in peripheral blood mononuclear cells and fibroblasts from Alzheimer’s disease patients. Transl Psychiatry 5(7):e595 · DOI
- Jiang S, Bhaskar K (2020) Degradation and transmission of tau by autophagic-endolysosomal networks and potential therapeutic targets for tauopathy. Front Mol Neurosci 13:586731 · DOI
- Wu JW, Herman M, Liu L, Simoes S, Acker CM, Figueroa H, Steinberg JI, Margittai M, Kayed R, Zurzolo C, Di Paolo G, Duff KE (2013) Small misfolded Tau species are internalized via bulk endocytosis and anterogradely and retrogradely transported in neurons. J Biol Chem 288(3):1856–1870 · DOI · Paper page
- Calafate S, Flavin W, Verstreken P, Moechars D (2016) Loss of Bin1 promotes the propagation of tau pathology. Cell Rep 17(4):931–940 · DOI · Paper page
- Yao J, Irwin RW, Zhao L, Nilsen J, Hamilton RT, Brinton RD (2009) Mitochondrial bioenergetic deficit precedes Alzheimer’s pathology in female mouse model of Alzheimer’s disease. Proc Natl Acad Sci USA 106(34):14670–14675 · DOI · Paper page
- Wang H, Muthu Karuppan MK, Devadoss D, Nair M, Chand HS, Lakshmana MK (2021) TFEB protein expression is reduced in aged brains and its overexpression mitigates senescence-associated biomarkers and memory deficits in mice. Neurobiol Aging 106:26–36 · DOI
- Wang H, Wang R, Xu S, Lakshmana MK (2016) Transcription factor EB is selectively reduced in the nuclear fractions of Alzheimer’s and amyotrophic lateral sclerosis brains. Neurosci J 2016:4732837 · DOI
- Krüger U, Wang Y, Kumar S, Mandelkow EM (2012) Autophagic degradation of tau in primary neurons and its enhancement by trehalose. Neurobiol Aging 33(10):2291–2305 · DOI · Paper page
- Martina JA, Chen Y, Gucek M, Puertollano R (2012) MTORC1 functions as a transcriptional regulator of autophagy by preventing nuclear transport of TFEB. Autophagy 8(6):903–914 · DOI · Paper page
- Li Y et al (2016) Protein kinase C controls lysosome biogenesis independently of mTORC1. Nat Cell Biol 18(10):1065–1077 · DOI
- Palmieri M et al (2017) mTORC1-independent TFEB activation via Akt inhibition promotes cellular clearance in neurodegenerative storage diseases. Nat Commun 8:14338 · DOI · Paper page
- Xu Y, Du S, Marsh JA, Horie K, Sato C, Ballabio A, Karch CM, Holtzman DM, Zheng H (2020) TFEB regulates lysosomal exocytosis of tau and its loss of function exacerbates tau pathology and spreading. Mol Psychiatry 26:5925–5939 · DOI
- Zhang K et al (2015) The C9orf72 repeat expansion disrupts nucleocytoplasmic transport. Nature 525(7567):56–61 · DOI · Paper page
- Eftekharzadeh B et al (2018) Tau protein disrupts nucleocytoplasmic transport in Alzheimer’s disease. Neuron 99(5):925–940 (e7) · DOI · Paper page
- Jackson WT, Giddings TH Jr, Taylor MP, Mulinyawe S, Rabinovitch M, Kopito RR, Kirkegaard K (2005) Subversion of cellular autophagosomal machinery by RNA viruses. PLoS Biol 3(5):e156 · DOI
- Medina DL, Settembre C, Ballabio A (2017) Methods to monitor and manipulate TFEB activity during autophagy. Methods Enzymol 588:61–78 · DOI
- Schindelin J et al (2012) Fiji: an open-source platform for biological-image analysis. Nat Methods 9(7):676–682 · DOI · Paper page
- Ershov D, Phan MS, Pylvanainen JW, Rigaud SU, Le Blanc L, Charles-Orszag A, Conway JRW, Laine RF, Roy NH, Bonazzi D, Dumenil G, Jacquemet G, Tinevez JY (2022) TrackMate 7: integrating state-of-the-art segmentation algorithms into tracking pipelines. Nat Methods 19(7):829–832 · DOI
Cited by
Sorted by citations
GRAMD1B is a regulator of lipid homeostasis, autophagic flux and phosphorylated tau
Acosta Ingram, D., Turkes, E., Kim, T. Y., Vo, S., Sweeney, N., Bonte, M.-A., Rutherford, R., Julian, D. L., Pan, M., Marsh, J., et al. (2025) · Nature Communications · doi:10.1038/s41467-025-58585-w · Cited by 12
Metadata
- Authors
- Pollack, S. J., Dakkak, D., Guo, T., Chennell, G., Gomez-Suaga, P., Noble, W., Jimenez-Sanchez, M., & Hanger, D. P.
- Venue
- Cellular and Molecular Life Sciences
- Published
- 2024-07-15
- Volume
- 81
- Issue
- 1
- ISSN
- 1420-682X
- 1420-9071
- PMC
- PMC11335226
- Cited by
- 14
- References
- 12
- Language
- en
- Funders
- Alzheimer's Society (AS-PG-18b-012)
- Alzheimer Society (AS-PG-18b-012)
- Motor Neurone Disease Association (Gomez-Suaga/Oct17/967/799)
- Instituto de Salud Carlos III (IHMC22/00025)
- Centro de Investigación Biomédica en Red sobre Enfermedades Neurodegenerativas (CB06/05/0041)
- Medical Research Council (MR/V036947/1)
About these checks
Registry, retraction, Cites and statistics results are computed, not judged, with one exception: a printed reference that no index lists is read once by a model before it counts as a citation error. Claims are extracted by a model and kept only when their quote appears verbatim in the text; each cited source is then checked, with a model’s help, for whether it says what the claim relies on. Those verdicts can be wrong — read the claim’s quote and the cited source before relying on one.
Statistics and arithmetic are recomputed, not judged.
Confidence bands are shown only for fields calibrated on our annotated test set. None is calibrated yet, so no band is shown.
What counts as a claim ›How we measure confidence ›How we check this ›
Are you an author, or do you see a problem with this page? Request a review
