

The DOI matches its Crossref record; 50 of the 50 references it cites were found in a registry or an index.
Modeling key pathological features of frontotemporal dementia with C9ORF72 repeat expansion in iPSC-derived human neurons
Open accessAbstract
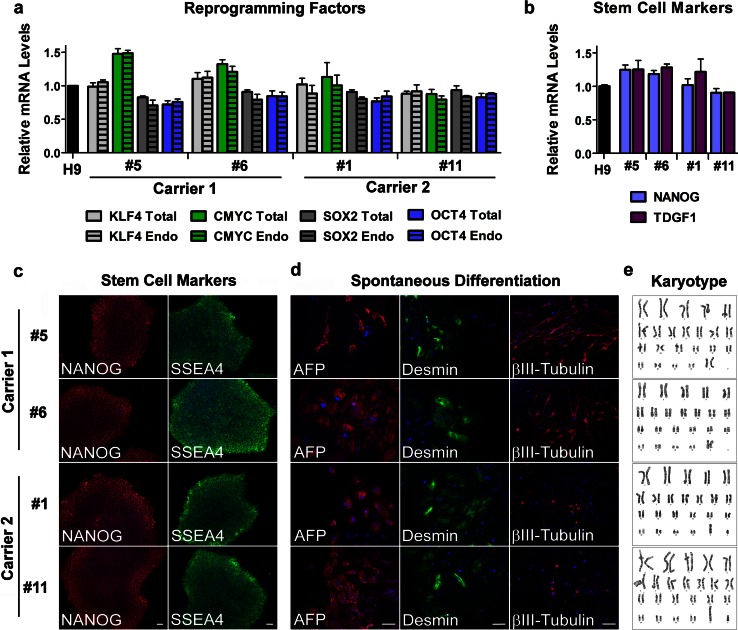
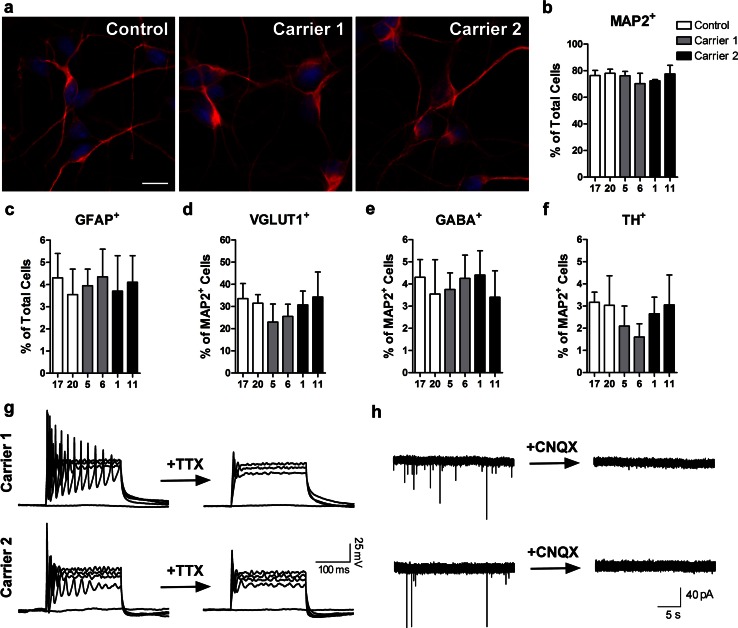
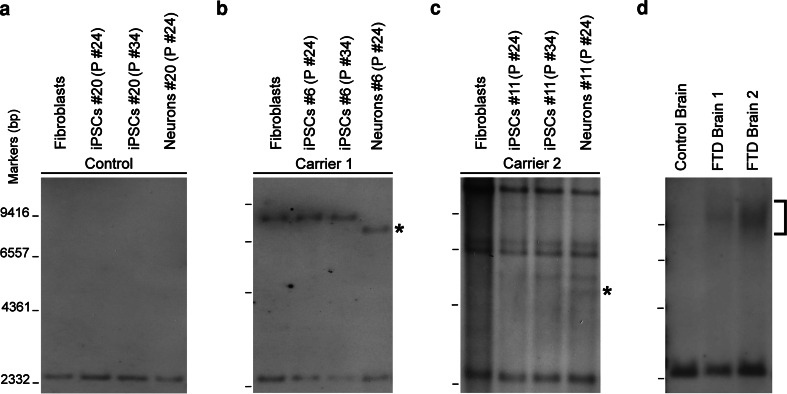
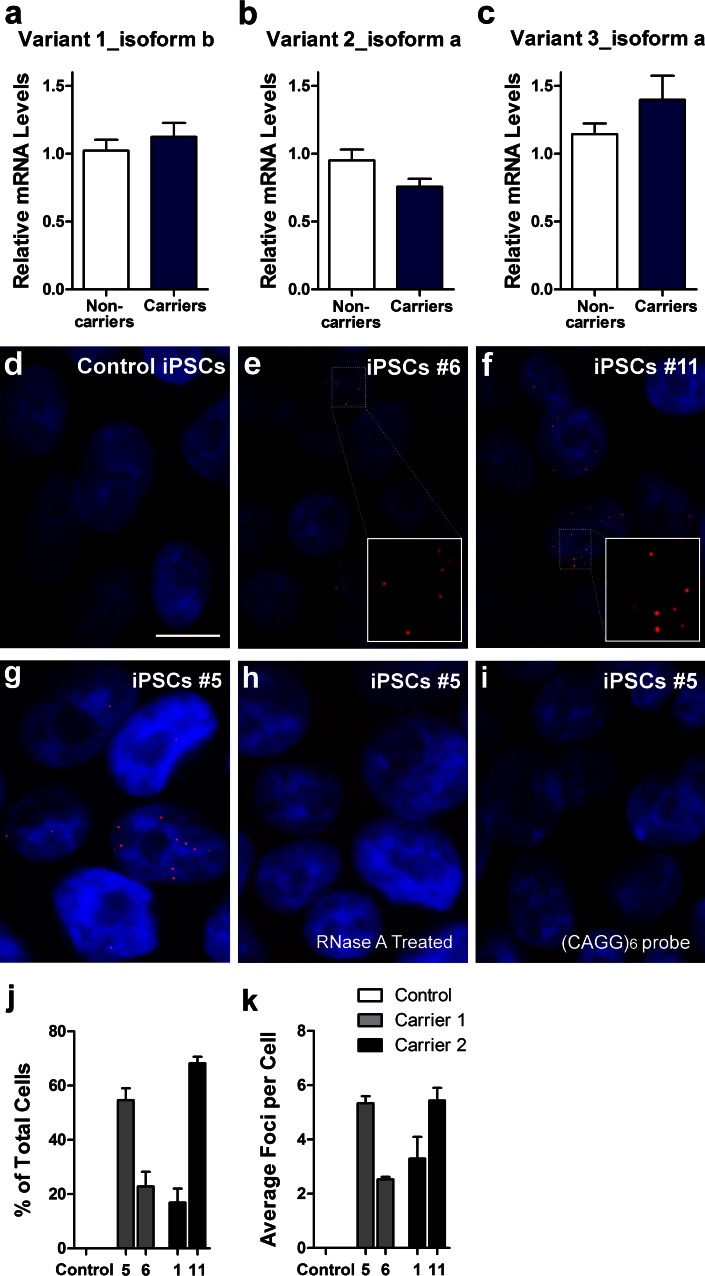
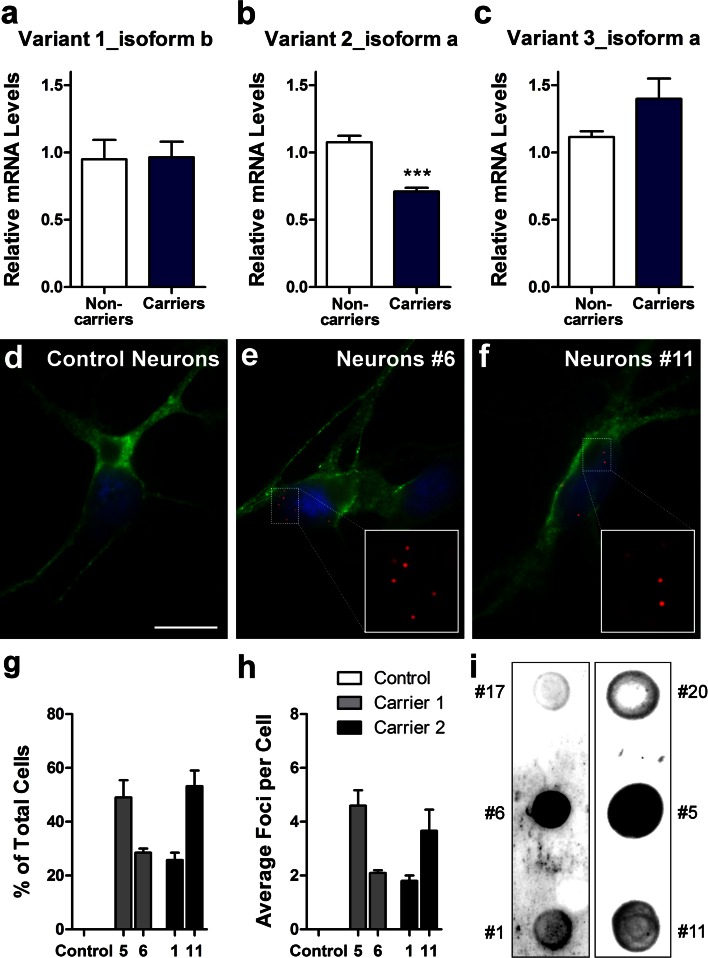
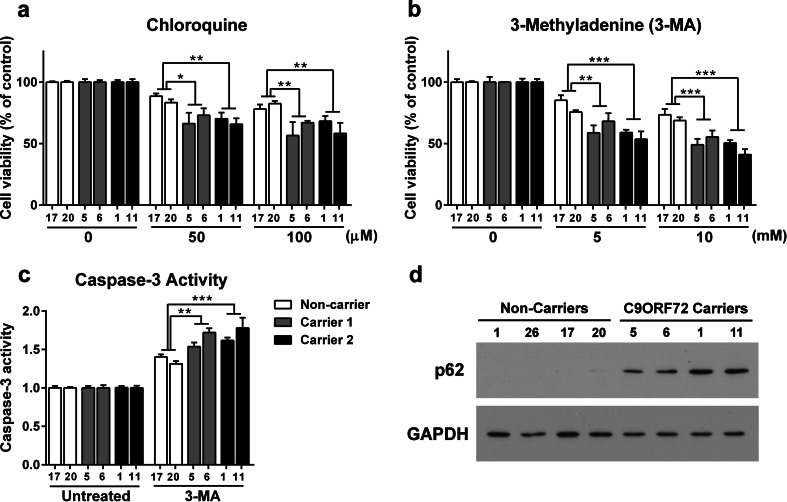
The recently identified GGGGCC repeat expansion in the noncoding region of C9ORF72 is the most common pathogenic mutation in patients with frontotemporal dementia (FTD) or amyotrophic lateral sclerosis (ALS). We generated a human neuronal model and investigated the pathological phenotypes of human neurons containing GGGGCC repeat expansions. Skin biopsies were obtained from two subjects who had >1,000 GGGGCC repeats in C9ORF72 and their respective fibroblasts were used to generate multiple induced pluripotent stem cell (iPSC) lines. After extensive characterization, two iPSC lines from each subject were selected, differentiated into postmitotic neurons, and compared with control neurons to identify disease-relevant phenotypes. Expanded GGGGCC repeats exhibit instability during reprogramming and neuronal differentiation of iPSCs. RNA foci containing GGGGCC repeats were present in some iPSCs, iPSC-derived human neurons and primary fibroblasts. The percentage of cells with foci and the number of foci per cell appeared to be determined not simply by repeat length but also by other factors. These RNA foci do not seem to sequester several major RNA-binding proteins. Moreover, repeat-associated non-ATG (RAN) translation products were detected in human neurons with GGGGCC repeat expansions and these neurons showed significantly elevated p62 levels and increased sensitivity to cellular stress induced by autophagy inhibitors. Our findings demonstrate that key neuropathological features of FTD/ALS with GGGGCC repeat expansions can be recapitulated in iPSC-derived human neurons and also suggest that compromised autophagy function may represent a novel underlying pathogenic mechanism.
Overview
The claims and statistics of this paper haven’t been checked yet.
Run the check — free, no account needed. It reads the open-access text and checks the sources it cites.
Integrity signals
Registry
Cites
Statistics
Figures
Verification
Claims the paper makes
The claims and statistics of this paper haven’t been checked yet.
Run the check — free, no account needed. It reads the open-access text and checks the sources it cites.
Claims other papers make about this one
Each is checked against this paper’s own text: does it say what the citing paper says it does?
In the citing paper
“C9orf72 mutations are associated with reduced basal autophagy and enhanced sensitivity to autophagy inhibitors in human iPSC-derived neurons [153,178].”
From Autophagy and ALS: mechanistic insights and therapeutic implications (2022) · cites this paper as [178]
Self-check
Percentages, sums and reported differences re-computed from the paper’s own numbers.
The self-check needs the paper’s full text.
Citations
Cites
Induction of Pluripotent Stem Cells from Adult Human Fibroblasts by Defined Factors
Takahashi, K., Tanabe, K., Ohnuki, M., Narita, M., Ichisaka, T., Tomoda, K., & Yamanaka, S. (2007) · Cell · doi:10.1016/j.cell.2007.11.019 · Cited by 20,221
Ubiquitinated TDP-43 in Frontotemporal Lobar Degeneration and Amyotrophic Lateral Sclerosis
Neumann, M., Sampathu, D. M., Kwong, L. K., Truax, A. C., Micsenyi, M. C., Chou, T. T., Bruce, J., Schuck, T., Grossman, M., Clark, C. M., et al. (2006) · Science · doi:10.1126/science.1134108 · Cited by 6,576
Self-citationDeJesus-Hernandez, M., Mackenzie, I. R., Boeve, B. F., Boxer, A. L., Baker, M., Rutherford, N. J., Nicholson, A. M., Finch, N. A., Flynn, H., Adamson, J., et al. (2011) · Neuron · doi:10.1016/j.neuron.2011.09.011 · Cited by 4,936 · cited 11×
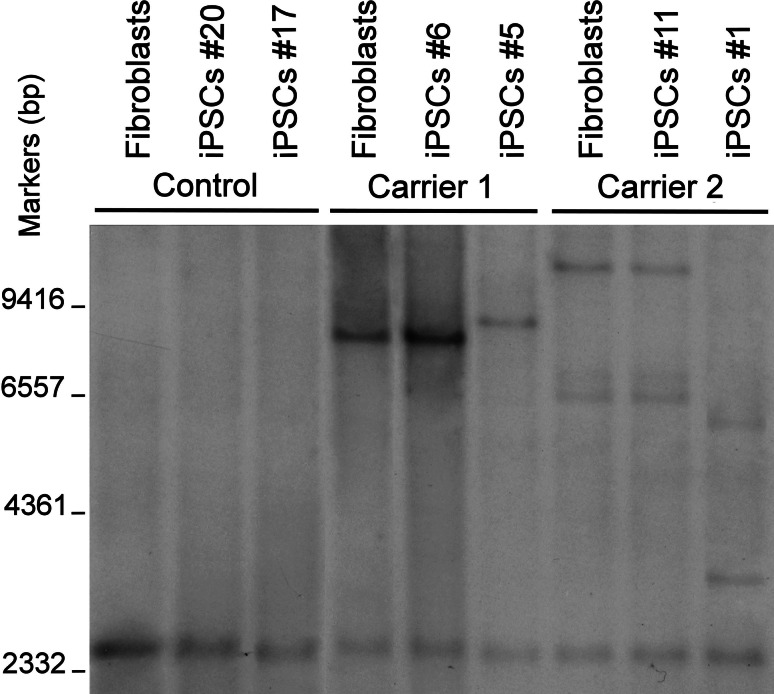
“After the publication of studies showing that GGGGCC repeat expansion is the disease-causing mutation in the VSM-20 family and other patients with FTD/ALS [12, 39], we first performed southern blot analysis to confirm the presence of the repeat expansion in skin fibroblasts from these two members of the VSM-20 family.”
BackgroundMethodResultInfluentialSelf-citationA Hexanucleotide Repeat Expansion in C9ORF72 Is the Cause of Chromosome 9p21-Linked ALS-FTD
Renton, A. E., Majounie, E., Waite, A., Simón-Sánchez, J., Rollinson, S., Gibbs, J. R., Schymick, J. C., Laaksovirta, H., van Swieten, J. C., Myllykangas, L., et al. (2011) · Neuron · doi:10.1016/j.neuron.2011.09.010 · Cited by 4,409
Arai, T., Hasegawa, M., Akiyama, H., Ikeda, K., Nonaka, T., Mori, H., Mann, D., Tsuchiya, K., Yoshida, M., Hashizume, Y., et al. (2006) · Biochemical and Biophysical Research Communications · doi:10.1016/j.bbrc.2006.10.093 · Cited by 2,732
Mutations in FUS, an RNA Processing Protein, Cause Familial Amyotrophic Lateral Sclerosis Type 6
Vance, C. A., Rogelj, B., Hortobágyi, T., Vos, K. J. D., Nishimura, A. L., Sreedharan, J., Hu, X., Smith, B. N., Ruddy, D., Wright, P. D., et al. (2009) · Science · doi:10.1126/science.1165942 · Cited by 2,625
Mutations in the FUS/TLS Gene on Chromosome 16 Cause Familial Amyotrophic Lateral Sclerosis
Kwiatkowski, T. J., Bosco, D. A., LeClerc, A. L., Tamrazian, E., Vanderburg, C. R., Russ, C., Davis, A., Gilchrist, J. M., Kasarskis, E. J., Munsat, T. L., et al. (2009) · Science · doi:10.1126/science.1166066 · Cited by 2,624
Dimos, J. T., Rodolfa, K. T., Niakan, K. K., Weisenthal, L. M., Mitsumoto, H., Chung, W. K., Croft, G. F., Saphier, G., Leibel, R. L., Goland, R., et al. (2008) · Science · doi:10.1126/science.1158799 · Cited by 2,019
Soldner, F., Hockemeyer, D. F., Beard, C., Gao, Q., Bell, G. W., Cook, E. G., Hargus, G., Blak, A. A., Cooper, O., Mitalipova, M. M., et al. (2009) · Cell · doi:10.1016/j.cell.2009.02.013 · Cited by 1,584
Induced pluripotent stem cells from a spinal muscular atrophy patient
Ebert, A. D., Yu, J., Rose, F. F., Mattis, V. B., Lorson, C. L., Thomson, J. A., & Svendsen, C. N. (2009) · Nature · doi:10.1038/nature07677 · Cited by 1,441
Cited by
Sorted by citations
C9orf72 nucleotide repeat structures initiate molecular cascades of disease
Haeusler, A. R., Donnelly, C. J., Periz, G., Simko, E. A. J., Shaw, P. G., Kim, M.-S., Maragakis, N. J., Troncoso, J. C., Pandey, A., Sattler, R., et al. (2014) · Nature · doi:10.1038/nature13124 · Cited by 978
RNA Toxicity from the ALS/FTD C9ORF72 Expansion Is Mitigated by Antisense Intervention
Donnelly, C. J., Zhang, P.-W., Pham, J. T., Haeusler, A. R., Mistry, N. A., Vidensky, S., Daley, E. L., Poth, E. M., Hoover, B., Fines, D. M., et al. (2013) · Neuron · doi:10.1016/j.neuron.2013.10.015 · Cited by 877
Self-citationGGGGCC repeat expansion in C9orf72 compromises nucleocytoplasmic transport
Freibaum, B. D., Lu, Y., Lopez-Gonzalez, R., Kim, N. C., Almeida, S., Lee, K.-H., Badders, N., Valentine, M., Miller, B. L., Wong, P. C., et al. (2015) · Nature · doi:10.1038/nature14974 · Cited by 841
Self-citationRAN proteins and RNA foci from antisense transcripts in C9ORF72 ALS and frontotemporal dementia
Zu, T., Liu, Y., Báñez-Coronel, M., Reid, T. S., Pletniková, O., Lewis, J. M., Miller, T. M., Harms, M. B., Falchook, A. E., Subramony, S. H., et al. (2013) · Proceedings of the National Academy of Sciences · doi:10.1073/pnas.1315438110 · Cited by 777
ALS Genetics, Mechanisms, and Therapeutics: Where Are We Now?
Mejzini, R., Flynn, L. L., Pitout, I. L., Fletcher, S., Wilton, S. D., & Akkari, P. A. (2019) · Frontiers in Neuroscience · doi:10.3389/fnins.2019.01310 · Cited by 803
C9orf72 repeat expansions cause neurodegeneration in Drosophila through arginine-rich proteins
Mizielinska, S., Grönke, S., Niccoli, T., Ridler, C. E., Clayton, E. L., Devoy, A., Moens, T., Norona, F. E., Woollacott, I. O. C., Pietrzyk, J., et al. (2014) · Science · doi:10.1126/science.1256800 · Cited by 740
C9orf72-mediated ALS and FTD: multiple pathways to disease
Balendra, R., & Isaacs, A. M. (2018) · Nature Reviews Neurology · doi:10.1038/s41582-018-0047-2 · Cited by 715
Targeting RNA Foci in iPSC-Derived Motor Neurons from ALS Patients with a C9ORF72 Repeat Expansion
Sareen, D., O’Rourke, J. G., Meera, P., Muhammad, A. K. M. G., Grant, S., Simpkinson, M., Bell, S., Carmona, S., Ornelas, L., Sahabian, A., et al. (2013) · Science Translational Medicine · doi:10.1126/scitranslmed.3007529 · Cited by 670
Self-citationGendron, T. F., Bieniek, K. F., Zhang, Y., Jansen‐West, K. R., Ash, P. E. A., Caulfield, T. R., Daughrity, L. M., Dunmore, J., Castanedes‐Casey, M., Chew, J., et al. (2013) · Acta Neuropathologica · doi:10.1007/s00401-013-1192-8 · Cited by 569
Self-citationLagier‐Tourenne, C., Baughn, M. W., Rigo, F., Sun, S., Liu, P., Li, H., Jiang, J., Watt, A. T., Chun, S. J., Katz, M., et al. (2013) · Proceedings of the National Academy of Sciences · doi:10.1073/pnas.1318835110 · Cited by 585
Lopez-Gonzalez, R., Lu, Y., Gendron, T. F., Karydas, A., Tran, H., Yang, D., Petrucelli, L., Miller, B. L., Almeida, S., & Gao, F. (2016) · Neuron · doi:10.1016/j.neuron.2016.09.015 · Cited by 429
Self-citationSellier, C., Campanari, M., Julie Corbier, C., Gaucherot, A., Kolb‐Cheynel, I., Oulad‐Abdelghani, M., Ruffenach, F., Page, A., Ciura, S., Kabashi, E., et al. (2016) · The EMBO Journal · doi:10.15252/embj.201593350 · Cited by 414
Self-citationC9ORF72 repeat expansions in mice cause TDP-43 pathology, neuronal loss, and behavioral deficits
Chew, J., Gendron, T. F., Prudencio, M., Sasaguri, H., Zhang, Y., Castanedes‐Casey, M., Lee, C. W., Jansen‐West, K. R., Kurti, A., Murray, M. E., et al. (2015) · Science · doi:10.1126/science.aaa9344 · Cited by 426
Self-citationThe frontotemporal dementia-motor neuron disease continuum
Burrell, J. R., Halliday, G. M., Kril, J. J., Ittner, L. M., Götz, J., Kiernan, M. C., & Hodges, J. R. (2016) · The Lancet · doi:10.1016/s0140-6736(16)00737-6 · Cited by 384
Su, Z., Zhang, Y., Gendron, T. F., Bauer, P. O., Chew, J., Yang, W.-Y., Fostvedt, E., Jansen‐West, K. R., Belzil, V., Desaro, P., et al. (2014) · Neuron · doi:10.1016/j.neuron.2014.07.041 · Cited by 365
Self-citationMizielinska, S., Lashley, T., Norona, F. E., Clayton, E. L., Ridler, C. E., Fratta, P., & Isaacs, A. M. (2013) · Acta Neuropathologica · doi:10.1007/s00401-013-1200-z · Cited by 317
Emerging mechanisms of molecular pathology in ALS
Peters, O. M., Ghasemi, M., & Brown, R. H. (2015) · Journal of Clinical Investigation · doi:10.1172/jci71601 · Cited by 328
May, S., Hornburg, D., Schludi, M. H., Arzberger, T., Rentzsch, K., Schwenk, B. M., Grässer, F. A., Mori, K., Kremmer, E., Banzhaf‐Strathmann, J., et al. (2014) · Acta Neuropathologica · doi:10.1007/s00401-014-1329-4 · Cited by 317
C9orf72 BAC Transgenic Mice Display Typical Pathologic Features of ALS/FTD
O’Rourke, J. G., Bogdanik, L., Muhammad, A. K. M. G., Gendron, T. F., Kim, K. J., Austin, A., Cady, J., Liu, E. Y., Zarrow, J., Grant, S., et al. (2015) · Neuron · doi:10.1016/j.neuron.2015.10.027 · Cited by 298
Self-citationDevlin, A., Burr, K., Borooah, S., Foster, J. D., Cleary, E. M., Geti, I., Vallier, L., Shaw, C. E., Chandran, S., & Miles, G. B. (2015) · Nature Communications · doi:10.1038/ncomms6999 · Cited by 308
Waite, A. J., Bäumer, D., East, S. Z., Neal, J., Morris, H. R., Ansorge, O., & Blake, D. J. (2014) · Neurobiology of Aging · doi:10.1016/j.neurobiolaging.2014.01.016 · Cited by 298
Peters, O. M., Cabrera, G. T., Tran, H., Gendron, T. F., McKeon, J. E., Metterville, J., Weiss, A., Wightman, N., Salameh, J. S., Kim, J., et al. (2015) · Neuron · doi:10.1016/j.neuron.2015.11.018 · Cited by 278
Self-citationRaman, R., Allen, S. P., Goodall, G., Kramer, S., Ponger, L., Heath, P. R., Milo, M., Hollinger, H. C., Walsh, T., Highley, J. R., et al. (2014) · Neuropathology and Applied Neurobiology · doi:10.1111/nan.12147 · Cited by 254
Investigating human disease using stem cell models
Sterneckert, J. L., Reinhardt, P., & Schöler, H. R. (2014) · Nature Reviews Genetics · doi:10.1038/nrg3764 · Cited by 262
Autophagy, aging, and age-related neurodegeneration
Palmer, J. E., Wilson, N., Son, S. M., Obrocki, P., Wróbel, L., Rob, M., Takla, M., Korolchuk, V. I., & Rubinsztein, D. C. (2024) · Neuron · doi:10.1016/j.neuron.2024.09.015 · Cited by 277
on behalf of the BELNEU CONSORTIUM, Gijselinck, I., Van Mossevelde, S., van der Zee, J., Sieben, A., Engelborghs, S., De Bleecker, J., Ivanoiu, A., Deryck, O., Edbauer, D., et al. (2016) · Molecular Psychiatry · doi:10.1038/mp.2015.159 · Cited by 242
Tao, Z., Wang, H., Qin, X., Li, K., Li, K., Jiang, X., Xu, G., Wang, G., & Ying, Z. (2015) · Human Molecular Genetics · doi:10.1093/hmg/ddv005 · Cited by 247
C9orf72 expansions in frontotemporal dementia and amyotrophic lateral sclerosis
Rohrer, J. D., Isaacs, A. M., Mizielinska, S., Mead, S., Lashley, T., Wray, S., Sidle, K. C. L., Fratta, P., Orrell, R. W., Hardy, J., et al. (2015) · The Lancet Neurology · doi:10.1016/s1474-4422(14)70233-9 · Cited by 252
Dafinca, R., Scaber, J., Ababneh, N. A., Lalic, T., Weir, G. A., Christian, H., Vowles, J., Douglas, A. G. L., Fletcher-Jones, A., Browne, C., et al. (2016) · Stem Cells · doi:10.1002/stem.2388 · Cited by 243
G‐quadruplexes: Emerging roles in neurodegenerative diseases and the non‐coding transcriptome
Simone, R., Fratta, P., Neidle, S., Parkinson, G. N., & Isaacs, A. M. (2015) · FEBS Letters · doi:10.1016/j.febslet.2015.05.003 · Cited by 217
Gao, F., Almeida, S., & Lopez‐Gonzalez, R. (2017) · The EMBO Journal · doi:10.15252/embj.201797568 · Cited by 229
Self-citationThe neuropathology associated with repeat expansions in the C9ORF72 gene
Mackenzie, I. R. A., Frick, P., & Neumann, M. (2014) · Acta Neuropathologica · doi:10.1007/s00401-013-1232-4 · Cited by 206
The expanding biology of the C9orf72 nucleotide repeat expansion in neurodegenerative disease
Haeusler, A. R., Donnelly, C. J., & Rothstein, J. D. (2016) · Nature reviews. Neuroscience · doi:10.1038/nrn.2016.38 · Cited by 205
Selvaraj, B. T., Livesey, M. R., Zhao, C., Gregory, J. M., James, O. T., Cleary, E. M., Chouhan, A. K., Gane, A. B., Perkins, E., Dando, O., et al. (2018) · Nature Communications · doi:10.1038/s41467-017-02729-0 · Cited by 214
Tran, H., Almeida, S., Moore, J. E., Gendron, T. F., Chalasani, U., Lu, Y., Du, X., Nickerson, J. A., Petrucelli, L., Weng, Z., et al. (2015) · Neuron · doi:10.1016/j.neuron.2015.09.015 · Cited by 204
Self-citationAutophagy and ALS: mechanistic insights and therapeutic implications
Chua, J. P., De Calbiac, H., Kabashi, E., & Barmada, S. J. (2022) · Autophagy · doi:10.1080/15548627.2021.1926656 · Cited by 189
Gascon, E., Lynch, K., Ruan, H., Almeida, S., Verheyden, J. M., Seeley, W. W., Dickson, D. W., Petrucelli, L., Sun, D., Jiao, J., et al. (2014) · Nature Medicine · doi:10.1038/nm.3717 · Cited by 183
Self-citationC9orf72 hypermethylation protects against repeat expansion-associated pathology in ALS/FTD
Liu, E. Y., Russ, J., Wu, K., Neal, D., Suh, E., McNally, A. G., Irwin, D. J., Van Deerlin, V. M., & Lee, E. B. (2014) · Acta Neuropathologica · doi:10.1007/s00401-014-1286-y · Cited by 180
Suppression of mutant C9orf72 expression by a potent mixed backbone antisense oligonucleotide
Tran, H., Moazami, M. P., Yang, H., McKenna-Yasek, D., Douthwright, C. L., Pinto, C., Metterville, J., Shin, M., Sanil, N., Dooley, C., et al. (2022) · Nature Medicine · doi:10.1038/s41591-021-01557-6 · Cited by 174
Self-citationRNA toxicity in non‐coding repeat expansion disorders
Swinnen, B., Robberecht, W., & Bosch, L. V. D. (2019) · The EMBO Journal · doi:10.15252/embj.2018101112 · Cited by 161
Aoki, Y., Manzano, R., Lee, Y., Dafinca, R., Aoki, M., Douglas, A. G. L., Varela, M. A., Sathyaprakash, C., Scaber, J., Barbagallo, P., et al. (2017) · Brain · doi:10.1093/brain/awx024 · Cited by 167
There has been an awakening: Emerging mechanisms of C9orf72 mutations in FTD/ALS
Gitler, A. D., & Tsuiji, H. (2016) · Brain Research · doi:10.1016/j.brainres.2016.04.004 · Cited by 155
Autophagy Dysregulation in ALS: When Protein Aggregates Get Out of Hand
Ramesh, N., & Pandey, U. B. (2017) · Frontiers in Molecular Neuroscience · doi:10.3389/fnmol.2017.00263 · Cited by 161
Mechanisms of toxicity in C9FTLD/ALS
Gendron, T. F., Belzil, V., Zhang, Y., & Petrucelli, L. (2014) · Acta Neuropathologica · doi:10.1007/s00401-013-1237-z · Cited by 154
Self-citationRepeat-associated non-ATG (RAN) translation in neurological disease
Cleary, J. D., & Ranum, L. P. W. (2013) · Human Molecular Genetics · doi:10.1093/hmg/ddt371 · Cited by 149
Wallings, R. L., Humble, S. W., Ward, M. E., & Wade-Martins, R. (2019) · Trends in Neurosciences · doi:10.1016/j.tins.2019.10.002 · Cited by 153
Downregulation of MicroRNA-9 in iPSC-Derived Neurons of FTD/ALS Patients with TDP-43 Mutations
Zhang, Z., Almeida, S., Lu, Y., Nishimura, A. L., Peng, L., Sun, D., Wu, B., Karydas, A. M., Tartaglia, M. C., Fong, J. C., et al. (2013) · PLoS ONE · doi:10.1371/journal.pone.0076055 · Cited by 142
Self-citationXiao, S., MacNair, L., McGoldrick, P., McKeever, P. M., McLean, J. R., Zhang, M., Keith, J. L., Zinman, L. H., Rogaeva, E. A., & Robertson, J. (2015) · Annals of Neurology · doi:10.1002/ana.24469 · Cited by 154
Boivin, M., Pfister, V., Gaucherot, A., Ruffenach, F., Negroni, L., Sellier, C., & Charlet‐Berguerand, N. (2020) · The EMBO Journal · doi:10.15252/embj.2018100574 · Cited by 137
Self-citationYang, D., Abdallah, A., Li, Z., Lu, Y., Almeida, S., & Gao, F. (2015) · Acta Neuropathologica · doi:10.1007/s00401-015-1448-6 · Cited by 137
Self-citationA zebrafish model for C9orf72 ALS reveals RNA toxicity as a pathogenic mechanism
Swinnen, B., Bento‐Abreu, A., Gendron, T. F., Boeynaems, S., Bogaert, E., Nuyts, R., Timmers, M., Scheveneels, W., Hersmus, N., Wang, J., et al. (2018) · Acta Neuropathologica · doi:10.1007/s00401-017-1796-5 · Cited by 137
Self-citationAnimal models of Alzheimer disease: historical pitfalls and a path forward
Cavanaugh, S. E. (2014) · ALTEX · doi:10.14573/altex.1310071 · Cited by 132
Lattante, S., Ciura, S., Rouleau, G. A., & Kabashi, E. (2015) · Trends in Genetics · doi:10.1016/j.tig.2015.03.005 · Cited by 137
The role of amyloid oligomers in neurodegenerative pathologies
Wells, C., Brennan, S. E., Keon, M., & Ooi, L. (2021) · International Journal of Biological Macromolecules · doi:10.1016/j.ijbiomac.2021.03.113 · Cited by 128
Sabapathy, V., & Kumar, S. (2016) · Journal of Cellular and Molecular Medicine · doi:10.1111/jcmm.12839 · Cited by 129
Beckers, J., Tharkeshwar, A. K., & Damme, P. V. (2021) · Autophagy · doi:10.1080/15548627.2021.1872189 · Cited by 132
van Blitterswijk, M., Gendron, T. F., Baker, M., DeJesus‐Hernandez, M., Finch, N. A., Brown, P. H., Daughrity, L. M., Murray, M. E., Heckman, M. G., Jiang, J., et al. (2015) · Acta Neuropathologica · doi:10.1007/s00401-015-1480-6 · Cited by 127
Self-citationSpt4 selectively regulates the expression of C9orf72 sense and antisense mutant transcripts
Kramer, N. J., Carlomagno, Y., Zhang, Y., Almeida, S., Cook, C. N., Gendron, T. F., Prudencio, M., van Blitterswijk, M., Belzil, V., Couthouis, J., et al. (2016) · Science · doi:10.1126/science.aaf7791 · Cited by 123
Self-citationLogan, S., Arzua, T., Canfield, S. G., Seminary, E. R., Sison, S. L., Ebert, A. D., & Bai, X. (2019) · Comprehensive physiology · doi:10.1002/cphy.c180025 · Cited by 143
Wang, Z.-F., Ursu, A., Childs‐Disney, J. L., Guertler, R., Yang, W.-Y., Bernat, V., Rzuczek, S. G., Fuerst, R., Zhang, Y., Gendron, T. F., et al. (2018) · Cell chemical biology · doi:10.1016/j.chembiol.2018.10.018 · Cited by 109
Self-citationSalvia miltiorrhiza: A source for anti-Alzheimer’s disease drugs
Zhang, X., Qian, S., Zhang, Y.-J., & Wang, R. L. (2015) · Pharmaceutical Biology · doi:10.3109/13880209.2015.1027408 · Cited by 114
Repeat associated non-ATG (RAN) translation: new starts in microsatellite expansion disorders
Cleary, J. D., & Ranum, L. P. W. (2014) · Current Opinion in Genetics & Development · doi:10.1016/j.gde.2014.03.002 · Cited by 113
Autophagy as a common pathway in amyotrophic lateral sclerosis
Nguyen, D. K. H., Thombre, R., & Wang, J. (2018) · Neuroscience Letters · doi:10.1016/j.neulet.2018.04.006 · Cited by 118
Human-induced pluripotent stem cells: potential for neurodegenerative diseases
Ross, C. A., & Akimov, S. (2014) · Human Molecular Genetics · doi:10.1093/hmg/ddu204 · Cited by 111
Stress granules at the intersection of autophagy and ALS
Monahan, Z. T., Shewmaker, F. P., & Pandey, U. B. (2016) · Brain Research · doi:10.1016/j.brainres.2016.05.022 · Cited by 110
Gendron, T. F., van Blitterswijk, M., Bieniek, K. F., Daughrity, L. M., Jiang, J., Rush, B. K., Pedraza, O., Lucas, J. A., Murray, M. E., Desaro, P., et al. (2015) · Acta Neuropathologica · doi:10.1007/s00401-015-1474-4 · Cited by 106
Self-citationO’Brien, L. C., Keeney, P. M., & Bennett, J. P. (2015) · Stem Cells and Development · doi:10.1089/scd.2015.0076 · Cited by 109
Genomic mosaicism in the developing and adult brain
Rohrback, S., Siddoway, B. A., Liu, C. S., & Chun, J. J. M. (2018) · Developmental Neurobiology · doi:10.1002/dneu.22626 · Cited by 106
Disease Mechanisms ofC9ORF72Repeat ExpansionsPreprint
Gendron, T. F., & Petrucelli, L. (2017) · Cold Spring Harbor Perspectives in Medicine · doi:10.1101/cshperspect.a024224 · Cited by 106
Self-citationYin, S., Lopez-Gonzalez, R., Kunz, R. C., Gangopadhyay, J. P., Borufka, C., Gygi, S. P., Gao, F., & Reed, R. (2017) · Cell Reports · doi:10.1016/j.celrep.2017.05.056 · Cited by 100
Self-citationGiacomelli, E., Vahsen, B. F., Calder, E. L., Xu, Y., Scaber, J., Gray, E., Dafinca, R., Talbot, K., & Studer, L. (2022) · Cell stem cell · doi:10.1016/j.stem.2021.12.008 · Cited by 100
Maharjan, N., Künzli, C., Buthey, K., & Saxena, S. (2016) · Molecular Neurobiology · doi:10.1007/s12035-016-9850-1 · Cited by 99
Repeat-associated non-ATG (RAN) translation
Cleary, J. D., Pattamatta, A., & Ranum, L. P. W. (2018) · Journal of Biological Chemistry · doi:10.1074/jbc.r118.003237 · Cited by 100
Ehrlich, M., Hallmann, A.-L., Reinhardt, P., Araúzo-Bravo, M. J., Korr, S., Röpke, A., Psathaki, O. E., Ehling, P., Meuth, S. G., Oblak, A. L., et al. (2015) · Stem Cell Reports · doi:10.1016/j.stemcr.2015.06.001 · Cited by 94
Burguete, A. S., Almeida, S., Gao, F., Kalb, R. G., Akins, M. R., & Bonini, N. M. (2015) · eLife · doi:10.7554/elife.08881 · Cited by 98
Self-citationFumagalli, L., Young, F. L., Boeynaems, S., Decker, M. D., Mehta, A. R., Swijsen, A., Fazal, R., Guo, W., Moisse, M., Beckers, J., et al. (2021) · Science Advances · doi:10.1126/sciadv.abg3013 · Cited by 94
Autophagy and Its Impact on Neurodegenerative Diseases: New Roles for TDP-43 and C9orf72
Budini, M., Buratti, E., Morselli, E., & Criollo, A. (2017) · Frontiers in Molecular Neuroscience · doi:10.3389/fnmol.2017.00170 · Cited by 101
Ichiyanagi, N., Fujimori, K., Yano, M., Ishihara-Fujisaki, C., Sone, T., Akiyama, T., Okada, Y., Akamatsu, W., Matsumoto, T., Ishikawa, M., et al. (2016) · Stem Cell Reports · doi:10.1016/j.stemcr.2016.02.011 · Cited by 98
DeJesus‐Hernandez, M., Finch, N. A., Wang, X., Gendron, T. F., Bieniek, K. F., Heckman, M. G., Vasilevich, A. S., Murray, M. E., Rousseau, L., Weesner, R. E., et al. (2017) · Acta Neuropathologica · doi:10.1007/s00401-017-1725-7 · Cited by 94
Self-citationRNP Granule Formation: Lessons from P-Bodies and Stress GranulesPreprint
Corbet, G. A., & Parker, R. (2019) · Cold Spring Harbor Symposia on Quantitative Biology · doi:10.1101/sqb.2019.84.040329 · Cited by 86
Lopez-Gonzalez, R., Yang, D., Pribadi, M., Kim, T. S., Krishnan, G., Choi, S. Y., Lee, S., Coppola, G., & Gao, F. (2019) · Proceedings of the National Academy of Sciences · doi:10.1073/pnas.1901313116 · Cited by 85
Self-citationActivation of HIPK2 Promotes ER Stress-Mediated Neurodegeneration in Amyotrophic Lateral Sclerosis
Lee, S., Shang, Y., Redmond, S., Urisman, A., Tang, A. A., Li, K. H., Burlingame, A. L., Pak, R. A., Jovičić, A., Gitler, A. D., et al. (2016) · Neuron · doi:10.1016/j.neuron.2016.05.021 · Cited by 93
Self-citationPsychiatric Presentations of C9orf72 Mutation: What Are the Diagnostic Implications for Clinicians?
Ducharme, S., Bajestan, S., Dickerson, B. C., & Voon, V. (2017) · The Journal of Neuropsychiatry and Clinical Neurosciences · doi:10.1176/appi.neuropsych.16090168 · Cited by 84
NEK1 loss-of-function mutation induces DNA damage accumulation in ALS patient-derived motoneurons
Higelin, J., Catanese, A., Semelink-Sedlacek, L. L., Oeztuerk, S., Lutz, A.-K., Bausinger, J., Barbi, G., Speit, G., Andersen, P. M., Ludolph, A. C., et al. (2018) · Stem Cell Research · doi:10.1016/j.scr.2018.06.005 · Cited by 86
New developments in RAN translation: insights from multiple diseases
Cleary, J. D., & Ranum, L. P. W. (2017) · Current Opinion in Genetics & Development · doi:10.1016/j.gde.2017.03.006 · Cited by 84
Human pluripotent stem cell–derived models and drug screening in CNS precision medicine
Silva, M. C., & Haggarty, S. J. (2019) · Annals of the New York Academy of Sciences · doi:10.1111/nyas.14012 · Cited by 88
Haston, K. M., & Finkbeiner, S. M. (2015) · The Annual Review of Pharmacology and Toxicology · doi:10.1146/annurev-pharmtox-010715-103548 · Cited by 84
Characterization of DNA hypermethylation in the cerebellum of c9FTD/ALS patients
Belzil, V., Bauer, P. O., Gendron, T. F., Murray, M. E., Dickson, D. W., & Petrucelli, L. (2014) · Brain Research · doi:10.1016/j.brainres.2014.02.015 · Cited by 82
Self-citationModeling cell-autonomous motor neuron phenotypes in ALS using iPSCs
Hawrot, J., Imhof, S., & Wainger, B. J. (2020) · Neurobiology of Disease · doi:10.1016/j.nbd.2019.104680 · Cited by 74
Giampetruzzi, A., Danielson, E., Gumina, V., Jeon, M., Boopathy, S., Brown, R. H., Ratti, A., Landers, J. E., & Fallini, C. (2019) · Nature Communications · doi:10.1038/s41467-019-11837-y · Cited by 80
Rizzu, P., Blauwendraat, C., Heetveld, S., Lynes, E. M., Castillo-Lizardo, M., Dhingra, A., Pyż, E., Hobert, M. A., Synofzik, M., Simón‐Sánchez, J., et al. (2016) · Acta Neuropathologica Communications · doi:10.1186/s40478-016-0306-7 · Cited by 88
Synaptic dysfunction and altered excitability in C9ORF72 ALS/FTD
Starr, A., & Sattler, R. (2018) · Brain Research · doi:10.1016/j.brainres.2018.02.011 · Cited by 78
Modeling ALS and FTD with iPSC-derived neurons
Lee, S., & Huang, E. J. (2015) · Brain Research · doi:10.1016/j.brainres.2015.10.003 · Cited by 79
TFEB/Mitf links impaired nuclear import to autophagolysosomal dysfunction in C9-ALS
Cunningham, K. M., Maulding, K., Ruan, K., Şentürk, M., Grima, J. C., Sung, H., Zuo, Z., Song, H., Gao, J., Dubey, S. K., et al. (2020) · eLife · doi:10.7554/elife.59419 · Cited by 80
Ababneh, N. A., Scaber, J., Flynn, R., Douglas, A. G. L., Barbagallo, P., Candalija, A., Turner, M. R., Sims, D., Dafinca, R., Cowley, S. A., et al. (2020) · Human Molecular Genetics · doi:10.1093/hmg/ddaa106 · Cited by 76
Ciesiołka, A., Jazurek, M., Drążkowska, K., & Krzyżosiak, W. J. (2017) · Frontiers in Cellular Neuroscience · doi:10.3389/fncel.2017.00097 · Cited by 74
Todd, T. W., & Petrucelli, L. (2016) · Journal of Neurochemistry · doi:10.1111/jnc.13623 · Cited by 73
Self-citationImpaired protein degradation in FTLD and related disorders
Götzl, J. K., Lang, C. M., Haass, C., & Capell, A. (2016) · Ageing Research Reviews · doi:10.1016/j.arr.2016.04.008 · Cited by 74
Perry, S., Han, Y., Das, A., & Dickman, D. K. (2017) · Human Molecular Genetics · doi:10.1093/hmg/ddx304 · Cited by 78
NUP62 localizes to ALS/FTLD pathological assemblies and contributes to TDP-43 insolubility
Gleixner, A. M., Verdone, B. M., Otte, C. G., Anderson, E. N., Ramesh, N., Shapiro, O. R., Gale, J. R., Mauna, J. C., Mann, J. R., Copley, K. E., et al. (2022) · Nature Communications · doi:10.1038/s41467-022-31098-6 · Cited by 71
Metadata
- Authors
- Almeida, S., Gascon, E., Tran, H., Chou, H. J., Gendron, T. F., DeGroot, S., Tapper, A. R., Sellier, C., Charlet-Berguerand, N., Karydas, A., Seeley, W. W., Boxer, A. L., Petrucelli, L., Miller, B. L., & Gao, F.-B.
- Affiliations
- University of Massachusetts Chan Medical School (US)
- Mayo Clinic in Florida (US)
- Centre National de la Recherche Scientifique (FR)
- University of California, San Francisco (US)
- Corresponding author
- Gao, Fen-Biao
- ORCID
- Venue
- Acta Neuropathologica
- Published
- 2013-07-09
- Volume
- 126
- Issue
- 3
- Pages
- 385-399
- ISSN
- 0001-6322 (ISSN-L)
- 1432-0533
- PMC
- PMC3753484
- OpenAlex
- W2113670539
- Cited by
- 321
- References
- 50
- Citations by year
- 2026: 6 · 2025: 9 · 2024: 10 · 2023: 15 · 2022: 6 · 2021: 21 · 2020: 28 · 2019: 30 · 2018: 23 · 2017: 34 · 2016: 40 · 2015: 49 · 2014: 36 · 2013: 12
- FWCI
- 29.00
- Type
- journal article
- Language
- en
- Update notices
- correction (2014-04-09)
- Open access
- hybrid
- doi.org
- Locations
- Acta Neuropathologica (publishedVersion, cc-by)
- Europe PMC (PubMed Central) (publishedVersion, cc-by)
- PubMed Central (publishedVersion, cc-by)
- PubMed (publishedVersion)
- The Journal of the American Medical Association (JAMA) Network (American Medical Association) (submittedVersion, cc-by)
- HAL (submittedVersion, cc-by)
- eScholarship (California Digital Library) (submittedVersion)
- Funders
- Mayo Clinic
- California Institute for Regenerative Medicine (RL1-00650)
- ALS Therapy Alliance
- National Institutes of Health (AG023501, AG019724, NS063964, AG17216, NS057553)
- National Institute on Aging (R56AG026251, AG 17216, AG023501, AG019724, P01AG017216, R01AG026251, R01AG038791, AG026251, P01AG019724, P50AG023501)
- National Institute of Neurological Disorders and Stroke (R01NS063964, R01NS077402, NS057553, R01NS057553, R37NS057553, NS077402, NS063964)
- Topics
- Health Sciences › Medicine › Clinical Neurology › Amyotrophic Lateral Sclerosis Research
- Life Sciences › Neuroscience › Cellular and Molecular Neuroscience › Genetic Neurodegenerative Diseases
- Life Sciences › Neuroscience › Cellular and Molecular Neuroscience › Alzheimer's disease research and treatments
- Keywords
- frontotemporal dementia, amyotrophic lateral sclerosis, C9orf72, GGGGCC repeat expansion, induced pluripotent stem cells, iPSC-derived neurons, RNA foci, repeat-associated non-ATG translation, p62, autophagy, fibroblast reprogramming, RNA-binding proteins, disease modeling
- MeSH terms
- C9orf72 Protein, Amyotrophic Lateral Sclerosis, Animals, Cell Differentiation, Genotype, Humans, Mutation, Neurons, Proteins, RNA-Binding Proteins, DNA Repeat Expansion, Mice, Induced Pluripotent Stem Cells, Frontotemporal Dementia
About these checks
Registry, retraction, Cites and statistics results are computed, not judged, with one exception: a printed reference that no index lists is read once by a model before it counts as a citation error. Claims are extracted by a model and kept only when their quote appears verbatim in the text; each cited source is then checked, with a model’s help, for whether it says what the claim relies on. Those verdicts can be wrong — read the claim’s quote and the cited source before relying on one.
Statistics and arithmetic are recomputed, not judged.
Confidence bands are shown only for fields calibrated on our annotated test set. None is calibrated yet, so no band is shown.
What counts as a claim ›How we measure confidence ›How we check this ›
Are you an author, or do you see a problem with this page? Request a review
