

The DOI matches its Crossref record; 22 of the 22 references it cites were found in a registry or an index.
Parkinson’s Disease–Associated LRRK2 Interferes with Astrocyte-Mediated Alpha-Synuclein Clearance
Published version of a preprint
Abstract
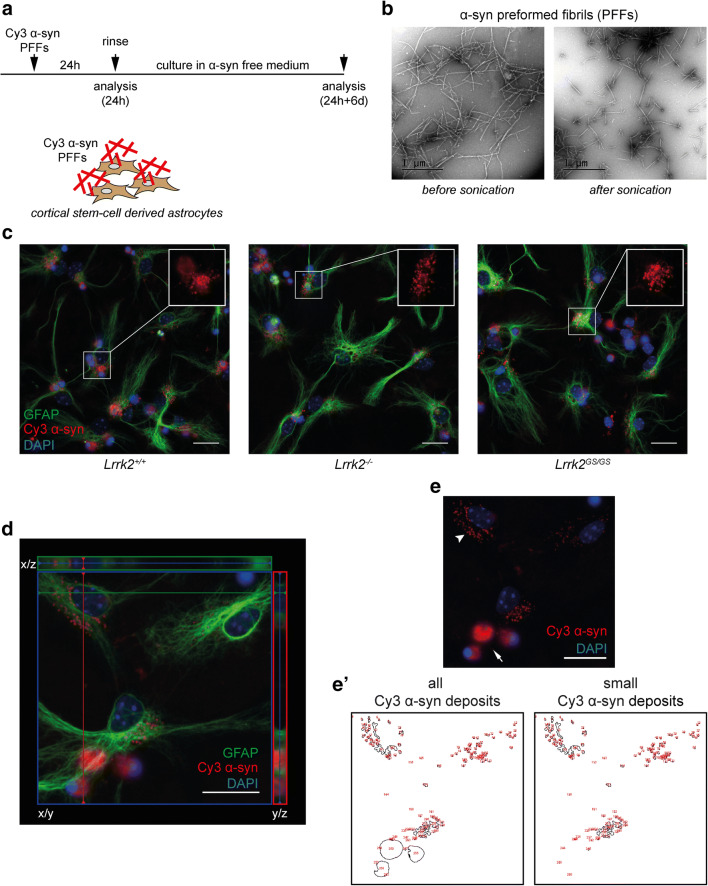
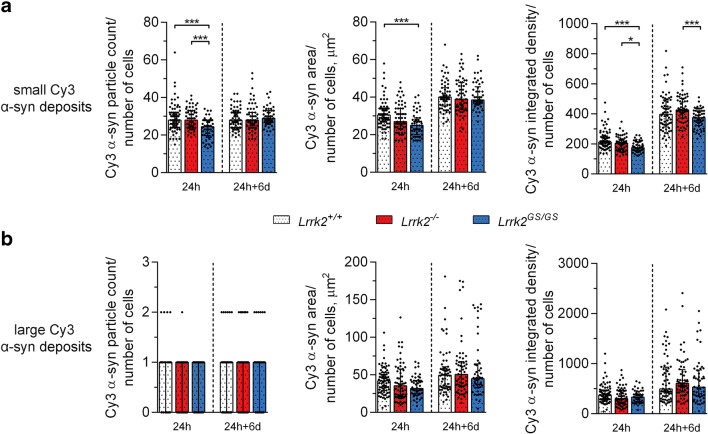
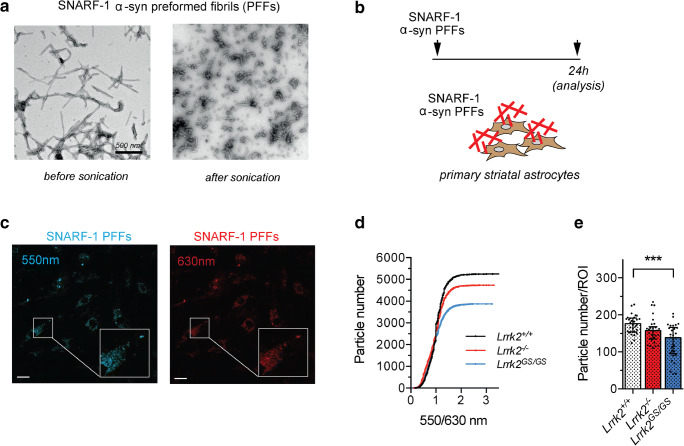
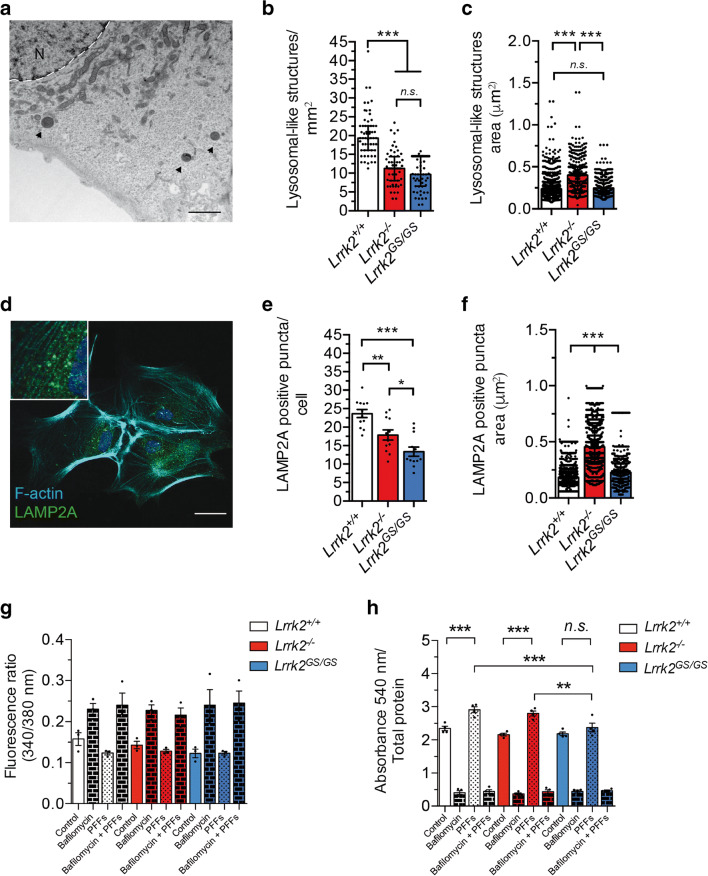
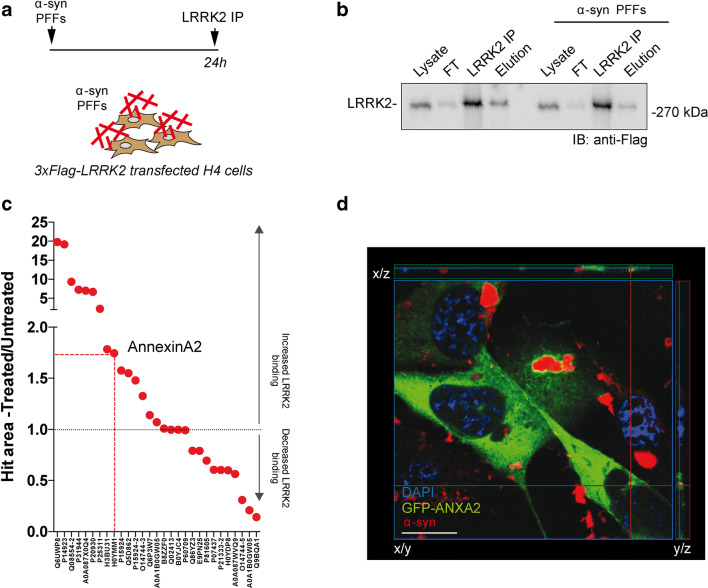
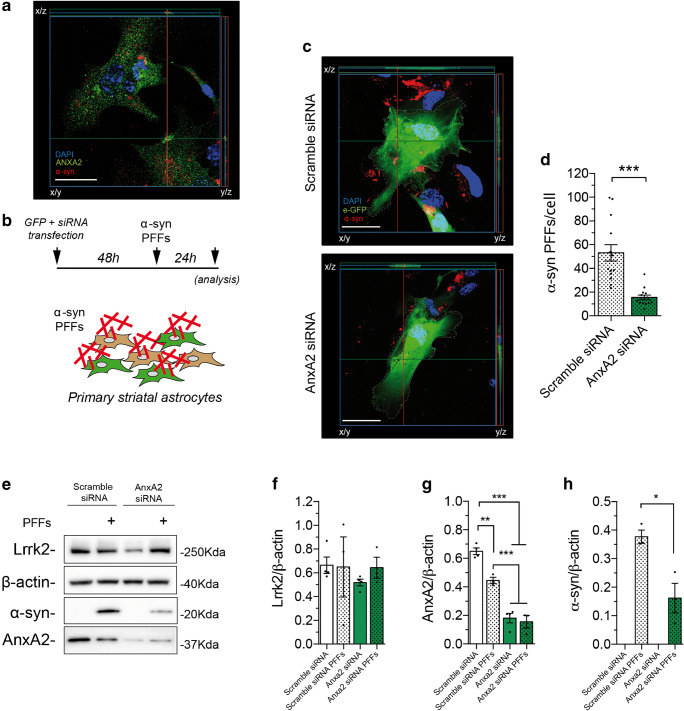
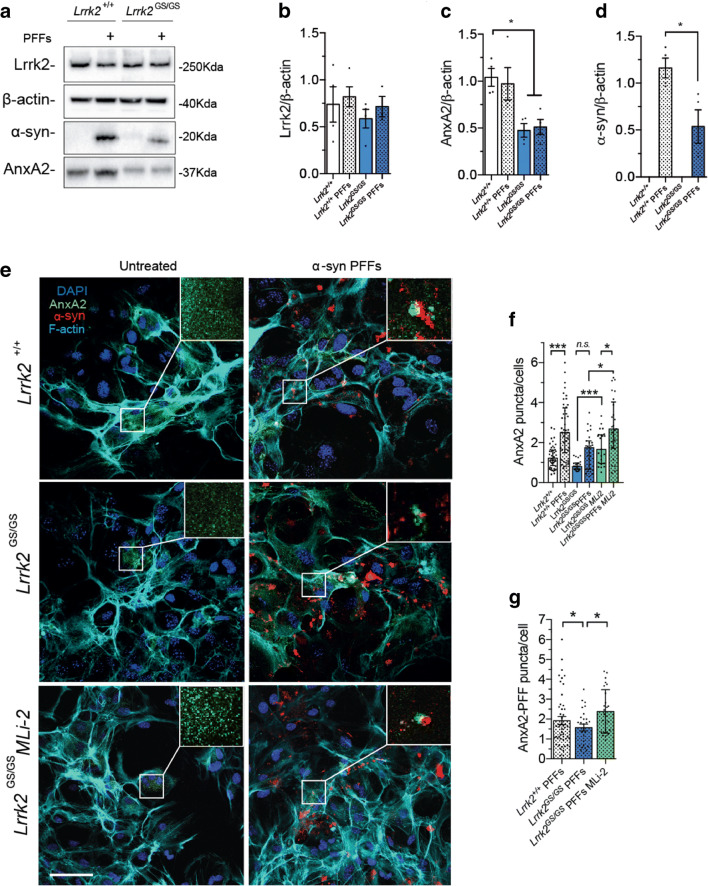
Parkinson’s disease (PD) is a neurodegenerative, progressive disease without a cure. To prevent PD onset or at least limit neurodegeneration, a better understanding of the underlying cellular and molecular disease mechanisms is crucial. Mutations in the leucine-rich repeat kinase 2 ( LRRK2 ) gene represent one of the most common causes of familial PD. In addition, LRRK2 variants are risk factors for sporadic PD, making LRRK2 an attractive therapeutic target. Mutations in LRRK2 have been linked to impaired alpha-synuclein (α-syn) degradation in neurons. However, in which way pathogenic LRRK2 affects α-syn clearance by astrocytes, the major glial cell type of the brain, remains unclear. The impact of astrocytes on PD progression has received more attention and recent data indicate that astrocytes play a key role in α-syn-mediated pathology. In the present study, we aimed to compare the capacity of wild-type astrocytes and astrocytes carrying the PD-linked G2019S mutation in Lrrk2 to ingest and degrade fibrillary α-syn. For this purpose, we used two different astrocyte culture systems that were exposed to sonicated α-syn for 24 h and analyzed directly after the α-syn pulse or 6 days later. To elucidate the impact of LRRK2 on α-syn clearance, we performed various analyses, including complementary imaging, transmission electron microscopy, and proteomic approaches. Our results show that astrocytes carrying the G2019S mutation in Lrrk2 exhibit a decreased capacity to internalize and degrade fibrillar α-syn via the endo-lysosomal pathway. In addition, we demonstrate that the reduction of α-syn internalization in the Lrrk2 G2019S astrocytes is linked to annexin A2 (AnxA2) loss of function. Together, our findings reveal that astrocytic LRRK2 contributes to the clearance of extracellular α-syn aggregates through an AnxA2-dependent mechanism.
Overview
The claims and statistics of this paper haven’t been checked yet.
Run the check — free, no account needed. It reads the open-access text and checks the sources it cites.
Integrity signals
Registry
Cites
Statistics
Figures
Verification
Claims the paper makes
The claims and statistics of this paper haven’t been checked yet.
Run the check — free, no account needed. It reads the open-access text and checks the sources it cites.
Claims other papers make about this one
Each is checked against this paper’s own text: does it say what the citing paper says it does?
The cited source says what the claim attributes to it.
In the citing paper
“Glial cells make up roughly half of the cells in the central nervous system (CNS) and LRRK2 has been shown to localize to microglia and astrocytes [30, 55, 80, 97].”
From Cellular and subcellular localization of Rab10 and phospho-T73 Rab10 in the mouse and human brain (2023) · cites this paper as [80]
Self-check
Percentages, sums and reported differences re-computed from the paper’s own numbers.
The self-check needs the paper’s full text.
Citations
Cites
Parkinson's disease: clinical features and diagnosis
Jankovic, J. (2008) · Journal of Neurology, Neurosurgery & Psychiatry · doi:10.1136/jnnp.2007.131045 · Cited by 5,720
Astrocytes: Biology and pathology
Sofroniew, M. V., & Vinters, H. V. (2010) · Acta Neuropathologica · doi:10.1007/s00401-009-0619-8 · Cited by 5,196
Li, J.-Y., Englund, E., Holton, J. L., Soulet, D., Hagell, P., Lees, A. J., Lashley, T., Quinn, N. P., Rehncrona, S., Björklund, A., et al. (2008) · Nature Medicine · doi:10.1038/nm1746 · Cited by 1,845
Lewy body–like pathology in long-term embryonic nigral transplants in Parkinson's disease
Kordower, J. H., Chu, Y., Hauser, R. A., Freeman, T. B., & Olanow, C. W. (2008) · Nature Medicine · doi:10.1038/nm1747 · Cited by 1,722
Middeldorp, J., & Hol, E. M. (2011) · Progress in Neurobiology · doi:10.1016/j.pneurobio.2011.01.005 · Cited by 1,080
Lee, H.-J., Suk, J.-E., Patrick, C., Bae, E.-J., Cho, J.-H., Rho, S., Hwang, D., Masliah, E., & Lee, S.-J. (2010) · Journal of Biological Chemistry · doi:10.1074/jbc.m109.081125 · Cited by 877
Hansen, C., Angot, E., Bergström, A.-L., Steiner, J. A., Pieri, L., Paul, G., Outeiro, T. F., Melki, R., Kallunki, P., Fog, K., et al. (2011) · Journal of Clinical Investigation · doi:10.1172/jci43366 · Cited by 842
Tu, P., Galvin, J. E., Baba, M., Giasson, B., Tomita, T., Leight, S., Nakajo, S., Iwatsubo, T., Trojanowski, J. Q., & Lee, V. M. ‐. (1998) · Annals of Neurology · doi:10.1002/ana.410440324 · Cited by 686
Triggering of inflammasome by aggregated α-synuclein, an inflammatory response in synucleinopathies
Codolo, G., Plotegher, N., Pozzobon, T., Brucale, M., Tessari, I., Bubacco, L., & de Bernard, M. (2013) · PLoS ONE · doi:10.1371/journal.pone.0055375 · Cited by 585
Microglia clear neuron-released α-synuclein via selective autophagy and prevent neurodegeneration
Choi, I., Zhang, Y., Seegobin, S. P., Pruvost, M., Wang, Q., Purtell, K., Zhang, B., & Yue, Z. (2020) · Nature Communications · doi:10.1038/s41467-020-15119-w · Cited by 549
Braak, H., Sastre, M., & Del Tredici, K. (2007) · Acta Neuropathologica · doi:10.1007/s00401-007-0244-3 · Cited by 462
di Domenico, A., Carola, G., Calatayud, C., Pons-Espinal, M., Muñoz, J. P., Richaud-Patin, Y., Fernandez-Carasa, I., Gut, M., Faella, A., Parameswaran, J., et al. (2019) · Stem Cell Reports · doi:10.1016/j.stemcr.2018.12.011 · Cited by 372
Human Astrocytes Transfer Aggregated Alpha-Synuclein via Tunneling Nanotubes
Rostami, J., Holmqvist, S., Lindström, V., Sigvardson, J., Westermark, G. T., Ingelsson, M., Bergström, J., Roybon, L., & Erlandsson, A. (2017) · The Journal of Neuroscience · doi:10.1523/jneurosci.0983-17.2017 · Cited by 339
Self-citationAlpha-synuclein cell-to-cell transfer and seeding in grafted dopaminergic neurons in vivo
Angot, E., Steiner, J. A., Lema Tomé, C. M., Ekström, P., Mattsson, B., Björklund, A., & Brundin, P. (2012) · PLoS ONE · doi:10.1371/journal.pone.0039465 · Cited by 270
Söllvander, S., Nikitidou, E., Brolin, R., Söderberg, L., Sehlin, D., Lannfelt, L., & Erlandsson, A. (2016) · Molecular Neurodegeneration · doi:10.1186/s13024-016-0098-z · Cited by 267
Self-citationHenry, A. G., Aghamohammadzadeh, S., Samaroo, H., Chen, Y., Mou, K., Needle, E., & Hirst, W. D. (2015) · Human Molecular Genetics · doi:10.1093/hmg/ddv314 · Cited by 235
Lindström, V., Gustafsson, G., Sanders, L. H., Howlett, E. H., Sigvardson, J., Kasrayan, A., Ingelsson, M., Bergström, J., & Erlandsson, A. (2017) · Molecular and Cellular Neuroscience · doi:10.1016/j.mcn.2017.04.009 · Cited by 233
Self-citationAssessment of α-Synuclein Secretion in Mouse and Human Brain Parenchyma
Emmanouilidou, E., Elenis, D., Papasilekas, T., Stranjalis, G., Gerozissis, K., Ioannou, P. C., & Vekrellis, K. (2011) · PLoS ONE · doi:10.1371/journal.pone.0022225 · Cited by 163
Kim, K. S., Marcogliese, P. C., Yang, J., Callaghan, S. M., Resende, V., Abdel-Messih, E., Marras, C., Visanji, N. P., Huang, J., Schlossmacher, M. G., et al. (2018) · Proceedings of the National Academy of Sciences · doi:10.1073/pnas.1718946115 · Cited by 111
LRRK2 and Rab10 coordinate macropinocytosis to mediate immunological responses in phagocytes
Liu, Z., Xu, E., Zhao, H. T., Cole, T., & West, A. B. (2020) · The EMBO Journal · doi:10.15252/embj.2020104862 · Cited by 90
Marker, D. F., Puccini, J. M., Mockus, T. E., Barbieri, J., Lu, S.-M., & Gelbard, H. A. (2012) · Journal of Neuroinflammation · doi:10.1186/1742-2094-9-261 · Cited by 90
Annexin A2 regulates phagocytosis of photoreceptor outer segments in the mouse retina
Law, A.-L., Ling, Q., Hajjar, K. A., Futter, C. E., Greenwood, J., Adamson, P., Wavre-Shapton, S. T., Moss, S. E., & Hayes, M. J. (2009) · Molecular Biology of the Cell · doi:10.1091/mbc.e08-12-1204 · Cited by 75
Research works printed but not linked: 71
- Spillantini MG, Schmidt ML, Lee VM, Trojanowski JQ, Jakes R, Goedert M (1997) Alpha-synuclein in Lewy bodies. Nature 388:839–840 · DOI · Paper page
- Wakabayashi K, Hayashi S, Yoshimoto M, Kudo H, Takahashi H (2000) NACP/alpha-synuclein-positive filamentous inclusions in astrocytes and oligodendrocytes of Parkinson’s disease brains. Acta Neuropathol 99:14–20 · DOI
- Terada S, Ishizu H, Yokota O, Tsuchiya K, Nakashima H, Ishihara T, Fujita D, Ueda K et al (2003) Glial involvement in diffuse Lewy body disease. Acta Neuropathol 105:163–169 · DOI
- Croisier E, Graeber MB (2006) Glial degeneration and reactive gliosis in alpha-synucleinopathies: the emerging concept of primary gliodegeneration. Acta Neuropathol 112:517–530 · DOI
- Rostami J, Fotaki G, Sirois J, Mzezewa R, Bergstrom J, Essand M, Healy L, Erlandsson A (2020) Astrocytes have the capacity to act as antigen-presenting cells in the Parkinson’s disease brain. J Neuroinflammation 17:119 · DOI · Paper page
- Biskup S, Moore DJ, Rea A, Lorenz-Deperieux B, Coombes CE, Dawson VL, Dawson TM, West AB (2007) Dynamic and redundant regulation of LRRK2 and LRRK1 expression. BMC Neurosci 8:102 · DOI
- Booth HDE, Hirst WD, Wade-Martins R (2017) The role of astrocyte dysfunction in Parkinson’s disease pathogenesis. Trends Neurosci 40:358–370 · DOI · Paper page
- Tolosa E, Vila M, Klein C, Rascol O (2020) LRRK2 in Parkinson disease: challenges of clinical trials. Nat Rev Neurol 16:97–107 · DOI
- Alessi DR, Sammler E (2018) LRRK2 kinase in Parkinson’s disease. Science 360:36–37 · DOI · Paper page
- Martin I, Dawson VL, Dawson TM (2011) Recent advances in the genetics of Parkinson’s disease. Annu Rev Genomics Hum Genet 12:301–325 · DOI
- Cogo S, Manzoni C, Lewis PA, Greggio E (2020) Leucine-rich repeat kinase 2 and lysosomal dyshomeostasis in Parkinson disease. J Neurochem 152:273–283 · DOI
- Cookson MR (2017) Mechanisms of Mutant LRRK2 Neurodegeneration. Adv Neurobiol 14:227–239 · DOI
- Chen J, Chen Y, Pu J (2018) Leucine-rich repeat kinase 2 in Parkinson’s disease: updated from pathogenesis to potential therapeutic target. Eur Neurol 79:256–265 · DOI
- Schapansky J, Khasnavis S, DeAndrade MP, Nardozzi JD, Falkson SR, Boyd JD, Sanderson JB, Bartels T et al (2018) Familial knockin mutation of LRRK2 causes lysosomal dysfunction and accumulation of endogenous insoluble alpha-synuclein in neurons. Neurobiol Dis 111:26–35 · DOI
- Tong Y, Giaime E, Yamaguchi H, Ichimura T, Liu Y, Si H, Cai H, Bonventre JV et al (2012) Loss of leucine-rich repeat kinase 2 causes age-dependent bi-phasic alterations of the autophagy pathway. Mol Neurodegener 7:2 · DOI
- Bieri G, Brahic M, Bousset L, Couthouis J, Kramer NJ, Ma R, Nakayama L, Monbureau M et al (2019) LRRK2 modifies alpha-syn pathology and spread in mouse models and human neurons. Acta Neuropathol 137:961–980 · DOI
- Sanyal A, DeAndrade MP, Novis HS, Lin S, Chang J, Lengacher N, Tomlinson JJ, Tansey MG et al (2020) Lysosome and inflammatory defects in GBA1-mutant astrocytes are normalized by LRRK2 inhibition. Mov Disord 35:760–773 · DOI
- Hartlova A, Herbst S, Peltier J, Rodgers A, Bilkei-Gorzo O, Fearns A, Dill BD, Lee H et al (2018) LRRK2 is a negative regulator of Mycobacterium tuberculosis phagosome maturation in macrophages. EMBO J 37:e98694 · DOI
- Lee H, Flynn R, Sharma I, Haberman E, Carling PJ, Nicholls FJ, Stegmann M, Vowles J et al (2020) LRRK2 is recruited to phagosomes and co-recruits RAB8 and RAB10 in human pluripotent stem cell-derived macrophages. Stem Cell Reports 14:940–955 · DOI
- Loov C, Hillered L, Ebendal T, Erlandsson A (2012) Engulfing astrocytes protect neurons from contact-induced apoptosis following injury. PLoS One 7:e33090 · DOI
- Loov C, Mitchell CH, Simonsson M, Erlandsson A (2015) Slow degradation in phagocytic astrocytes can be enhanced by lysosomal acidification. Glia 63:1997–2009 · DOI
- Loria F, Vargas JY, Bousset L, Syan S, Salles A, Melki R, Zurzolo C (2017) Alpha-synuclein transfer between neurons and astrocytes indicates that astrocytes play a role in degradation rather than in spreading. Acta Neuropathol 134:789–808 · DOI
- Ferrazza R, Cogo S, Melrose H, Bubacco L, Greggio E, Guella G, Civiero L, Plotegher N (2016) LRRK2 deficiency impacts ceramide metabolism in brain. Biochem Biophys Res Commun 478:1141–1146 · DOI
- Civiero L, Cirnaru MD, Beilina A, Rodella U, Russo I, Belluzzi E, Lobbestael E, Reyniers L et al (2015) Leucine-rich repeat kinase 2 interacts with p21-activated kinase 6 to control neurite complexity in mammalian brain. J Neurochem 135:1242–1256 · DOI
- Longo F, Mercatelli D, Novello S, Arcuri L, Brugnoli A, Vincenzi F, Russo I, Berti G et al (2017) Age-dependent dopamine transporter dysfunction and Serine129 phospho-alpha-synuclein overload in G2019S LRRK2 mice. Acta Neuropathol Commun 5:22 · DOI
- Davis AA, Temple S (1994) A self-renewing multipotential stem cell in embryonic rat cerebral cortex. Nature 372:263–266 · DOI
- Johe KK, Hazel TG, Muller T, Dugich-Djordjevic MM, McKay RD (1996) Single factors direct the differentiation of stem cells from the fetal and adult central nervous system. Genes Dev 10:3129–3140 · DOI
- Ravin R, Hoeppner DJ, Munno DM, Carmel L, Sullivan J, Levitt DL, Miller JL, Athaide C et al (2008) Potency and fate specification in CNS stem cell populations in vitro. Cell Stem Cell 3:670–680 · DOI
- Sollvander S, Nikitidou E, Gallasch L, Zysk M, Soderberg L, Sehlin D, Lannfelt L, Erlandsson A (2018) The Abeta protofibril selective antibody mAb158 prevents accumulation of Abeta in astrocytes and rescues neurons from Abeta-induced cell death. J Neuroinflammation 15:98 · DOI
- Civiero L, Vancraenenbroeck R, Belluzzi E, Beilina A, Lobbestael E, Reyniers L, Gao F, Micetic I et al (2012) Biochemical characterization of highly purified leucine-rich repeat kinases 1 and 2 demonstrates formation of homodimers. PLoS One 7:e43472 · DOI
- Pivato M, De Franceschi G, Tosatto L, Frare E, Kumar D, Aioanei D, Brucale M, Tessari I et al (2012) Covalent alpha-synuclein dimers: chemico-physical and aggregation properties. PLoS One 7:e50027 · DOI
- Kim Y, Ho SO, Gassman NR, Korlann Y, Landorf EV, Collart FR, Weiss S (2008) Efficient site-specific labeling of proteins via cysteines. Bioconjug Chem 19:786–791 · DOI
- Hurbain I, Romao M, Bergam P, Heiligenstein X, Raposo G (2017) Analyzing lysosome-related organelles by electron microscopy. Methods Mol Biol 1594:43–71 · DOI
- Carraro M, Checchetto V, Sartori G, Kucharczyk R, di Rago JP, Minervini G, Franchin C, Arrigoni G et al (2018) High-conductance channel formation in yeast mitochondria is mediated by F-ATP synthase e and g subunits. Cell Physiol Biochem 50:1840–1855 · DOI
- Gustafsson G, Lindstrom V, Rostami J, Nordstrom E, Lannfelt L, Bergstrom J, Ingelsson M, Erlandsson A (2017) Alpha-synuclein oligomer-selective antibodies reduce intracellular accumulation and mitochondrial impairment in alpha-synuclein exposed astrocytes. J Neuroinflammation 14:241 · DOI
- Westerlund M, Belin AC, Anvret A, Bickford P, Olson L, Galter D (2008) Developmental regulation of leucine-rich repeat kinase 1 and 2 expression in the brain and other rodent and human organs: implications for Parkinson’s disease. Neuroscience 152:429–436 · DOI
- Giesert F, Hofmann A, Burger A, Zerle J, Kloos K, Hafen U, Ernst L, Zhang J et al (2013) Expression analysis of Lrrk1, Lrrk2 and Lrrk2 splice variants in mice. PLoS One 8:e63778 · DOI
- Hawrysh PJ, Buck LT (2019) Mitochondrial matrix pH acidifies during anoxia and is maintained by the F1Fo-ATPase in anoxia-tolerant painted turtle cortical neurons. FEBS Open Bio 9:571–581 · DOI
- Lerch S, Ritz S, Bley K, Messerschmidt C, Weiss CK, Musyanovych A, Landfester K, Mailander V (2015) Nanoprobing the acidification process during intracellular uptake and trafficking. Nanomedicine 11:1585–1596 · DOI
- Repetto G, del Peso A, Zurita JL (2008) Neutral red uptake assay for the estimation of cell viability/cytotoxicity. Nat Protoc 3:1125–1131 · DOI
- Pinsino A, Russo R, Bonaventura R, Brunelli A, Marcomini A, Matranga V (2015) Titanium dioxide nanoparticles stimulate sea urchin immune cell phagocytic activity involving TLR/p38 MAPK-mediated signalling pathway. Sci Rep 5:14492 · DOI
- Shen K, Sidik H, Talbot WS (2016) The rag-ragulator complex regulates lysosome function and phagocytic flux in microglia. Cell Rep 14:547–559 · DOI
- Scharf B, Clement CC, Wu XX, Morozova K, Zanolini D, Follenzi A, Larocca JN, Levon K et al (2012) Annexin A2 binds to endosomes following organelle destabilization by particulate wear debris. Nat Commun 3:755 · DOI
- Li R, Tan S, Yu M, Jundt MC, Zhang S, Wu M (2015) Annexin A2 regulates autophagy in pseudomonas aeruginosa infection through the Akt1-mTOR-ULK1/2 signaling pathway. J Immunol 195:3901–3911 · DOI
- Moreau K, Ghislat G, Hochfeld W, Renna M, Zavodszky E, Runwal G, Puri C, Lee S et al (2015) Transcriptional regulation of annexin A2 promotes starvation-induced autophagy. Nat Commun 6:8045 · DOI
- Morozova K, Sridhar S, Zolla V, Clement CC, Scharf B, Verzani Z, Diaz A, Larocca JN et al (2015) Annexin A2 promotes phagophore assembly by enhancing Atg16L(+) vesicle biogenesis and homotypic fusion. Nat Commun 6:5856 · DOI
- Bustos V, Pulina MV, Bispo A, Lam A, Flajolet M, Gorelick FS, Greengard P (2017) Phosphorylated presenilin 1 decreases beta-amyloid by facilitating autophagosome-lysosome fusion. Proc Natl Acad Sci U S A 114:7148–7153 · DOI
- de Graauw M, Cao L, Winkel L, van Miltenburg MH, le Devedec SE, Klop M, Yan K, Pont C et al (2014) Annexin A2 depletion delays EGFR endocytic trafficking via cofilin activation and enhances EGFR signaling and metastasis formation. Oncogene 33:2610–2619 · DOI
- Stukes S, Coelho C, Rivera J, Jedlicka AE, Hajjar KA, Casadevall A (2016) The membrane phospholipid binding protein annexin A2 promotes phagocytosis and nonlytic exocytosis of cryptococcus neoformans and impacts survival in fungal infection. J Immunol 197:1252–1261 · DOI
- Zhang Y, Sloan SA, Clarke LE, Caneda C, Plaza CA, Blumenthal PD, Vogel H, Steinberg GK et al (2016) Purification and characterization of progenitor and mature human astrocytes reveals transcriptional and functional differences with mouse. Neuron 89:37–53 · DOI · Paper page
- Fell MJ, Mirescu C, Basu K, Cheewatrakoolpong B, DeMong DE, Ellis JM, Hyde LA, Lin Y et al (2015) MLi-2, a potent, selective, and centrally active compound for exploring the therapeutic potential and safety of LRRK2 kinase inhibition. J Pharmacol Exp Ther 355:397–409 · DOI
- Recasens A, Dehay B (2014) Alpha-synuclein spreading in Parkinson’s disease. Front Neuroanat 8:159 · DOI
- Luk KC, Kehm VM, Zhang B, O’Brien P, Trojanowski JQ, Lee VMY (2012) Intracerebral inoculation of pathological α-synuclein initiates a rapidly progressive neurodegenerative α-synucleinopathy in mice. J Exp Med 209:975–986 · DOI
- Desplats P, Lee HJ, Bae EJ, Patrick C, Rockenstein E, Crews L, Spencer B, Masliah E et al (2009) Inclusion formation and neuronal cell death through neuron-to-neuron transmission of -synuclein. Proc Natl Acad Sci 106:13010–13015 · DOI · Paper page
- Lee HJ, Patel S, Lee SJ (2005) Intravesicular localization and exocytosis of alpha-synuclein and its aggregates. J Neurosci 25:6016–6024 · DOI
- Reyes JF, Olsson TT, Lamberts JT, Devine MJ, Kunath T, Brundin P (2015) A cell culture model for monitoring α-synuclein cell-to-cell transfer. Neurobiol Dis 77:266–275 · DOI
- Danzer KM, Ruf WP, Putcha P, Joyner D, Hashimoto T, Glabe C, Hyman BT, McLean PJ (2011) Heat-shock protein 70 modulates toxic extracellular alpha-synuclein oligomers and rescues trans-synaptic toxicity. FASEB J 25:326–336 · DOI
- Zhao Y, Keshiya S, Atashrazm F, Gao J, Ittner LM, Alessi DR, Halliday GM, Fu Y et al (2018) Nigrostriatal pathology with reduced astrocytes in LRRK2 S910/S935 phosphorylation deficient knockin mice. Neurobiol Dis 120:76–87 · DOI
- Lee JH, Han JH, Kim H, Park SM, Joe EH, Jou I (2019) Parkinson’s disease-associated LRRK2-G2019S mutant acts through regulation of SERCA activity to control ER stress in astrocytes. Acta Neuropathol Commun 7:68 · DOI
- Lara Ordonez AJ, Fernandez B, Fdez E, Romo-Lozano M, Madero-Perez J, Lobbestael E, Baekelandt V, Aiastui A et al (2019) RAB8, RAB10 and RILPL1 contribute to both LRRK2 kinase-mediated centrosomal cohesion and ciliogenesis deficits. Hum Mol Genet 28:3552–3568 · DOI · Paper page
- Booth HDE, Wessely F, Connor-Robson N, Rinaldi F, Vowles J, Browne C, Evetts SG, Hu MT et al (2019) RNA sequencing reveals MMP2 and TGFB1 downregulation in LRRK2 G2019S Parkinson’s iPSC-derived astrocytes. Neurobiol Dis 129:56–66 · DOI
- Hyttinen JMT, Amadio M, Viiri J, Pascale A, Salminen A, Kaarniranta K (2014) Clearance of misfolded and aggregated proteins by aggrephagy and implications for aggregation diseases. Ageing Res Rev 18:16–28 · DOI
- Baptista MA, Dave KD, Frasier MA, Sherer TB, Greeley M, Beck MJ, Varsho JS, Parker GA et al (2013) Loss of leucine-rich repeat kinase 2 (LRRK2) in rats leads to progressive abnormal phenotypes in peripheral organs. PLoS One 8:e80705 · DOI
- Walter J, Bolognin S, Antony PMA, Nickels SL, Poovathingal SK, Salamanca L, Magni S, Perfeito R et al (2019) Neural stem cells of Parkinson’s disease patients exhibit aberrant mitochondrial morphology and functionality. Stem Cell Reports 12:878–889 · DOI
- Hipolito VEB, Diaz JA, Tandoc KV, Oertlin C, Ristau J, Chauhan N, Saric A, McLaughlan S et al (2019) Enhanced translation expands the endo-lysosome size and promotes antigen presentation during phagocyte activation. PLoS Biol 17:e3000535 · DOI
- Mayran N, Parton RG, Gruenberg J (2003) Annexin II regulates multivesicular endosome biogenesis in the degradation pathway of animal cells. EMBO J 22:3242–3253 · DOI
- Grieve AG, Moss SE, Hayes MJ (2012) Annexin A2 at the interface of actin and membrane dynamics: a focus on its roles in endocytosis and cell polarization. Int J Cell Biol 2012:852430 · DOI
- Eberhard DA, Brown MD, VandenBerg SR (1994) Alterations of annexin expression in pathological neuronal and glial reactions. Immunohistochemical localization of annexins I, II (p36 and p11 subunits), IV, and VI in the human hippocampus. Am J Pathol 145:640–649
- Juul-Madsen K, Qvist P, Bendtsen KL, Langkilde AE, Vestergaard B, Howard KA, Dehesa-Etxebeste M, Paludan SR et al (2020) Size-selective phagocytic clearance of fibrillar alpha-synuclein through conformational activation of complement Receptor 4. J Immunol 204:1345–1361 · DOI
- Zhang Q, Xu Y, Lee J, Jarnik M, Wu X, Bonifacino JS, Shen J, Ye Y (2020) A myosin-7B-dependent endocytosis pathway mediates cellular entry of alpha-synuclein fibrils and polycation-bearing cargos. Proc Natl Acad Sci U S A 117:10865–10875 · DOI
- Rodriguez L, Marano MM, Tandon A (2018) Import and export of misfolded alpha-synuclein. Front Neurosci 12:344 · DOI · Paper page
Cited by
Sorted by citations
Astrocyte contribution to dysfunction, risk and progression in neurodegenerative disorders
Brandebura, A. N., Paumier, A., Onur, T. S., & Allen, N. J. (2023) · Nature Reviews Neuroscience · doi:10.1038/s41583-022-00641-1 · Cited by 427
Scheiblich, H., Eikens, F., Wischhof, L., Opitz, S., Jüngling, K., Cserép, C., Schmidt, S. V., Lambertz, J., Bellande, T., Pósfai, B., et al. (2024) · Neuron · doi:10.1016/j.neuron.2024.06.029 · Cited by 207
Extracellular Vesicles as Novel Diagnostic and Prognostic Biomarkers for Parkinson’s Disease
Leggio, L., Paternò, G., Vivarelli, S., Falzone, G. G., Giachino, C., Marchetti, B., & Iraci, N. (2021) · Aging and disease · doi:10.14336/ad.2021.0527 · Cited by 55
Kalecký, K., & Bottiglieri, T. (2023) · npj Parkinson's Disease · doi:10.1038/s41531-023-00531-y · Cited by 32
Cellular and subcellular localization of Rab10 and phospho-T73 Rab10 in the mouse and human brain
Singh, V., Menard, M. A., Serrano, G. E., Beach, T. G., Zhao, H. T., Riley-DiPaolo, A., Subrahmanian, N., LaVoie, M. J., & Volpicelli-Daley, L. A. (2023) · Acta Neuropathologica Communications · doi:10.1186/s40478-023-01704-9 · Cited by 9
Metadata
- Authors
- Streubel-Gallasch, L., Giusti, V., Sandre, M., Tessari, I., Plotegher, N., Giusto, E., Masato, A., Iovino, L., Battisti, I., Arrigoni, G., Shimshek, D., Greggio, E., Tremblay, M.-E., Bubacco, L., Erlandsson, A., & Civiero, L.
- Venue
- Molecular Neurobiology
- Published
- 2021-02-24
- Volume
- 58
- Issue
- 7
- Pages
- 3119-3140
- ISSN
- 0893-7648
- 1559-1182
- PMC
- PMC8257537
- Cited by
- 100
- References
- 22
- Language
- en
- Funders
- Università degli Studi di Padova
- Italian Ministry of Health
- ParkinsonFörbundet
- Dementia Association Foundation
- Swedish Brain Foundation
- Swedish Research Council
- Ahlen Foundation
- Stiftelsen Olle Engkvist Byggmästare
- Torsten Söderbergs Stiftelse
About these checks
Registry, retraction, Cites and statistics results are computed, not judged, with one exception: a printed reference that no index lists is read once by a model before it counts as a citation error. Claims are extracted by a model and kept only when their quote appears verbatim in the text; each cited source is then checked, with a model’s help, for whether it says what the claim relies on. Those verdicts can be wrong — read the claim’s quote and the cited source before relying on one.
Statistics and arithmetic are recomputed, not judged.
Confidence bands are shown only for fields calibrated on our annotated test set. None is calibrated yet, so no band is shown.
What counts as a claim ›How we measure confidence ›How we check this ›
Are you an author, or do you see a problem with this page? Request a review
