

The DOI matches its Crossref record; 259 of the 259 references it cites were found in a registry or an index; 43 of the 376 sources its claims cite were checked for support.
Changes in tropospheric air quality related to the protection of stratospheric ozone in a changing climate
Open accessAbstract
Ultraviolet (UV) radiation drives the net production of tropospheric ozone (O 3) and a large fraction of particulate matter (PM) including sulfate, nitrate, and secondary organic aerosols. Ground-level O 3 and PM are detrimental to human health, leading to several million premature deaths per year globally, and have adverse effects on plants and the yields of crops. The Montreal Protocol has prevented large increases in UV radiation that would have had major impacts on air quality. Future scenarios in which stratospheric O 3 returns to 1980 values or even exceeds them (the so-called super-recovery) will tend to ameliorate urban ground-level O 3 slightly but worsen it in rural areas. Furthermore, recovery of stratospheric O 3 is expected to increase the amount of O 3 transported into the troposphere by meteorological processes that are sensitive to climate change. UV radiation also generates hydroxyl radicals (OH) that control the amounts of many environmentally important chemicals in the atmosphere including some greenhouse gases, e.g., methane (CH 4), and some short-lived ozone-depleting substances (ODSs). Recent modeling studies have shown that the increases in UV radiation associated with the depletion of stratospheric ozone over 1980–2020 have contributed a small increase (~ 3%) to the globally averaged concentrations of OH. Replacements for ODSs include chemicals that react with OH radicals, hence preventing the transport of these chemicals to the stratosphere. Some of these chemicals, e.g., hydrofluorocarbons that are currently being phased out, and hydrofluoroolefins now used increasingly, decompose into products whose fate in the environment warrants further investigation. One such product, trifluoroacetic acid (TFA), has no obvious pathway of degradation and might accumulate in some water bodies, but is unlikely to cause adverse effects out to 2100. Graphical abstract
Overview
AI snapshot
Written from the paper’s full text.
TL;DR
This assessment reviews how stratospheric ozone protection and climate change alter tropospheric air quality, especially UV-driven ozone, particulate matter, OH, and trifluoroacetic acid (TFA). It concludes that the Montreal Protocol has avoided large UV increases, ozone recovery may slightly improve urban O3 but worsen rural O3, and projected TFA risks remain de minimis.
Key findings
- Recovery of stratospheric O3 to 1980 levels is estimated to increase the U.S. O3 column by 4–6% and to lower ambient O3 over a few large urban areas while raising it slightly elsewhere; under super-recovery by 2100, stratospheric O3 could increase by an additional 10% above 1980 levels under high emission scenarios, decreasing tropospheric JO3 by about 14%, with changes about three times greater than for recovery to 1980 levels.
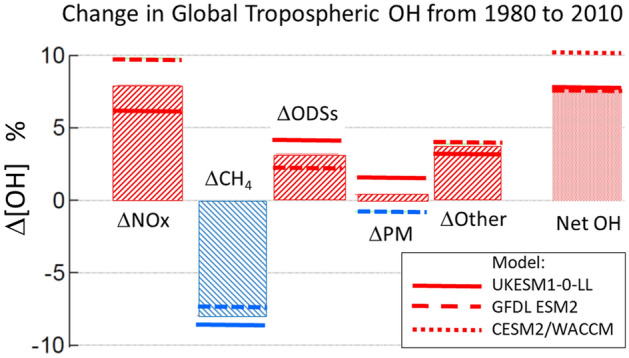
- UV-B drives OH; modeling studies show increases in UV from stratospheric ozone depletion over 1980–2020 contributed a small increase (~3%) to globally averaged OH, while three Earth System Models gave a net OH increase of about 8% over 1980–2010, with rising CH4 counteracting by about −8%.
- Health: WHO estimates 4.2 million deaths/year from ambient air pollution; in ELAPSE, among 325,367 adults, each 5 µg/m3 increase in PM2.5 was associated with a 13% (95% CI 10.6–15.5%) increase in natural deaths, and below the U.S. 12 µg/m3 standard with nearly 30% (29.6%, 95% CI 14–47.4%) increase.
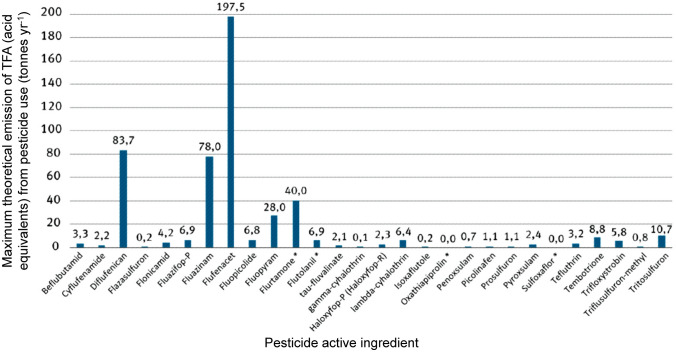
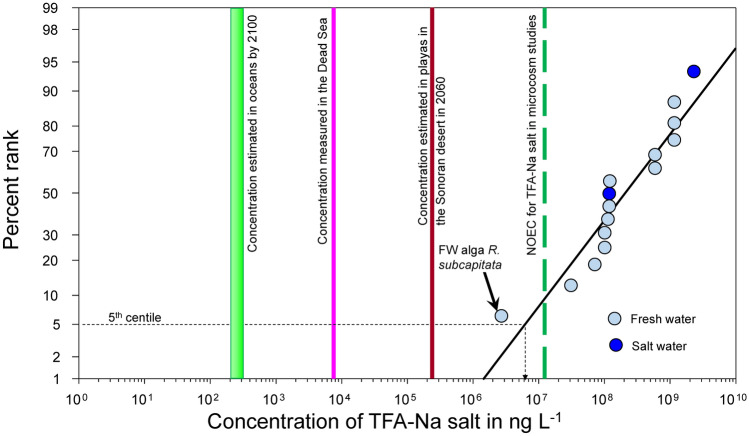
- TFA: projected deposition from HFC-134a and HFO-1234yf is 31.5–51.9 Tg for 2020–2100, raising ocean TFA sodium salt to 266–284 ng/L by 2100; margins of exposure are thousand-fold versus toxicity thresholds, and TFA is judged de minimis risk. U.S. pesticide use 1992–2018 was estimated to potentially release 122,604 tons TFA under worst-case assumptions.
Methods
- Design: quadrennial assessment/review in two parts: (1) effects of stratospheric O3 depletion, UV-B, and climate change on tropospheric air quality and health/ecosystems; (2) sources, fate, and risks of TFA.
- Data: literature searched through PubMed, Google Scholar, ScienceDirect, and relevant journals for peer-reviewed papers from 2018–2022, plus reports from international agencies (e.g., WHO) and government agencies (e.g., US EPA); papers/reports critically evaluated before inclusion.
- Analysis: synthesis of observations and numerical model results; includes new calculations/estimates, e.g., worst-case TFA tonnage from U.S. pesticide use using USGS data and molar yields.
Limitations
- Stated: major uncertainties remain for future emissions scenarios and environmental conditions (UV-B, temperature, humidity); models need improvement for urban VOC-NOx O3 chemistry, SOA formation, and stratospheric–tropospheric O3 exchange; global OH concentrations and variability need better constraints.
- Stated: TFA source identification/quantification, especially natural sources and short-lived precursor inventories, is uncertain; TFA toxicity data are limited because only two marine species are included and marine macrophytes have not been tested.
- Evident: as a review/assessment, conclusions depend on cited studies and model outputs rather than new primary measurements; many reported quantities have wide ranges or model disagreement (e.g., stratospheric–tropospheric exchange estimates vary from 347 ± 12 to 628 ± 800 Tg/year).
Model-written summary. Check it against the paper before relying on it.
Integrity signals
Registry
Cites
Statistics
Figures
Verification
Claims the paper makes
265 Not checked yet · 105 Own interpretation · 43 No basis given · 9 Supported · 8 Partly supported · 4 Own result · 1 Not supported · accuracy not yet measured
At least one cited source doesn’t support this claim or points to a different paper, and none confirmed it — see the verdicts below.
In the paper
“However, there is insufficient agreement between models to quantify trends.”
§ Changes in tropospheric air quality related to the protection of stratospheric ozone in a changing climate > UV-dependent air pollutants and their effects on human health, plants, and the self-cleaning capacity of the troposphere > Changes in atmospheric circulation and transport of pollutants
What the sources say
- Disputedcites [161] Abalos, M., Orbe, C., Kinnison, D. E., Plummer, D., Oman, L. D., Jöckel, P., Morgenstern, O., Garcia, R. R., Zeng, G., Stone, K. A., & Dameris, M. (2020). Future trends in stratosphere-to-troposphere transport in CCMI models. Atmospheric Chemistry and Physics, 20(11), 6883–6901. https://doi.org/10.5194/acp-20-6883-2020 sourceExperimental — accuracy not yet measured
The Conclusions (section 6; page not provided) say all models agree on a future increase in stratospheric tracers in the troposphere and quantify projected changes, including a 10%–16% increase in the tropospheric column of stratospheric ozone. Section 4 notes limited model agreement for the eddy-mixing term specifically, but that narrower uncertainty does not support the claim that model agreement is insufficient to quantify exchange trends generally. (LLM, conf=0.89)
Checked by a reasoning model — may be wrong.
plain- Asserted: passes — The authors put it forward as true.
- Checkable: passes — It can be checked against evidence.
- Load-bearing: passes — The paper’s conclusions depend on it.
- Based: passes — The paper gives a reason why it holds.
- Disputed
The cited sources support only part of this claim — read each source’s verdict below.
In the paper
“However, recent climate model simulations [20–22], also reviewed by Bernhard et al. [23], suggest that under some scenarios of increasing greenhouse gas emissions, stratospheric O3 could exceed the 1980 baseline (the so-called “super-recovery”).”
§ Changes in tropospheric air quality related to the protection of stratospheric ozone in a changing climate > UV-dependent air pollutants and their effects on human health, plants, and the self-cleaning capacity of the troposphere > UV radiation and ground-level ozone
What the sources say
- Partly supportedcites [20] Butler, A. H., Daniel, J. S., Portmann, R. W., Ravishankara, A. R., Young, P. J., Fahey, D. W., & Rosenlof, K. H. (2016). Diverse policy implications for future ozone and surface UV in a changing climate. Environmental Research Letters, 11(6), 064017. https://doi.org/10.1088/1748-9326/11/6/064017 sourceExperimental — accuracy not yet measured
The Results report that under the high-emissions RCP 8.5 scenario, stratospheric ozone substantially exceeds historical levels in the extratropics, while remaining depleted in the tropics. The paper compares future ozone with a 1955–1975 historical period, not an explicitly defined 1980 baseline, so that specific baseline is not verified by our copy. (LLM, conf=0.86)
- Partly supportedcites [21] Keeble, J., Hassler, B., Banerjee, A., Checa-Garcia, R., Chiodo, G., Davis, S., Eyring, V., Griffiths, P. T., Morgenstern, O., Nowack, P., Zeng, G., Zhang, J., Bodeker, G., Burrows, S., Cameron-Smith, P., Cugnet, D., Danek, C., Deushi, M., Horowitz, L. W., Kubin, A., et al. (2021). Evaluating stratospheric ozone and water vapour changes in CMIP6 models from 1850 to 2100. Atmospheric Chemistry and Physics, 21(6), 5015–5061. https://doi.org/10.5194/acp-21-5015-2021 sourceExperimental — accuracy not yet measured
Section 3.3 projects super-recovery under the higher-emissions SSP3-7.0 and SSP5-8.5 scenarios, supporting the claim's central point. But that result concerns total column ozone at midlatitudes and high latitudes, not stratospheric ozone alone; the paper compares the projected exceedance with 1960s values, rather than explicitly with a 1980 baseline. The Discussion and conclusions also notes that tropospheric ozone contributes to the projected increase. (LLM, conf=0.84)
- Partly supportedcites [22] Shepherd, T. G. (2008). Dynamics, stratospheric ozone, and climate change. Atmosphere-Ocean, 46(1), 117–138. https://doi.org/10.3137/ao.460106 sourceExperimental — accuracy not yet measured
The Summary and discussion predicts that future near-global ozone will exceed 1980 levels. But it explicitly says this is not evidence of long-term “super-recovery”: in the model, 1980 ozone was already depleted, and the increase tracks declining halogens rather than a demonstrated greenhouse-gas effect. (LLM, conf=0.88)
- Supportedcites [23] Bernhard, G. H., Bais, A. F., Aucamp, P. J., Klekociuk, A. R., Liley, J. B., & McKenzie, R. L. (2023). Stratospheric ozone, UV radiation, and climate interactions. Photochemical & Photobiological Sciences. https://doi.org/10.1007/s43630-023-00371-y source
In “Estimates of total column ozone during the twenty-first century,” the paper projects that, under scenarios with continued greenhouse-gas increases, near-global mean total column ozone will significantly exceed 1980 levels. It calls this overshoot “super-recovery.” (LLM, conf=0.94)
hedgedstates a possible cause- Asserted: passes — The authors put it forward as true.
- Checkable: passes — It can be checked against evidence.
- Load-bearing: passes — The paper’s conclusions depend on it.
- Based: passes — The paper gives a reason why it holds.
- Partly supported
Every source the paper cites for this claim was checked and supports it.
In the paper
“A similar effect on CCN was also observed upon UV-B irradiation of SOA formed from the oxidation of α-pinene and naphthalene [74], which are biogenic and anthropogenic SOA precursors, respectively.”
§ Changes in tropospheric air quality related to the protection of stratospheric ozone in a changing climate > UV-dependent air pollutants and their effects on human health, plants, and the self-cleaning capacity of the troposphere > UV radiation and particulate matter
What the sources say
- Supportedcites [74] Borduas-Dedekind, N., Nizkorodov, S., & McNeill, K. (2020). UVB-irradiated laboratory-generated secondary organic aerosol extracts have increased cloud condensation nuclei abilities: Comparison with dissolved organic matter and implications for the photomineralization mechanism. Chimia (Aarau), 74(3), 142–148. https://doi.org/10.2533/chimia.2020.142 source
Section 3.2 reports that UVB irradiation increased the CCN ability of both α-pinene and naphthalene SOA extracts. The Introduction identifies α-pinene and naphthalene as representative biogenic and anthropogenic precursors, respectively. (LLM, conf=0.94)
plainstates a cause- Asserted: passes — The authors put it forward as true.
- Checkable: passes — It can be checked against evidence.
- Load-bearing: passes — The paper’s conclusions depend on it.
- Based: passes — The paper gives a reason why it holds.
- Supported
The cited sources support only part of this claim — read each source’s verdict below.
In the paper
“Research conducted as part of the ‘Effects of Low-Level Air Pollution: A Study in Europe’ (ELAPSE) [81, 86–92] examined the mortality and morbidity effects of exposure to low concentrations of four air pollutants: PM2.5, NO2, black carbon (BC), and tropospheric warm season O3, with some of the research also investigating the importance of elemental components of PM2.5 [88, 92–94].”
§ Changes in tropospheric air quality related to the protection of stratospheric ozone in a changing climate > UV-dependent air pollutants and their effects on human health, plants, and the self-cleaning capacity of the troposphere > Health impacts of photochemical smog
What the sources say
- Not checked yetcites [81] Brunekreef, B., Strak, M., Chen, J., Andersen, Z. J., Atkinson, R., Bauwelinck, M., Bellander, T., Boutron-Ruault, M. C., Brandt, J., Carey, I., Cesaroni, G., Forastiere, F., Fecht, D., Gulliver, J., Hertel, O., Hoffmann, B., de Hoogh, K., Houthuijs, D., Hvidtfeldt, U. A., & Janssen, N. A. H., et al. (2021). Mortality and morbidity effects of long-term exposure to low-level PM2.5, BC, NO2, and O3: An analysis of European cohorts in the ELAPSE project (Vol. WA 754 R432 No. 208, HEI Report Series): Health Effects Institute
- Partly supportedcites [86] Liu, S., Jørgensen, J. T., Ljungman, P., Pershagen, G., Bellander, T., Leander, K., Magnusson, P. K. E., Rizzuto, D., Hvidtfeldt, U. A., Raaschou-Nielsen, O., Wolf, K., Hoffmann, B., Brunekreef, B., Strak, M., Chen, J., Mehta, A., Atkinson, R. W., Bauwelinck, M., Varraso, R., Boutron-Ruault, M. C., et al. (2021). Long-term exposure to low-level air pollution and incidence of chronic obstructive pulmonary disease: The ELAPSE project. Environment International, 146, 106267. https://doi.org/10.1016/j.envint.2020.106267 sourceExperimental — accuracy not yet measured
The Introduction states that this ELAPSE study investigated low-level exposure to PM2.5, NO2, black carbon, and ozone in relation to COPD development. The Exposure assessment section specifies warm-season ozone. COPD incidence is a morbidity outcome, but this paper does not examine mortality; page numbers are unavailable in our copy. (LLM, conf=0.88)
- Partly supportedcites [87] Wolf, K., Hoffmann, B., Andersen, Z. J., Atkinson, R. W., Bauwelinck, M., Bellander, T., Brandt, J., Brunekreef, B., Cesaroni, G., Chen, J., de Faire, U., de Hoogh, K., Fecht, D., Forastiere, F., Gulliver, J., Hertel, O., Hvidtfeldt, U. A., Janssen, N. A. H., Jørgensen, J. T., Katsouyanni, K., et al. (2021). Long-term exposure to low-level ambient air pollution and incidence of stroke and coronary heart disease: A pooled analysis of six European cohorts within the ELAPSE project. Lancet Planet Health, 5(9), e620–e632. https://doi.org/10.1016/s2542-5196(21)00195-9 sourceExperimental — accuracy not yet measured
The Summary (p. 1) says this ELAPSE analysis examined long-term exposure to PM2.5, NO2, black carbon, and warm-season ozone in relation to stroke and coronary heart disease incidence. These are morbidity outcomes; the paper does not report an analysis of mortality, so it does not support that part of the attributed claim. (LLM, conf=0.88)
- Partly supportedcites [88] Chen, J., Rodopoulou, S., Strak, M., de Hoogh, K., Taj, T., Poulsen, A. H., Andersen, Z. J., Bellander, T., Brandt, J., Zitt, E., Fecht, D., Forastiere, F., Gulliver, J., Hertel, O., Hoffmann, B., Hvidtfeldt, U. A., Verschuren, W. M. M., Jørgensen, J. T., Katsouyanni, K., Ketzel, M., et al. (2022). Long-term exposure to ambient air pollution and bladder cancer incidence in a pooled European cohort: The ELAPSE project. British Journal of Cancer. https://doi.org/10.1038/s41416-022-01735-4 sourceExperimental — accuracy not yet measured
The ELAPSE project description and §2.2 Exposure assessment (page unavailable) show that this study examined bladder cancer incidence in relation to PM2.5, NO2, black carbon, and warm-season O3, as well as PM2.5 components. It therefore supports the morbidity and pollutant parts of the collective claim, but this paper did not itself examine mortality. (LLM, conf=0.86)
- Partly supportedcites [89] Samoli, E., Rodopoulou, S., Hvidtfeldt, U. A., Wolf, K., Stafoggia, M., Brunekreef, B., Strak, M., Chen, J., Andersen, Z. J., Atkinson, R., Bauwelinck, M., Bellander, T., Brandt, J., Cesaroni, G., Forastiere, F., Fecht, D., Gulliver, J., Hertel, O., Hoffmann, B., de Hoogh, K., et al. (2021). Modeling multi-level survival data in multi-center epidemiological cohort studies: Applications from the ELAPSE project. Environment International, 147, 106371. https://doi.org/10.1016/j.envint.2020.106371 sourceExperimental — accuracy not yet measured
The Introduction describes ELAPSE as investigating health outcomes after exposure to low levels of air pollution. The exposure-assessment passage lists PM2.5, NO2, ozone and black carbon, but says this paper focuses on PM2.5 and NO2; it does not specify warm-season ozone or report mortality and morbidity analyses for all four pollutants. (LLM, conf=0.85)
- Partly supportedcites [90] Stafoggia, M., Oftedal, B., Chen, J., Rodopoulou, S., Renzi, M., Atkinson, R. W., Bauwelinck, M., Klompmaker, J. O., Mehta, A., Vienneau, D., Andersen, Z. J., Bellander, T., Brandt, J., Cesaroni, G., de Hoogh, K., Fecht, D., Gulliver, J., Hertel, O., Hoffmann, B., Hvidtfeldt, U. A., et al. (2022). Long-term exposure to low ambient air pollution concentrations and mortality among 28 million people: Results from seven large European cohorts within the ELAPSE project. Lancet Planet Health, 6(1), e9–e18. https://doi.org/10.1016/s2542-5196(21)00277-1 sourceExperimental — accuracy not yet measured
The Introduction identifies PM2.5, NO2, black carbon, and warm-season O3 as the four pollutants studied at low exposure levels. The Introduction and Results address mortality outcomes, but this paper does not examine morbidity outcomes, so it supports only that part of the citing sentence. (LLM, conf=0.86)
- Partly supportedcites [91] Strak, M., Weinmayr, G., Rodopoulou, S., Chen, J., de Hoogh, K., Andersen, Z. J., Atkinson, R., Bauwelinck, M., Bekkevold, T., Bellander, T., Boutron-Ruault, M. C., Brandt, J., Cesaroni, G., Concin, H., Fecht, D., Forastiere, F., Gulliver, J., Hertel, O., Hoffmann, B., Hvidtfeldt, U. A., et al. (2021). Long term exposure to low level air pollution and mortality in eight European cohorts within the ELAPSE project: Pooled analysis. British Medical Journal, 374, n1904. https://doi.org/10.1136/bmj.n1904 sourceExperimental — accuracy not yet measured
The Introduction says this ELAPSE analysis investigated low-level exposure to PM2.5, nitrogen dioxide, ozone, and black carbon, and the Methods specify warm-season ozone. But the Methods (Mortality data) and Abstract (Main outcome measures) identify mortality as the outcome; this paper does not report an analysis of morbidity. (LLM, conf=0.88)
- Not checked yetcites [92] Rodopoulou, S., Stafoggia, M., Chen, J., de Hoogh, K., Bauwelinck, M., Mehta, A. J., Klompmaker, J. O., Oftedal, B., Vienneau, D., Janssen, N. A. H., Strak, M., Andersen, Z. J., Renzi, M., Cesaroni, G., Nordheim, C. F., Bekkevold, T., Atkinson, R., Forastiere, F., Katsouyanni, K., Brunekreef, B., et al. (2022). Long-term exposure to fine particle elemental components and mortality in Europe: Results from six European administrative cohorts within the ELAPSE project. Science of the Total Environment, 809, 152205. https://doi.org/10.1016/j.scitotenv.2021.152205 source
- Partly supportedcites [93] Chen, J., Rodopoulou, S., de Hoogh, K., Strak, M., Andersen, Z. J., Atkinson, R., Bauwelinck, M., Bellander, T., Brandt, J., Cesaroni, G., Concin, H., Fecht, D., Forastiere, F., Gulliver, J., Hertel, O., Hoffmann, B., Hvidtfeldt, U. A., Janssen, N. A. H., Jöckel, K. H., Jørgensen, J., et al. (2021). Long-term exposure to fine particle elemental components and natural and cause-specific mortality—A pooled analysis of eight european cohorts within the ELAPSE Project. Environmental Health Perspectives, 129(4), 47009. https://doi.org/10.1289/ehp8368 sourceExperimental — accuracy not yet measured
The Introduction (page not provided) identifies this paper as part of ELAPSE, describes its low-level air-pollution focus, and states that it investigates PM2.5 components and mortality. The Methods assess PM2.5 and NO2 exposure and mention black-carbon exposure models, but the passages do not establish the claimed morbidity research or investigation of warm-season ozone. (LLM, conf=0.86)
- Partly supportedcites [94] So, R., Chen, J., Mehta, A. J., Liu, S., Strak, M., Wolf, K., Hvidtfeldt, U. A., Rodopoulou, S., Stafoggia, M., Klompmaker, J. O., Samoli, E., Raaschou-Nielsen, O., Atkinson, R., Bauwelinck, M., Bellander, T., Boutron-Ruault, M. C., Brandt, J., Brunekreef, B., Cesaroni, G., Concin, H., et al. (2021). Long-term exposure to air pollution and liver cancer incidence in six European cohorts. International Journal of Cancer, 149(11), 1887–1897. https://doi.org/10.1002/ijc.33743 sourceExperimental — accuracy not yet measured
The Introduction identifies this as an ELAPSE study of air pollution and liver cancer incidence, and Section 2.3 lists all four pollutants, including warm-season ozone, in its exposure assessment. The Abstract says the study examined liver cancer incidence at concentrations below current EU standards; it does not report mortality effects, so that part of the sentence is not supported by this source. (LLM, conf=0.85)
plainstates an association- Asserted: passes — The authors put it forward as true.
- Checkable: passes — It can be checked against evidence.
- Load-bearing: unclear — It is unclear whether the paper’s conclusions depend on it.
- Based: passes — The paper gives a reason why it holds.
Every source the paper cites for this claim was checked and supports it.
In the paper
“Per IQR increase in the 5-year average PM2.5 (3.2 µg m−3) and NO2 (22 µg m−3), they found an association with the development of dementia HR = 1.060 (95% CI 1.054–1.066)”
§ Changes in tropospheric air quality related to the protection of stratospheric ozone in a changing climate > UV-dependent air pollutants and their effects on human health, plants, and the self-cleaning capacity of the troposphere > Health impacts of photochemical smog
What the sources say
- Supportedcites [115] Shi, L., Steenland, K., Li, H., Liu, P., Zhang, Y., Lyles, R. H., Requia, W. J., Ilango, S. D., Chang, H. H., Wingo, T., Weber, R. J., & Schwartz, J. (2021). A national cohort study (2000–2018) of long-term air pollution exposure and incident dementia in older adults in the United States. Nature Communications, 12(1), 6754. https://doi.org/10.1038/s41467-021-27049-2 source
The Abstract in our copy reports approximately 2.0 million incident dementia cases in a US Medicare cohort and gives an HR of 1.060 (95% CI 1.054–1.066) per IQR increase in 5-year average PM2.5 (3.2 µg/m³). The Results (Health effect estimates) likewise report an increased dementia risk, though the single-pollutant estimate there is 1.061. (LLM, conf=0.94)
plainstates an association- Asserted: passes — The authors put it forward as true.
- Checkable: passes — It can be checked against evidence.
- Load-bearing: unclear — It is unclear whether the paper’s conclusions depend on it.
- Based: passes — The paper gives a reason why it holds.
- Supported
Every source the paper cites for this claim was checked and supports it.
In the paper
“The interaction of temperature with PM10 was significant for cardiovascular causes of death for all ages (2.24% on days with low PM10 (95% CI 1.01–3.47), while it was 2.63% (95% CI 1.57–3.71) on days with high PM10.”
§ Changes in tropospheric air quality related to the protection of stratospheric ozone in a changing climate > UV-dependent air pollutants and their effects on human health, plants, and the self-cleaning capacity of the troposphere > Health impacts of photochemical smog
What the sources say
- Supportedcites [107] Analitis, A., De’ Donato, F., Scortichini, M., Lanki, T., Basagana, X., Ballester, F., Astrom, C., Paldy, A., Pascal, M., Gasparrini, A., Michelozzi, P., & Katsouyanni, K. (2018). Synergistic effects of ambient temperature and air pollution on health in Europe: Results from the PHASE Project. International Journal of Environmental Research and Public Health. https://doi.org/10.3390/ijerph15091856 source
The Results (Section 3) report a significant interaction between maximum apparent temperature and PM10 for cardiovascular deaths at all ages. They give the cited 2.24% increase on low-PM10 days (95% CI 1.01–3.47) and 2.63% on high-PM10 days (95% CI 1.57–3.71). (LLM, conf=0.95)
plainstates an association- Asserted: passes — The authors put it forward as true.
- Checkable: passes — It can be checked against evidence.
- Load-bearing: unclear — It is unclear whether the paper’s conclusions depend on it.
- Based: passes — The paper gives a reason why it holds.
- Supported
Every source the paper cites for this claim was checked and supports it.
In the paper
“Leaf-area was reduced by 21%, biomass of leaves by 14%, shoots by 23%, and roots by 17% [118].”
§ Changes in tropospheric air quality related to the protection of stratospheric ozone in a changing climate > UV-dependent air pollutants and their effects on human health, plants, and the self-cleaning capacity of the troposphere > Effects of tropospheric ozone and particulates on plants
What the sources say
- Supportedcites [118] Li, C., Gu, X., Wu, Z., Qin, T., Guo, L., Wang, T., Zhang, L., & Jiang, G. (2021). Assessing the effects of elevated ozone on physiology, growth, yield and quality of soybean in the past 40 years: A meta-analysis. Ecotoxicology and Environmental Safety, 208, 111644. https://doi.org/10.1016/j.ecoenv.2020.111644 source
Section 3.1 reports that elevated ozone reduced the dry weight of soybean leaves by 13.8% relative to charcoal-filtered air. Rounding to 14% supports the attributed claim. (LLM, conf=0.95)
plainstates a cause- Asserted: passes — The authors put it forward as true.
- Checkable: passes — It can be checked against evidence.
- Load-bearing: unclear — It is unclear whether the paper’s conclusions depend on it.
- Based: passes — The paper gives a reason why it holds.
- Supported
Every source the paper cites for this claim was checked and supports it.
In the paper
“Leaf-area was reduced by 21%, biomass of leaves by 14%, shoots by 23%, and roots by 17% [118].”
§ Changes in tropospheric air quality related to the protection of stratospheric ozone in a changing climate > UV-dependent air pollutants and their effects on human health, plants, and the self-cleaning capacity of the troposphere > Effects of tropospheric ozone and particulates on plants
What the sources say
- Supportedcites [118] Li, C., Gu, X., Wu, Z., Qin, T., Guo, L., Wang, T., Zhang, L., & Jiang, G. (2021). Assessing the effects of elevated ozone on physiology, growth, yield and quality of soybean in the past 40 years: A meta-analysis. Ecotoxicology and Environmental Safety, 208, 111644. https://doi.org/10.1016/j.ecoenv.2020.111644 source
Section 3.1 reports a 20.8% reduction in soybean leaf area under elevated ozone compared with charcoal-filtered air, which rounds to 21%. The same section reports reductions of 13.8%, 22.8%, and 16.9% for leaf, shoot, and root dry weight, matching the other rounded figures in the citing sentence. (LLM, conf=0.95)
plainstates a cause- Asserted: passes — The authors put it forward as true.
- Checkable: passes — It can be checked against evidence.
- Load-bearing: unclear — It is unclear whether the paper’s conclusions depend on it.
- Based: passes — The paper gives a reason why it holds.
- Supported
Every source the paper cites for this claim was checked and supports it.
In the paper
“Effects of ozone on plants are mediated by the formation of free radicals in the tissues of the plants.”
§ Changes in tropospheric air quality related to the protection of stratospheric ozone in a changing climate > UV-dependent air pollutants and their effects on human health, plants, and the self-cleaning capacity of the troposphere > Effects of tropospheric ozone and particulates on plants
What the sources say
- Supportedcites [131] Oksanen, E., & Kontunen-Soppela, S. (2021). Plants have different strategies to defend against air pollutants. Current Opinion in Environmental Science & Health, 19, 100222. https://doi.org/10.1016/j.coesh.2020.10.010 source
Section 1.2, “Defense mechanisms against air pollutants” (page not available), says that oxidative air pollutants entering leaves trigger a burst of reactive oxygen species, including free radicals. The same section identifies ozone exposure as an approach used to study oxidative stress in plants, supporting the claimed mechanism. (LLM, conf=0.90)
plainstates a cause- Asserted: passes — The authors put it forward as true.
- Checkable: passes — It can be checked against evidence.
- Load-bearing: unclear — It is unclear whether the paper’s conclusions depend on it.
- Based: passes — The paper gives a reason why it holds.
- Supported
The cited sources support only part of this claim — read each source’s verdict below.
In the paper
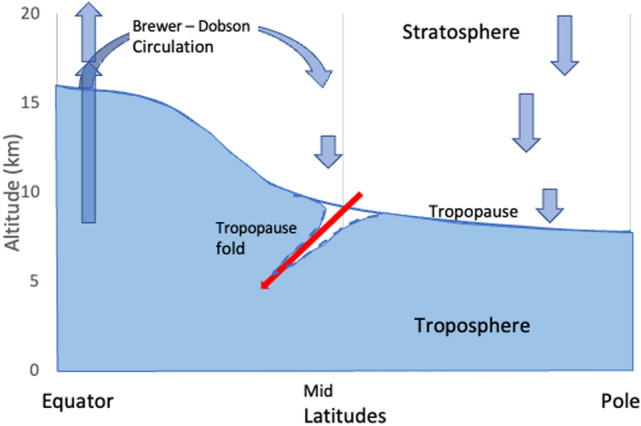
“Folds in the tropopause have a direct impact on air quality at ground level.”
§ Changes in tropospheric air quality related to the protection of stratospheric ozone in a changing climate > UV-dependent air pollutants and their effects on human health, plants, and the self-cleaning capacity of the troposphere > Changes in atmospheric circulation and transport of pollutants
What the sources say
- Not checked yetcites [162] Akritidis, D., Pozzer, A., Flemming, J., Inness, A., & Zanis, P. (2021). A global climatology of tropopause folds in CAMS and MERRA-2 reanalyses. Journal of Geophysical Research: Atmospheres, 126(8), e2020JD034115. https://doi.org/10.1029/2020JD034115 source
- Partly supportedcites [163] Liu, J. H., Rodriguez, J. M., Oman, L. D., Douglass, A. R., Olsen, M. A., & Hu, L. (2020). Stratospheric impact on the Northern Hemisphere winter and spring ozone interannual variability in the troposphere. Atmospheric Chemistry and Physics, 20(11), 6416–6432. https://doi.org/10.5194/acp-20-6417-2020 sourceExperimental — accuracy not yet measured
The Conclusions and discussion link stratospheric folds near jet streams to a stronger stratospheric influence on tropospheric ozone, and Results §3.1 notes that stratospheric ozone can contribute to surface ozone in spring. But the paper does not establish a direct impact of tropopause folds themselves on ground-level air quality; its own analysis focuses on ozone in the troposphere. (LLM, conf=0.83)
plainstates a cause- Asserted: passes — The authors put it forward as true.
- Checkable: passes — It can be checked against evidence.
- Load-bearing: passes — The paper’s conclusions depend on it.
- Based: passes — The paper gives a reason why it holds.
- It may state two separate claims as one. 138
- Probably not a substantial claim. 80
- The quote only partly states this claim. 3
The cited sources support only part of this claim — read each source’s verdict below.
In the paper
“Simulations with numerical models show several possible reasons including increases in UV radiation [31, 33–39], shifts in the VOC/NOx chemical regime resulting in increased production of O3 efficiency [35, 40], higher emissions of biogenic VOC due to rising temperatures [30], and decreased competition for gas-phase radicals by aerosol surfaces [34, 40], with reality likely being a combination of”
§ Changes in tropospheric air quality related to the protection of stratospheric ozone in a changing climate > UV-dependent air pollutants and their effects on human health, plants, and the self-cleaning capacity of the troposphere > UV radiation and ground-level ozone
What the sources say
- Supportedcites [31] Wang, W., Li, X., Shao, M., Hu, M., Zeng, L., Wu, Y., & Tan, T. (2019). The impact of aerosols on photolysis frequencies and ozone production in Beijing during the 4-year period 2012–2015. Atmospheric Chemistry and Physics, 19(14), 9413–9429. https://doi.org/10.5194/acp-19-9413-2019 source
Split into 2 atoms — 2 confirmed, 0 partially supported, 0 disputed, 0 misattributed, 0 unverifiable. Expand the claim to see per-atom verdicts.
- Partly supportedcites [33] Wu, J., Bei, N., Hu, B., Liu, S., Wang, Y., Shen, Z., Li, X., Liu, L., Wang, R., Liu, Z., Cao, J., Tie, X., Molina, L. T., & Li, G. (2020). Aerosol-photolysis interaction reduces particulate matter during wintertime haze events. Proceedings of the National Academy of Sciences of the United States of America, 117(18), 9755–9761. https://doi.org/10.1073/pnas.1916775117 sourceExperimental — accuracy not yet measured
Split into 2 atoms — 1 confirmed, 1 partially supported, 0 disputed, 0 misattributed, 0 unverifiable. Expand the claim to see per-atom verdicts.
- Partly supportedcites [34] Li, K., Jacob, D. J., Liao, H., Shen, L., Zhang, Q., & Bates, K. H. (2019). Anthropogenic drivers of 2013–2017 trends in summer surface ozone in China. Proceedings of the National Academy of Sciences of the United States of America, 116(2), 422–427. https://doi.org/10.1073/pnas.1812168116 sourceExperimental — accuracy not yet measured
Split into 2 atoms — 1 confirmed, 1 partially supported, 0 disputed, 0 misattributed, 0 unverifiable. Expand the claim to see per-atom verdicts.
- Supportedcites [35] Liu, Y., & Wang, T. (2020). Worsening urban ozone pollution in China from 2013 to 2017 – Part 2: The effects of emission changes and implications for multi-pollutant control. Atmospheric Chemistry and Physics, 20(11), 6323–6337. https://doi.org/10.5194/acp-20-6323-2020 source
Split into 2 atoms — 2 confirmed, 0 partially supported, 0 disputed, 0 misattributed, 0 unverifiable. Expand the claim to see per-atom verdicts.
- Partly supportedcites [36] Hollaway, M., Wild, O., Yang, T., Sun, Y., Xu, W., Xie, C., Whalley, L., Slater, E., Heard, D., & Liu, D. (2019). Photochemical impacts of haze pollution in an urban environment. Atmospheric Chemistry and Physics, 19(15), 9699–9714. https://doi.org/10.5194/acp-19-9699-2019 sourceExperimental — accuracy not yet measured
Split into 2 atoms — 0 confirmed, 2 partially supported, 0 disputed, 0 misattributed, 0 unverifiable. Expand the claim to see per-atom verdicts.
- Not checked yetcites [37] Tian, R., Ma, X., Jia, H., Yu, F., Sha, T., & Zan, Y. (2019). Aerosol radiative effects on tropospheric photochemistry with GEOS-Chem simulations. Atmospheric Environment, 208, 82–94. https://doi.org/10.1016/j.atmosenv.2019.03.032 source
- Partly supportedcites [38] Gao, J., Li, Y., Zhu, B., Hu, B., Wang, L., & Bao, F. (2020). What have we missed when studying the impact of aerosols on surface ozone via changing photolysis rates? Atmospheric Chemistry and Physics, 20, 10831–10844. https://doi.org/10.5194/acp-2020-140 sourceExperimental — accuracy not yet measured
Split into 2 atoms — 0 confirmed, 2 partially supported, 0 disputed, 0 misattributed, 0 unverifiable. Expand the claim to see per-atom verdicts.
- Not checked yetcites [39] Gao, J., Li, Y., Xie, Z., Hu, B., Wang, L., Bao, F., & Fan, S. (2022). The impact of the aerosol reduction on the worsening ozone pollution over the Beijing-Tianjin-Hebei region via influencing photolysis rates. Science of the Total Environment. https://doi.org/10.1016/j.scitotenv.2022.153197 source
- Partly supportedcites [40] Ma, X., Huang, J., Zhao, T., Liu, C., Zhao, K., Xing, J., & Xiao, W. (2020). Rapid increase in summer surface ozone over the North China Plain during 2013–2019: A side effect of particulate matters reduction control? Atmospheric Chemistry and Physics. https://doi.org/10.5194/acp-2020-385 sourceExperimental — accuracy not yet measured
Split into 2 atoms — 1 confirmed, 1 partially supported, 0 disputed, 0 misattributed, 0 unverifiable. Expand the claim to see per-atom verdicts.
hedgedstates a cause- Asserted: passes — The authors put it forward as true.
- Checkable: passes — It can be checked against evidence.
- Load-bearing: passes — The paper’s conclusions depend on it.
- Based: passes — The paper gives a reason why it holds.
It may state two separate claims as one.
- Supported
The cited sources support only part of this claim — read each source’s verdict below.
In the paper
“There is also growing evidence that exposure to air pollutants maybe detrimental to the central nervous system and contribute to deficits in cognitive development, neurodegenerative diseases and dementia [112, 113].”
§ Changes in tropospheric air quality related to the protection of stratospheric ozone in a changing climate > UV-dependent air pollutants and their effects on human health, plants, and the self-cleaning capacity of the troposphere > Health impacts of photochemical smog
What the sources say
- Not checked yetcites [112] Tham, R., & Schikowski, T. (2021). The role of traffic-related air pollution on neurodegenerative diseases in older people: An epidemiological perspective. Journal of Alzheimer’s Disease, 79(3), 949–959. https://doi.org/10.3233/jad-200813 source
- Partly supportedcites [113] Weuve, J., Bennett, E. E., Ranker, L., Gianattasio, K. Z., Pedde, M., Adar, S. D., Yanosky, J. D., & Power, M. C. (2021). Exposure to air pollution in relation to risk of dementia and related outcomes: An updated systematic review of the epidemiological literature. Environmental Health Perspectives, 129(9), 96001. https://doi.org/10.1289/EHP8716 sourceExperimental — accuracy not yet measured
The Introduction and Conclusions describe growing evidence that air pollution may affect late-life cognitive health and dementia-related outcomes. The review does not establish deficits in cognitive development or address neurodegenerative diseases broadly; it notes that other reviews extended to additional neurodegenerative conditions. No page numbers were provided for these passages. (LLM, conf=0.88)
hedgedstates a possible cause- Asserted: passes — The authors put it forward as true.
- Checkable: passes — It can be checked against evidence.
- Load-bearing: fails — The paper’s conclusions may not depend on it.
- Based: passes — The paper gives a reason why it holds.
Probably not a substantial claim. The paper’s conclusions may not depend on it. It may state two separate claims as one.
The cited sources support only part of this claim — read each source’s verdict below.
In the paper
“Accordingly, people with cardiovascular diseases are more likely to suffer a heart attack, stroke, or death when exposed to air pollution [109].”
§ Changes in tropospheric air quality related to the protection of stratospheric ozone in a changing climate > UV-dependent air pollutants and their effects on human health, plants, and the self-cleaning capacity of the troposphere > Health impacts of photochemical smog
What the sources say
- Partly supportedcites [109] Rajagopalan, S., Al-Kindi, S. G., & Brook, R. D. (2018). Air pollution and cardiovascular disease: JACC state-of-the-art review. Journal of the American College of Cardiologists, 72(17), 2054–2070. https://doi.org/10.1016/j.jacc.2018.07.099 sourceExperimental — accuracy not yet measured
The Myocardial Infarction section says patients with underlying coronary artery disease may be at particularly high risk of an acute coronary event during PM2.5 exposure, and that long-term survival after acute coronary syndrome is reduced by long-term exposure. The Cerebrovascular Disease section links air pollution to stroke and stroke mortality, but does not establish that people with pre-existing cardiovascular disease specifically have a higher stroke risk. (LLM, conf=0.86)
hedgedstates a possible cause- Asserted: passes — The authors put it forward as true.
- Checkable: passes — It can be checked against evidence.
- Load-bearing: fails — The paper’s conclusions may not depend on it.
- Based: passes — The paper gives a reason why it holds.
Probably not a substantial claim. The paper’s conclusions may not depend on it.
- Partly supported
The cited sources support only part of this claim — read each source’s verdict below.
In the paper
“Episodes of air pollution frequently occur in combination with extremes in temperature with synergistic effects on health depending on the pollutant(s) involved, the degree and direction of temperature change, and the characteristics of the geographic area and the populations affected.”
§ Changes in tropospheric air quality related to the protection of stratospheric ozone in a changing climate > UV-dependent air pollutants and their effects on human health, plants, and the self-cleaning capacity of the troposphere > Health impacts of photochemical smog
What the sources say
- Could not verifycites [98] Chersich, M. F., Pham, M. D., Areal, A., Haghighi, M. M., Manyuchi, A., Swift, C. P., Wernecke, B., Robinson, M., Hetem, R., Boeckmann, M., Hajat, S., Nakstad, B., Wright, C. Y., Harvey, C., Wang, C., Durusu, D., Scorgie, F., Rees, H., Harden, L., Roos, N., et al. (2020). Associations between high temperatures in pregnancy and risk of preterm birth, low birth weight, and stillbirths: Systematic review and meta-analysis. British Medical Journal, 371, m3811. https://doi.org/10.1136/bmj.m3811 sourceExperimental — accuracy not yet measured
Split into 2 atoms — 0 confirmed, 0 partially supported, 0 disputed, 0 misattributed, 2 unverifiable. Expand the claim to see per-atom verdicts.
- Could not verifycites [99] Liu, Z., Meng, Y., Xiang, H., Lu, Y., & Liu, S. (2020). Association of short-term exposure to meteorological factors and risk of hand, foot, and mouth disease: A systematic review and meta-analysis. International Journal of Environmental Research and Public Health. https://doi.org/10.3390/ijerph17218017 sourceExperimental — accuracy not yet measured
Split into 2 atoms — 0 confirmed, 0 partially supported, 0 disputed, 0 misattributed, 2 unverifiable. Expand the claim to see per-atom verdicts.
- Partly supportedcites [100] Moghadamnia, M. T., Ardalan, A., Mesdaghinia, A., Keshtkar, A., Naddafi, K., & Yekaninejad, M. S. (2017). Ambient temperature and cardiovascular mortality: A systematic review and meta-analysis. PeerJ. https://doi.org/10.7717/peerj.3574 sourceExperimental — accuracy not yet measured
Split into 2 atoms — 0 confirmed, 1 partially supported, 0 disputed, 0 misattributed, 1 unverifiable. Expand the claim to see per-atom verdicts.
- Could not verifycites [101] Gronlund, C. J., Sullivan, K. P., Kefelegn, Y., Cameron, L., & O’Neill, M. S. (2018). Climate change and temperature extremes: A review of heat- and cold-related morbidity and mortality concerns of municipalities. Maturitas, 114, 54–59. https://doi.org/10.1016/j.maturitas.2018.06.002 sourceExperimental — accuracy not yet measured
Split into 2 atoms — 0 confirmed, 0 partially supported, 0 disputed, 0 misattributed, 2 unverifiable. Expand the claim to see per-atom verdicts.
- Partly supportedcites [102] Ryti, N. R., Guo, Y., & Jaakkola, J. J. (2016). Global association of cold spells and adverse health effects: A systematic review and meta-analysis. Environmental Health Perspectives, 124(1), 12–22. https://doi.org/10.1289/ehp.1408104 sourceExperimental — accuracy not yet measured
Split into 2 atoms — 0 confirmed, 1 partially supported, 0 disputed, 0 misattributed, 1 unverifiable. Expand the claim to see per-atom verdicts.
- Could not verifycites [103] Sharpe, I., & Davison, C. M. (2022). A scoping review of climate change, climate-related disasters, and mental disorders among children in low- and middle-income countries. International Journal of Environmental Research and Public Health. https://doi.org/10.3390/ijerph19052896 sourceExperimental — accuracy not yet measured
Split into 2 atoms — 0 confirmed, 0 partially supported, 0 disputed, 0 misattributed, 2 unverifiable. Expand the claim to see per-atom verdicts.
- Could not verifycites [104] Syed, S., O’Sullivan, T. L., & Phillips, K. P. (2022). Extreme heat and pregnancy outcomes: A scoping review of the epidemiological evidence. International Journal of Environmental Research and Public Health. https://doi.org/10.3390/ijerph19042412 sourceExperimental — accuracy not yet measured
Split into 2 atoms — 0 confirmed, 0 partially supported, 0 disputed, 0 misattributed, 2 unverifiable. Expand the claim to see per-atom verdicts.
- Could not verifycites [105] Vu, A., Rutherford, S., & Phung, D. (2019). Heat health prevention measures and adaptation in older populations—A systematic review. International Jorunal of Environmental Research and Public Health. https://doi.org/10.3390/ijerph16224370 sourceExperimental — accuracy not yet measured
Split into 2 atoms — 0 confirmed, 0 partially supported, 0 disputed, 0 misattributed, 2 unverifiable. Expand the claim to see per-atom verdicts.
- Could not verifycites [106] Zanobetti, A., & O’Neill, M. S. (2018). Longer-term outdoor temperatures and health effects: A review. Current Epidemiology Reports, 5(2), 125–139. https://doi.org/10.1007/s40471-018-0150-3 sourceExperimental — accuracy not yet measured
Split into 2 atoms — 0 confirmed, 0 partially supported, 0 disputed, 0 misattributed, 2 unverifiable. Expand the claim to see per-atom verdicts.
plainstates an association- Asserted: passes — The authors put it forward as true.
- Checkable: passes — It can be checked against evidence.
- Load-bearing: unclear — It is unclear whether the paper’s conclusions depend on it.
- Based: passes — The paper gives a reason why it holds.
It may state two separate claims as one.
- Could not verify
Every source the paper cites for this claim was checked and supports it.
In the paper
“Also, physiological responses to damage from O3 might alter the ratios of pigments in plants, the phenology (seasonal development) of flowers and whole plants [136], or the time of flowering, thus affecting host recognition and pollinators.”
§ Changes in tropospheric air quality related to the protection of stratospheric ozone in a changing climate > UV-dependent air pollutants and their effects on human health, plants, and the self-cleaning capacity of the troposphere > Effects of tropospheric ozone and particulates on plants
What the sources say
- Supportedcites [136] Duque, L., Poelman, E. H., & Steffan-Dewenter, I. (2021). Effects of ozone stress on flowering phenology, plant-pollinator interactions and plant reproductive success. Environmental Pollution, 272, 115953. https://doi.org/10.1016/j.envpol.2020.115953 source
The citation is attached to the claim about phenology. The Results report that ozone accelerated flowering onset in the autumn experiments, and the Abstract describes ozone-exposed plants’ phenological development and a tendency toward reduced vegetative growth. The Discussion explains how a shift in flowering time might affect pollinators. (LLM, conf=0.88)
hedgedstates a possible cause- Asserted: passes — The authors put it forward as true.
- Checkable: passes — It can be checked against evidence.
- Load-bearing: unclear — It is unclear whether the paper’s conclusions depend on it.
- Based: passes — The paper gives a reason why it holds.
It may state two separate claims as one.
- Supported
Every source the paper cites for this claim was checked and supports it.
In the paper
“Global emissions of NOx peaked around 2012, followed by reductions [143].”
§ Changes in tropospheric air quality related to the protection of stratospheric ozone in a changing climate > UV-dependent air pollutants and their effects on human health, plants, and the self-cleaning capacity of the troposphere > Self-cleaning capacity of the atmosphere
What the sources say
- Supportedcites [143] McDuffie, E. E., Smith, S. J., O’Rourke, P., Tibrewal, K., Venkataraman, C., Marais, E. A., Zheng, B., Crippa, M., Brauer, M., & Martin, R. V. (2020). A global anthropogenic emission inventory of atmospheric pollutants from sector- And fuel-specific sources (1970–2017): An application of the Community Emissions Data System (CEDS). Earth System Science Data, 12(4), 3413–3442. https://doi.org/10.5194/essd-12-3413-2020 source
Section 3.2, “Historical trends in annual global emissions,” states that global NOx emissions peaked between 2011 and 2013 and then decreased by 7% by 2017. That supports the claim’s approximate peak year and subsequent reductions. (LLM, conf=0.95)
plain- Asserted: passes — The authors put it forward as true.
- Checkable: passes — It can be checked against evidence.
- Load-bearing: unclear — It is unclear whether the paper’s conclusions depend on it.
- Based: passes — The paper gives a reason why it holds.
It may state two separate claims as one.
- Supported
In the paper
“Over the past few decades, concentrations of O3 at ground-level and in the lower atmosphere have been generally decreasing in most developed countries, while increasing greatly in some locations including East and South Asia, in response to changes in emissions of NOx and VOCs.”
§ Changes in tropospheric air quality related to the protection of stratospheric ozone in a changing climate > UV-dependent air pollutants and their effects on human health, plants, and the self-cleaning capacity of the troposphere > UV radiation and ground-level ozone
What the sources say
- Not checked yetcites [11] Szopa, S., Naik, V., Adhikary, B., Artaxo, P., Berntsen, T., Collins, W. D., Fuzzi, S., Gallardo, L., Scharr, A. K., Klimont, Z., Liao, H., Unger, N., & Zanis, P. (2021). Short-lived climate forcers. In V. Masson-Delmotte, P. Zhai, A. Pirani, S. L. Connors, C. Péan, S. Berger, N. Caud, Y. Chen, L. Goldfarb, M. I. Gomis, M. Huang, K. Leitzell, E. Lonnoy, J. B. R. Matthews, T. K. Maycock, T. Waterfield, O. Yelekçi, R. Yu, & B. Zhou (Eds.), Climate Change 2021: The physical science basis. Contribution of Working Group I to the Sixth Assessment Report of the Intergovernmental Panel on Climate Chan
plainstates a cause- Asserted: passes — The authors put it forward as true.
- Checkable: passes — It can be checked against evidence.
- Load-bearing: unclear — It is unclear whether the paper’s conclusions depend on it.
- Based: passes — The paper gives a reason why it holds.
It may state two separate claims as one.
In the paper
“For example, increasing trends in UV radiation over 1996–2016 were found [41] for stations in Japan and Greece, and were attributed to reductions in absorbing aerosols.”
§ Changes in tropospheric air quality related to the protection of stratospheric ozone in a changing climate > UV-dependent air pollutants and their effects on human health, plants, and the self-cleaning capacity of the troposphere > UV radiation and ground-level ozone
What the sources say
- Not checked yetcites [41] Fountoulakis, I., Zerefos, C. S., Bais, A. F., Kapsomenakis, J., Koukouli, M.-E., Ohkawara, N., Fioletov, V., De Backer, H., Lakkala, K., Karppinen, T., & Webb, A. R. (2018). Twenty-five years of spectral UV-B measurements over Canada, Europe and Japan: Trends and effects from changes in ozone, aerosols, clouds, and surface reflectivity. Comptes Rendus de l’Academie d’Geoscience de France, 350(7), 393–402. https://doi.org/10.1016/j.crte.2018.07.011 source
plainstates a cause- Asserted: passes — The authors put it forward as true.
- Checkable: passes — It can be checked against evidence.
- Load-bearing: unclear — It is unclear whether the paper’s conclusions depend on it.
- Based: passes — The paper gives a reason why it holds.
It may state two separate claims as one.
None of the sources cited for this claim have been checked yet.
In the paper
“This has led to surface brightening (e.g., by 0.70–1.16 W m−2 year−1 in eastern China over 2014–2019) [29] but also to undesirable increases in ambient O3 [30–33] (e.g., by 2–6 µg m−3 year−1 in megacity clusters of Beijing and Shanghai over 2013–2017) [34].”
§ Changes in tropospheric air quality related to the protection of stratospheric ozone in a changing climate > UV-dependent air pollutants and their effects on human health, plants, and the self-cleaning capacity of the troposphere > UV radiation and ground-level ozone
What the sources say
- Not checked yetcites [29] Shi, H., Zhang, J., Zhao, B., Xia, X., Hu, B., Chen, H., Wei, J., Liu, M., Bian, Y., Fu, D., Gu, Y., & Liou, K.-N. (2021). Surface brightening in Eastern and Central China since the implementation of the Clean Air Action in 2013: Causes and implications. Geophysical Research Letters, 48(3), e2020GL091105. https://doi.org/10.1029/2020GL091105 source
- Not checked yetcites [30] Ma, M., Gao, Y., Wang, Y., Zhang, S., Leung, L. R., Liu, C., Wang, S., Zhao, B., Chang, X., Su, H., Zhang, T., Sheng, L., Yao, X., & Gao, H. (2019). Substantial ozone enhancement over the North China Plain from increased biogenic emissions due to heat waves and land cover in summer 2017. Atmospheric Chemistry and Physics, 19(19), 12195–12207. https://doi.org/10.5194/acp-19-12195-2019 source
- Not checked yetcites [31] Wang, W., Li, X., Shao, M., Hu, M., Zeng, L., Wu, Y., & Tan, T. (2019). The impact of aerosols on photolysis frequencies and ozone production in Beijing during the 4-year period 2012–2015. Atmospheric Chemistry and Physics, 19(14), 9413–9429. https://doi.org/10.5194/acp-19-9413-2019 source
- Not checked yetcites [32] Wang, Y., Gao, W., Wang, S., Song, T., Gong, Z., Ji, D., Wang, L., Liu, Z., Tang, G., Huo, Y., Tian, S., Li, J., Li, M., Yang, Y., Chu, B., Petaja, T., Kerminen, V. M., He, H., Hao, J., Kulmala, M., et al. (2020). Contrasting trends of PM2.5 and surface-ozone concentrations in China from 2013 to 2017. National Science Review, 7, 1331–1339. https://doi.org/10.1093/nsr/nwaa032 source
- Not checked yetcites [33] Wu, J., Bei, N., Hu, B., Liu, S., Wang, Y., Shen, Z., Li, X., Liu, L., Wang, R., Liu, Z., Cao, J., Tie, X., Molina, L. T., & Li, G. (2020). Aerosol-photolysis interaction reduces particulate matter during wintertime haze events. Proceedings of the National Academy of Sciences of the United States of America, 117(18), 9755–9761. https://doi.org/10.1073/pnas.1916775117 source
- Not checked yetcites [34] Li, K., Jacob, D. J., Liao, H., Shen, L., Zhang, Q., & Bates, K. H. (2019). Anthropogenic drivers of 2013–2017 trends in summer surface ozone in China. Proceedings of the National Academy of Sciences of the United States of America, 116(2), 422–427. https://doi.org/10.1073/pnas.1812168116 source
plainstates a cause- Asserted: passes — The authors put it forward as true.
- Checkable: passes — It can be checked against evidence.
- Load-bearing: passes — The paper’s conclusions depend on it.
- Based: passes — The paper gives a reason why it holds.
It may state two separate claims as one.
In the paper
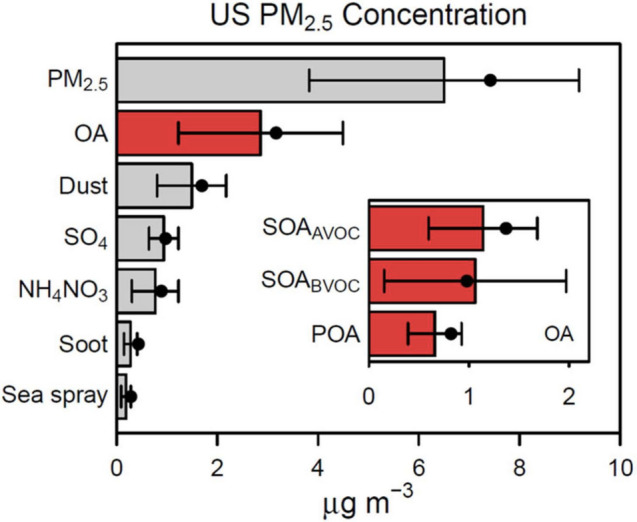
“For the contiguous United States (Fig. 4) modeling studies indicate that more than half of the PM2.5 is secondary in origin, and thus directly sensitive to variations in UV radiation [46].”
§ Changes in tropospheric air quality related to the protection of stratospheric ozone in a changing climate > UV-dependent air pollutants and their effects on human health, plants, and the self-cleaning capacity of the troposphere > UV radiation and particulate matter
What the sources say
- Not checked yetcites [46] Pye, H. O. T., Ward-Caviness, C. K., Murphy, B. N., Appel, K. W., & Seltzer, K. M. (2021). Secondary organic aerosol association with cardiorespiratory disease mortality in the United States. Nature Communications, 12(1), 7215. https://doi.org/10.1038/s41467-021-27484-1 source
hedgedstates a cause- Asserted: passes — The authors put it forward as true.
- Checkable: passes — It can be checked against evidence.
- Load-bearing: passes — The paper’s conclusions depend on it.
- Based: passes — The paper gives a reason why it holds.
It may state two separate claims as one.
In the paper
“An umbrella review (a review of systematic reviews and meta-analyses) [79] evaluated 548 meta-analyses derived from 75 systematic reviews on non-region-specific associations between outdoor air pollution and human health.”
§ Changes in tropospheric air quality related to the protection of stratospheric ozone in a changing climate > UV-dependent air pollutants and their effects on human health, plants, and the self-cleaning capacity of the troposphere > Health impacts of photochemical smog
What the sources say
- Not checked yetcites [79] Markozannes, G., Pantavou, K., Rizos, E. C., Sindosi, O., Tagkas, C., Seyfried, M., Saldanha, I. J., Hatzianastassiou, N., Nikolopoulos, G. K., & Ntzani, E. (2022). Outdoor air quality and human health: An overview of reviews of observational studies. Environmental Pollution, 306, 119309. https://doi.org/10.1016/j.envpol.2022.119309 source
plainstates an association- Asserted: passes — The authors put it forward as true.
- Checkable: passes — It can be checked against evidence.
- Load-bearing: fails — The paper’s conclusions may not depend on it.
- Based: passes — The paper gives a reason why it holds.
Probably not a substantial claim. The paper’s conclusions may not depend on it.
In the paper
“Of these meta-analyses, 57% (313) were not statistically significant.”
§ Changes in tropospheric air quality related to the protection of stratospheric ozone in a changing climate > UV-dependent air pollutants and their effects on human health, plants, and the self-cleaning capacity of the troposphere > Health impacts of photochemical smog
What the sources say
- Not checked yetcites [79] Markozannes, G., Pantavou, K., Rizos, E. C., Sindosi, O., Tagkas, C., Seyfried, M., Saldanha, I. J., Hatzianastassiou, N., Nikolopoulos, G. K., & Ntzani, E. (2022). Outdoor air quality and human health: An overview of reviews of observational studies. Environmental Pollution, 306, 119309. https://doi.org/10.1016/j.envpol.2022.119309 source
plain- Asserted: passes — The authors put it forward as true.
- Checkable: passes — It can be checked against evidence.
- Load-bearing: fails — The paper’s conclusions may not depend on it.
- Based: passes — The paper gives a reason why it holds.
Probably not a substantial claim. The paper’s conclusions may not depend on it.
In the paper
“These values are somewhat higher than the values reviewed in our previous assessment, which ranged from 1.75 to 4.3 million depending on year and source of estimates [6].”
§ Changes in tropospheric air quality related to the protection of stratospheric ozone in a changing climate > UV-dependent air pollutants and their effects on human health, plants, and the self-cleaning capacity of the troposphere > Health impacts of photochemical smog
What the sources say
- Not checked yetcites [6] Wilson, S. R., Madronich, S., Longstreth, J. D., & Solomon, K. R. (2019). Interactive effects of changing stratospheric ozone and climate on tropospheric composition and air quality, and the consequences for human and ecosystem health. Photochemical & Photobiological Sciences, 18, 775–803. https://doi.org/10.1039/c8pp90064g source
plain- Asserted: passes — The authors put it forward as true.
- Checkable: passes — It can be checked against evidence.
- Load-bearing: fails — The paper’s conclusions may not depend on it.
- Based: passes — The paper gives a reason why it holds.
Probably not a substantial claim. The paper’s conclusions may not depend on it.
In the paper
“They found a hazard ratio of 1.22 (95% CI 1.04–1.43) per 5 µg m−3 increase in PM2.5, 1.17 (95% CI 1.10–1.25) per 10 µg m−3 for NO2 and 1.15 (95% CI 1.08–1.23) per 0.5 × 10⁻⁵ m−1 for BC.”
§ Changes in tropospheric air quality related to the protection of stratospheric ozone in a changing climate > UV-dependent air pollutants and their effects on human health, plants, and the self-cleaning capacity of the troposphere > Health impacts of photochemical smog
What the sources say
- Not checked yetcites [95] Liu, S., Jørgensen, J. T., Ljungman, P., Pershagen, G., Bellander, T., Leander, K., Magnusson, P. K. E., Rizzuto, D., Hvidtfeldt, U. A., Raaschou-Nielsen, O., Wolf, K., Hoffmann, B., Brunekreef, B., Strak, M., Chen, J., Mehta, A., Atkinson, R. W., Bauwelinck, M., Varraso, R., Boutron-Ruault, M. C., et al. (2021). Long-term exposure to low-level air pollution and incidence of asthma: The ELAPSE project. European Respiratory Journal. https://doi.org/10.1183/13993003.03099-2020 source
plainstates an association- Asserted: passes — The authors put it forward as true.
- Checkable: passes — It can be checked against evidence.
- Load-bearing: unclear — It is unclear whether the paper’s conclusions depend on it.
- Based: passes — The paper gives a reason why it holds.
It may state two separate claims as one.
In the paper
“The combined Hazard Ratios (HRs) for natural-cause mortality were 1.08 (95% CI 1.06, 1.09) per 10 µg m−3 increase in PM2.5, and 1.04 (95% CI 1.03, 1.06) per 10 µg m−3 increase in PM10.”
§ Changes in tropospheric air quality related to the protection of stratospheric ozone in a changing climate > UV-dependent air pollutants and their effects on human health, plants, and the self-cleaning capacity of the troposphere > Health impacts of photochemical smog
What the sources say
- Not checked yetcites [96] Chen, J., & Hoek, G. (2020). Long-term exposure to PM and all-cause and cause-specific mortality: A systematic review and meta-analysis. Environment International, 143, 105974. https://doi.org/10.1016/j.envint.2020.105974 source
plainstates an association- Asserted: passes — The authors put it forward as true.
- Checkable: passes — It can be checked against evidence.
- Load-bearing: unclear — It is unclear whether the paper’s conclusions depend on it.
- Based: passes — The paper gives a reason why it holds.
It may state two separate claims as one.
None of the sources cited for this claim have been checked yet.
In the paper
“These studies have consistently shown that the adverse effects of air pollution are not limited to high exposures; harmful health effects can be observed at very low concentrations (see below), with no observable thresholds below which exposure can be considered safe.”
§ Changes in tropospheric air quality related to the protection of stratospheric ozone in a changing climate > UV-dependent air pollutants and their effects on human health, plants, and the self-cleaning capacity of the troposphere > Health impacts of photochemical smog
What the sources say
- Not checked yetcites [80] Brauer, M., Brook, J. R., Christidis, T., Chu, Y., Crouse, D. L., Erickson, A., Hystad, P., Li, C., Martin, R. V., Meng, J., Pappin, A. J., Pinault, L. L., Tjepkema, M., van Donkelaar, A., Weichenthal, S., & Burnett, R. T. (2019). Mortality-air pollution associations in low-exposure environments (MAPLE): Phase 1. Research Reports: Health Effects Institute, 203, 1–87
- Not checked yetcites [81] Brunekreef, B., Strak, M., Chen, J., Andersen, Z. J., Atkinson, R., Bauwelinck, M., Bellander, T., Boutron-Ruault, M. C., Brandt, J., Carey, I., Cesaroni, G., Forastiere, F., Fecht, D., Gulliver, J., Hertel, O., Hoffmann, B., de Hoogh, K., Houthuijs, D., Hvidtfeldt, U. A., & Janssen, N. A. H., et al. (2021). Mortality and morbidity effects of long-term exposure to low-level PM2.5, BC, NO2, and O3: An analysis of European cohorts in the ELAPSE project (Vol. WA 754 R432 No. 208, HEI Report Series): Health Effects Institute
- Not checked yetcites [82] Dominici, F., Schwartz, J., Di, Q., Braun, D., Choirat, C., & Zanobetti, A. (Eds.). (2022). Assessing adverse health effects of long-term exposure to low levels of ambient air pollution: Phase 1 (2020/01/08 ed., Vol. 211, HEI Research Reports). Berlin: Health Effects Institute
boostedstates a cause- Asserted: passes — The authors put it forward as true.
- Checkable: passes — It can be checked against evidence.
- Load-bearing: unclear — It is unclear whether the paper’s conclusions depend on it.
- Based: passes — The paper gives a reason why it holds.
It may state two separate claims as one.
In the paper
“Almost all participants had annual average exposures below the European Union guidance values (Table 1) for PM2.5 and NO2, and about 14% had mean annual exposures below the United States National Ambient Air Quality Standards for PM2.5 (12 µg m−3).”
§ Changes in tropospheric air quality related to the protection of stratospheric ozone in a changing climate > UV-dependent air pollutants and their effects on human health, plants, and the self-cleaning capacity of the troposphere > Health impacts of photochemical smog
What the sources say
- Not checked yetcites [81] Brunekreef, B., Strak, M., Chen, J., Andersen, Z. J., Atkinson, R., Bauwelinck, M., Bellander, T., Boutron-Ruault, M. C., Brandt, J., Carey, I., Cesaroni, G., Forastiere, F., Fecht, D., Gulliver, J., Hertel, O., Hoffmann, B., de Hoogh, K., Houthuijs, D., Hvidtfeldt, U. A., & Janssen, N. A. H., et al. (2021). Mortality and morbidity effects of long-term exposure to low-level PM2.5, BC, NO2, and O3: An analysis of European cohorts in the ELAPSE project (Vol. WA 754 R432 No. 208, HEI Report Series): Health Effects Institute
plain- Asserted: passes — The authors put it forward as true.
- Checkable: passes — It can be checked against evidence.
- Load-bearing: fails — The paper’s conclusions may not depend on it.
- Based: passes — The paper gives a reason why it holds.
Probably not a substantial claim. The paper’s conclusions may not depend on it. It may state two separate claims as one.
In the paper
“The study followed 325,367 adults and found significant positive associations between even low exposure to PM2.5, BC, and NO2 and mortality from natural-causes as well as cause-specific mortality such as cardiovascular and ischemic heart disease, cerebrovascular disease, respiratory disease, COPD, diabetes, cardiometabolic disease, and lung cancer mortality [91].”
§ Changes in tropospheric air quality related to the protection of stratospheric ozone in a changing climate > UV-dependent air pollutants and their effects on human health, plants, and the self-cleaning capacity of the troposphere > Health impacts of photochemical smog
What the sources say
- Not checked yetcites [91] Strak, M., Weinmayr, G., Rodopoulou, S., Chen, J., de Hoogh, K., Andersen, Z. J., Atkinson, R., Bauwelinck, M., Bekkevold, T., Bellander, T., Boutron-Ruault, M. C., Brandt, J., Cesaroni, G., Concin, H., Fecht, D., Forastiere, F., Gulliver, J., Hertel, O., Hoffmann, B., Hvidtfeldt, U. A., et al. (2021). Long term exposure to low level air pollution and mortality in eight European cohorts within the ELAPSE project: Pooled analysis. British Medical Journal, 374, n1904. https://doi.org/10.1136/bmj.n1904 source
plainstates an associationn = 325,367- Asserted: passes — The authors put it forward as true.
- Checkable: passes — It can be checked against evidence.
- Load-bearing: unclear — It is unclear whether the paper’s conclusions depend on it.
- Based: passes — The paper gives a reason why it holds.
It may state two separate claims as one.
The paper states this without a source or data behind it here, so there is nothing to check it against. The quote shows it is in the paper.
In the paper
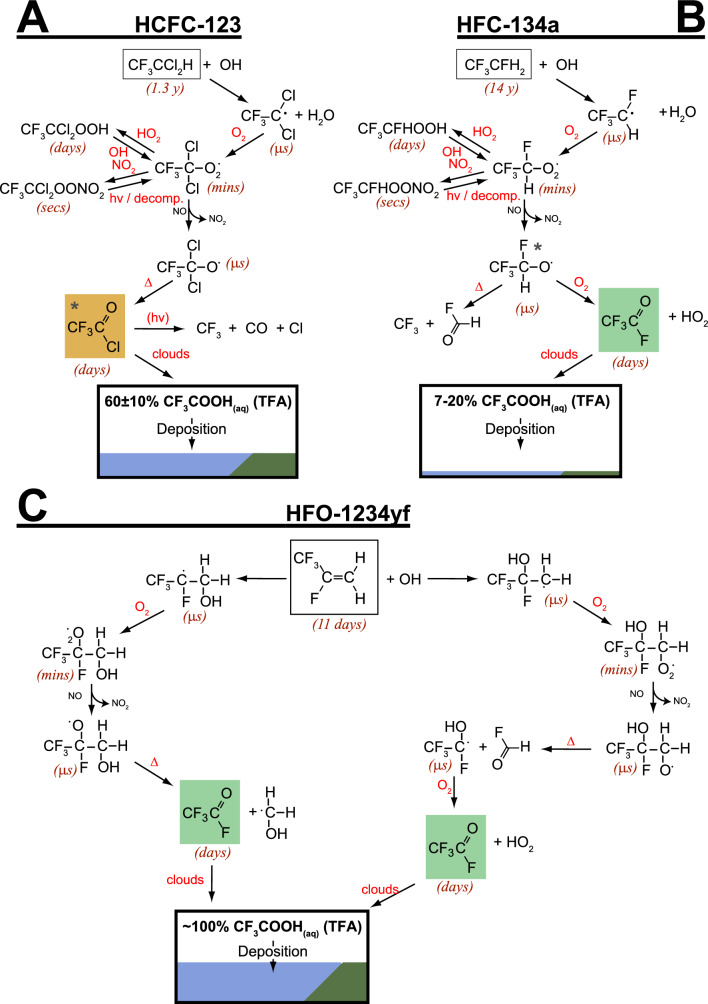
“In the case of HFO-1234yf, no significant competition exists in the degradation pathway, and the expected yield of TFA is ~ 100% through the hydrolysis of CF3CFO.”
§ Changes in tropospheric air quality related to the protection of stratospheric ozone in a changing climate > Trifluoroacetic acid in the global environment with relevance to the Montreal Protocol > Chemical pathways for degradation of precursors to trifluoroacetic acid
plainstates a cause- Asserted: passes — The authors put it forward as true.
- Checkable: passes — It can be checked against evidence.
- Load-bearing: unclear — It is unclear whether the paper’s conclusions depend on it.
- Based: passes — The paper gives a reason why it holds.
It may state two separate claims as one.
In the paper
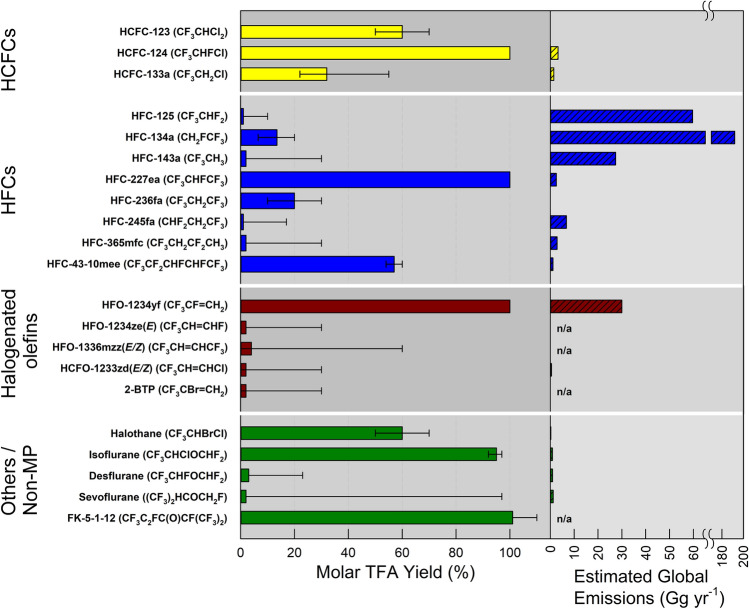
“The worst-case annual formation of TFA from refrigerant R134a was estimated at 1050 tons year−1, 1170 tons year−1 from refrigerant R1234yf, and 141 tons year−1 from all other refrigerants.”
§ Changes in tropospheric air quality related to the protection of stratospheric ozone in a changing climate > Trifluoroacetic acid in the global environment with relevance to the Montreal Protocol > Contribution of chemicals under the purview of the Montreal Protocol to the global load of trifluoroacetic acid
What the sources say
- Not checked yetcites [214] UBA. (2021). Persistent degradation products of halogenated refrigerants and blowing agents in the environment: Type, environmental concentrations, and fate with particular regard to new halogenated substitutes with low global warming potential (Vol. FB000452/ENG). Umwelt Bundesamt
hedged- Asserted: passes — The authors put it forward as true.
- Checkable: passes — It can be checked against evidence.
- Load-bearing: passes — The paper’s conclusions depend on it.
- Based: passes — The paper gives a reason why it holds.
It may state two separate claims as one.
The paper states this without a source or data behind it here, so there is nothing to check it against. The quote shows it is in the paper.
In the paper
“Given current global CH4 emission of ~ 500 Tg year−1, a 1% decrease of the global OH concentration would result in an increase of ~ 1% in tropospheric CH4 concentrations, equivalent to a sustained increase in emissions of CH4 of ~ 5 Tg year−1.”
§ Changes in tropospheric air quality related to the protection of stratospheric ozone in a changing climate > UV-dependent air pollutants and their effects on human health, plants, and the self-cleaning capacity of the troposphere > Conclusions
hedgedstates a cause- Asserted: passes — The authors put it forward as true.
- Checkable: passes — It can be checked against evidence.
- Load-bearing: passes — The paper’s conclusions depend on it.
- Based: unclear — It is unclear why the paper says it holds.
It may state two separate claims as one.
- The authors state this as an assumption: The degradation half-life of TFA in the environment is very long (approximately centuries).
In the paper
“The likelihood of wildfires is increasing globally, a trend that is expected to continue [176].”
§ Changes in tropospheric air quality related to the protection of stratospheric ozone in a changing climate > UV-dependent air pollutants and their effects on human health, plants, and the self-cleaning capacity of the troposphere > Changes in atmospheric circulation and transport of pollutants
What the sources say
- Not checked yetcites [176] Jia, G., Shevliakova, E., Artaxo, P., Noblet-Ducoudré, N. D., Houghton, R., House, J., Kitajima, K., Lennard, C., Popp, A., Sirin, A., Sukumar, R., & Verchot, L. (2019). Land–climate interactions. In: P. R. Shukla, J. Skea, E. C. Buendia, V. Masson-Delmotte, H.-O. Pörtner, D. C. Roberts, P. Zhai, R. Slade, S. Connors, R. v. Diemen, M. Ferrat, E. Haughey, S. Luz, S. Neogi, M. Pathak, J. Petzold, J. P. Pereira, P. Vyas, E. Huntley, et al. (Eds.), Climate Change and Land: an IPCC special report on climate change, desertification, land degradation, sustainable land management, food security, and g
plainstates a cause- Asserted: passes — The authors put it forward as true.
- Checkable: passes — It can be checked against evidence.
- Load-bearing: unclear — It is unclear whether the paper’s conclusions depend on it.
- Based: passes — The paper gives a reason why it holds.
It may state two separate claims as one.
In the paper
“Consequences are colder than normal surface temperatures in southeastern Europe and southern Asia, but warmer than normal surface temperatures in Western Europe, Russia, and northern Asia [178].”
§ Changes in tropospheric air quality related to the protection of stratospheric ozone in a changing climate > UV-dependent air pollutants and their effects on human health, plants, and the self-cleaning capacity of the troposphere > Changes in atmospheric circulation and transport of pollutants
What the sources say
- Not checked yetcites [178] Friedel, M., Chiodo, G., Stenke, A., Domeisen, D. I. V., Fueglistaler, S., Anet, J. G., & Peter, T. (2022). Springtime arctic ozone depletion forces northern hemisphere climate anomalies. Nature Geoscience, 15(7), 541–547. https://doi.org/10.1038/s41561-022-00974-7 source
plainstates a cause- Asserted: passes — The authors put it forward as true.
- Checkable: passes — It can be checked against evidence.
- Load-bearing: unclear — It is unclear whether the paper’s conclusions depend on it.
- Based: passes — The paper gives a reason why it holds.
It may state two separate claims as one.
None of the sources cited for this claim have been checked yet.
In the paper
“The severe fire season in Australia 2019–2020 led to significant degradation of air quality within Australia and a smoke plume that was traced around the globe [173–175].”
§ Changes in tropospheric air quality related to the protection of stratospheric ozone in a changing climate > UV-dependent air pollutants and their effects on human health, plants, and the self-cleaning capacity of the troposphere > Changes in atmospheric circulation and transport of pollutants
What the sources say
- Not checked yetcites [173] Santee, M. L., Lambert, A., Manney, G. L., Livesey, N. J., Froidevaux, L., Neu, J. L., Schwartz, M. J., Millán, L. F., Werner, F., Read, W. G., Park, M., Fuller, R. A., & Ward, B. M. (2022). Prolonged and pervasive perturbations in the composition of the southern hemisphere midlatitude lower stratosphere from the Australian New Year’s fires. Geophysical Research Letters, 49(4), e2021GL096270. https://doi.org/10.1029/2021GL096270 source
- Not checked yetcites [174] Tencé, F., Jumelet, J., Bekki, S., Khaykin, S., Sarkissian, A., & Keckhut, P. (2022). Australian black summer smoke observed by lidar at the French Antarctic station Dumont d’Urville. Journal of Geophysical Research: Atmospheres, 127(4), e2021JD035349. https://doi.org/10.1029/2021JD035349 source
- Not checked yetcites [175] NASA Goddard Space Flight Center. (2021). Global Transport of Australian Bushfire Smoke. https://climate.nasa.gov/climate_resources/202/global-transport-of-australian-bushfire-smoke/. Accessed 16 Mar 2022
plainstates a cause- Asserted: passes — The authors put it forward as true.
- Checkable: passes — It can be checked against evidence.
- Load-bearing: fails — The paper’s conclusions may not depend on it.
- Based: passes — The paper gives a reason why it holds.
Probably not a substantial claim. The paper’s conclusions may not depend on it. It may state two separate claims as one.
In the paper
“Well- and tap-water had concentrations of about 250 ng a.e. L−1.”
§ Changes in tropospheric air quality related to the protection of stratospheric ozone in a changing climate > Trifluoroacetic acid in the global environment with relevance to the Montreal Protocol > Other sources of trifluoroacetic acid in the global environment
What the sources say
- Not checked yetcites [234] Xie, G., Zhai, Z., & Zhang, J. (2020). Distribution characteristics of trifluoroacetic acid in the environments surrounding fluorochemical production plants in Jinan, China. Environmental Science and Pollution Research, 27, 983–991. https://doi.org/10.1007/s11356-019-06689-4 source
plain- Asserted: passes — The authors put it forward as true.
- Checkable: passes — It can be checked against evidence.
- Load-bearing: fails — The paper’s conclusions may not depend on it.
- Based: passes — The paper gives a reason why it holds.
Probably not a substantial claim. The paper’s conclusions may not depend on it.
In the paper
“However, the amounts generated from the oxidation of HFOs represent only a small (< 0.5%) contribution to the formation of acid rain in comparison to other sources such as sulfur and nitrogen oxides [223] and this is judged to not be of concern.”
§ Changes in tropospheric air quality related to the protection of stratospheric ozone in a changing climate > Trifluoroacetic acid in the global environment with relevance to the Montreal Protocol > Trifluoroacetic acid in precipitation
What the sources say
- Not checked yetcites [223] Lindley, A., McCulloch, A., & Vink, T. (2019). Contribution of hydrofluorocarbons (HFCs) and hydrofluoro-olefins (HFOs) atmospheric breakdown products to acidification (“Acid Rain”) in the EU at present and in the future. Open Journal of Air Pollution, 8, 81–95. https://doi.org/10.4236/ojap.2019.84004 source
plainstates a cause- Asserted: passes — The authors put it forward as true.
- Checkable: passes — It can be checked against evidence.
- Load-bearing: unclear — It is unclear whether the paper’s conclusions depend on it.
- Based: passes — The paper gives a reason why it holds.
It may state two separate claims as one.
In the paper
“In the same study, concentrations of TFA in soil samples close to factories ranged from 59 to 2081 ng a.e. kg−1.”
§ Changes in tropospheric air quality related to the protection of stratospheric ozone in a changing climate > Trifluoroacetic acid in the global environment with relevance to the Montreal Protocol > Other sources of trifluoroacetic acid in the global environment
What the sources say
- Not checked yetcites [234] Xie, G., Zhai, Z., & Zhang, J. (2020). Distribution characteristics of trifluoroacetic acid in the environments surrounding fluorochemical production plants in Jinan, China. Environmental Science and Pollution Research, 27, 983–991. https://doi.org/10.1007/s11356-019-06689-4 source
plain- Asserted: passes — The authors put it forward as true.
- Checkable: passes — It can be checked against evidence.
- Load-bearing: fails — The paper’s conclusions may not depend on it.
- Based: passes — The paper gives a reason why it holds.
Probably not a substantial claim. The paper’s conclusions may not depend on it.
In the paper
“TFA was detected in samples of surface water and soils near a fluorochemical complex in Jinan (China) [234].”
§ Changes in tropospheric air quality related to the protection of stratospheric ozone in a changing climate > Trifluoroacetic acid in the global environment with relevance to the Montreal Protocol > Other sources of trifluoroacetic acid in the global environment
What the sources say
- Not checked yetcites [234] Xie, G., Zhai, Z., & Zhang, J. (2020). Distribution characteristics of trifluoroacetic acid in the environments surrounding fluorochemical production plants in Jinan, China. Environmental Science and Pollution Research, 27, 983–991. https://doi.org/10.1007/s11356-019-06689-4 source
plain- Asserted: passes — The authors put it forward as true.
- Checkable: passes — It can be checked against evidence.
- Load-bearing: fails — The paper’s conclusions may not depend on it.
- Based: passes — The paper gives a reason why it holds.
Probably not a substantial claim. The paper’s conclusions may not depend on it.
In the paper
“Uptake of TFA from nutrient solution (containing 2,000,000,000 ng a.e. L−1) by roots and leaves of wheat plants resulted in accumulated concentrations 170,000,000 ng kg−1 in roots and 100,000,000 ng kg−1 in shoots after exposure for 80 h [235].”
§ Changes in tropospheric air quality related to the protection of stratospheric ozone in a changing climate > Trifluoroacetic acid in the global environment with relevance to the Montreal Protocol > Other sources of trifluoroacetic acid in the global environment
What the sources say
- Not checked yetcites [235] Zhang, L., Sun, H., Wang, Q., Chen, H., Yao, Y., Zhao, Z., & Alder, A. C. (2019). Uptake mechanisms of perfluoroalkyl acids with different carbon chain lengths (C2–C8) by wheat (Triticum aestivum L.). Science of the Total Environment, 654, 19–27. https://doi.org/10.1016/j.scitotenv.2018.10.443 source
plainstates a cause- Asserted: passes — The authors put it forward as true.
- Checkable: passes — It can be checked against evidence.
- Load-bearing: fails — The paper’s conclusions may not depend on it.
- Based: passes — The paper gives a reason why it holds.
Probably not a substantial claim. The paper’s conclusions may not depend on it.
In the paper
“Concentration of TFA in lotic (flowing) surface waters ranged from 300 to 1000 ng L−1 but two lentic (still water sites) had mean concentrations of 1700 and 2600 ng a.e. L−1.”
§ Changes in tropospheric air quality related to the protection of stratospheric ozone in a changing climate > Trifluoroacetic acid in the global environment with relevance to the Montreal Protocol > Other sources of trifluoroacetic acid in the global environment
What the sources say
- Not checked yetcites [234] Xie, G., Zhai, Z., & Zhang, J. (2020). Distribution characteristics of trifluoroacetic acid in the environments surrounding fluorochemical production plants in Jinan, China. Environmental Science and Pollution Research, 27, 983–991. https://doi.org/10.1007/s11356-019-06689-4 source
plain- Asserted: passes — The authors put it forward as true.
- Checkable: passes — It can be checked against evidence.
- Load-bearing: unclear — It is unclear whether the paper’s conclusions depend on it.
- Based: passes — The paper gives a reason why it holds.
It may state two separate claims as one.
In the paper
“Greatest amounts of TFA (60,000 and 50,000 ng a.e. L−1) were measured in leachates from two incineration plants, although leachates from one landfill and one transfer-site had similarly high concentrations approaching 40,000 ng a.e. L−1.”
§ Changes in tropospheric air quality related to the protection of stratospheric ozone in a changing climate > Trifluoroacetic acid in the global environment with relevance to the Montreal Protocol > Other sources of trifluoroacetic acid in the global environment
What the sources say
- Not checked yetcites [233] Wang, B., Yao, Y., Chen, H., Chang, S., Tian, Y., & Sun, H. (2020). Per-and polyfluoroalkyl substances and the contribution of unknown precursors and short-chain (C2–C3) perfluoroalkyl carboxylic acids at solid waste disposal facilities. Science of the Total Environment, 705, 135832. https://doi.org/10.1016/j.scitotenv.2019.135832 source
plain- Asserted: passes — The authors put it forward as true.
- Checkable: passes — It can be checked against evidence.
- Load-bearing: unclear — It is unclear whether the paper’s conclusions depend on it.
- Based: passes — The paper gives a reason why it holds.
It may state two separate claims as one.
In the paper
“Concentrations ranged from a low of 9.1 to a high of 320 ng TFA a.e. L−1 and fluxes from 160 to 16,000 ng TFA a.e. m−2 day−1 (Tables SI-7 and SI-8 in [219]).”
§ Changes in tropospheric air quality related to the protection of stratospheric ozone in a changing climate > Trifluoroacetic acid in the global environment with relevance to the Montreal Protocol > Trifluoroacetic acid in precipitation
What the sources say
- Not checked yetcites [219] Chen, H., Zhang, L., Li, M., Yao, Y., Zhao, Z., Munoz, G., & Sun, H. (2019). Per-and polyfluoroalkyl substances (PFASs) in precipitation from mainland China: Contributions of unknown precursors and short-chain (C2C3) perfluoroalkyl carboxylic acids. Water Research, 153, 169–177. https://doi.org/10.1016/j.watres.2019.01.019 source
plain- Asserted: passes — The authors put it forward as true.
- Checkable: passes — It can be checked against evidence.
- Load-bearing: unclear — It is unclear whether the paper’s conclusions depend on it.
- Based: passes — The paper gives a reason why it holds.
It may state two separate claims as one.
In the paper
“TFA was formed in amounts of 19–39 mol% for PFCAs with 5–9 carbon chains.”
§ Changes in tropospheric air quality related to the protection of stratospheric ozone in a changing climate > Trifluoroacetic acid in the global environment with relevance to the Montreal Protocol > Other sources of trifluoroacetic acid in the global environment
What the sources say
- Not checked yetcites [240] Trang, B., Li, Y., Xue, X.-S., Ateia, M., Houk, K. N., & Dichtel, W. R. (2022). Low-temperature mineralization of perfluorocarboxylic acids. Science, 377(6608), 839–845. https://doi.org/10.1126/science.abm8868 source
plainstates a cause- Asserted: passes — The authors put it forward as true.
- Checkable: passes — It can be checked against evidence.
- Load-bearing: fails — The paper’s conclusions may not depend on it.
- Based: passes — The paper gives a reason why it holds.
Probably not a substantial claim. The paper’s conclusions may not depend on it.
In the paper
“A similar study on this source of TFA in Beijing (China) indicated yields of TFA from thermolysis of PTFE, poly(vinylidene fluoride-hexafluoropropylene) (PVDF-HFP), and poly(vinylidene fluoride-co-chlorotrifluoroethylene) (PVDF-CTFE) were 1.2%, 0.9% and 0.3%, respectively, which was estimated to contribute 0.6–6.1 ng a.e. L−1 to precipitation over this city [239].”
§ Changes in tropospheric air quality related to the protection of stratospheric ozone in a changing climate > Trifluoroacetic acid in the global environment with relevance to the Montreal Protocol > Other sources of trifluoroacetic acid in the global environment
What the sources say
- Not checked yetcites [239] Cui, J. N., Guo, J. Y., Zhai, Z. H., & Zhang, J. B. (2019). The contribution of fluoropolymer thermolysis to trifluoroacetic acid (TFA) in environmental media. Chemosphere, 222, 637–644. https://doi.org/10.1016/j.chemosphere.2019.01.174 source
hedgedstates a cause- Asserted: passes — The authors put it forward as true.
- Checkable: passes — It can be checked against evidence.
- Load-bearing: fails — The paper’s conclusions may not depend on it.
- Based: passes — The paper gives a reason why it holds.
Probably not a substantial claim. The paper’s conclusions may not depend on it. It may state two separate claims as one.
In the paper
“When these authors fed maize leaves to herbivores (locusts) the leaf-to-locust transfer factors were < 1 (0.028–0.185), indicative of negative trophic magnification (trophic dilution), most likely because locusts can excrete TFA, as has been demonstrated in mammals [201].”
§ Changes in tropospheric air quality related to the protection of stratospheric ozone in a changing climate > Trifluoroacetic acid in the global environment with relevance to the Montreal Protocol > Other sources of trifluoroacetic acid in the global environment
What the sources say
- Not checked yetcites [201] Boutonnet, J. C., Bingham, P., Calamari, D., Rooij, Cd., Franklin, J., Kawano, T., Libre, J.-M., McCul-Loch, A., Malinverno, G., & Odom, J. M. (1999). Environmental risk assessment of trifluoroacetic acid. Human and Ecological Risk Assessment, 5, 59–124. https://doi.org/10.1080/10807039991289644 source
hedgedstates a possible cause- Asserted: passes — The authors put it forward as true.
- Checkable: passes — It can be checked against evidence.
- Load-bearing: unclear — It is unclear whether the paper’s conclusions depend on it.
- Based: passes — The paper gives a reason why it holds.
It may state two separate claims as one.
A result the paper reports from its own data — it cites no other source for it, so there is none to check. The quote shows it is in the paper.
In the paper
“Total | | | | | 122,604”
§ Changes in tropospheric air quality related to the protection of stratospheric ozone in a changing climate > Trifluoroacetic acid in the global environment with relevance to the Montreal Protocol > Other sources of trifluoroacetic acid in the global environment
plain- Asserted: passes — The authors put it forward as true.
- Checkable: passes — It can be checked against evidence.
- Load-bearing: fails — The paper’s conclusions may not depend on it.
- Based: passes — The paper gives a reason why it holds.
Probably not a substantial claim. The paper’s conclusions may not depend on it. The quote only partly states this claim.
- The authors state this as an assumption: The actual yield of TFA from pesticides is dependent on other substituents on the molecule and the primary driver(s) of degradation, so the calculated yields based on molecular weight ratios are conservative.
The paper states this without a source or data behind it here, so there is nothing to check it against. The quote shows it is in the paper.
In the paper
“There is some uncertainty in toxicity values because of the limited number of marine species tested.”
§ Changes in tropospheric air quality related to the protection of stratospheric ozone in a changing climate > Overall conclusions
plainstates a cause- Asserted: passes — The authors put it forward as true.
- Checkable: passes — It can be checked against evidence.
- Load-bearing: fails — The paper’s conclusions may not depend on it.
- Based: passes — The paper gives a reason why it holds.
Probably not a substantial claim. The paper’s conclusions may not depend on it.
The paper states this without a source or data behind it here, so there is nothing to check it against. The quote shows it is in the paper.
In the paper
“At present, there are large uncertainties associated with the concentrations of TFA in various environmental compartments in some regions”
§ Changes in tropospheric air quality related to the protection of stratospheric ozone in a changing climate > Overall conclusions
plainstates an association- Asserted: passes — The authors put it forward as true.
- Checkable: passes — It can be checked against evidence.
- Load-bearing: fails — The paper’s conclusions may not depend on it.
- Based: fails — The paper may give no reason why it holds.
Probably not a substantial claim. The paper’s conclusions may not depend on it. The paper may give no reason why it holds.
The paper states this without a source or data behind it here, so there is nothing to check it against. The quote shows it is in the paper.
In the paper
“UV-B radiation is responsible for the formation of the OH radical, the major oxidizing agent in the troposphere.”
§ Changes in tropospheric air quality related to the protection of stratospheric ozone in a changing climate > UV-dependent air pollutants and their effects on human health, plants, and the self-cleaning capacity of the troposphere > Background: the UV photochemistry of tropospheric air
plainstates a cause- Asserted: passes — The authors put it forward as true.
- Checkable: passes — It can be checked against evidence.
- Load-bearing: passes — The paper’s conclusions depend on it.
- Based: passes — The paper gives a reason why it holds.
Probably not a substantial claim.
A conclusion the paper draws from its own results — it cites no other source for it, so there is none to check. The quote shows it is in the paper.
In the paper
“The Montreal Protocol has maintained the troposphere’s self-cleaning capacity at near natural levels, but future changes remain a concern, especially if the intensity of UV-B radiation decreases substantially due to increasing stratospheric ozone under some future scenarios.”
§ Changes in tropospheric air quality related to the protection of stratospheric ozone in a changing climate > Introduction
plainstates a cause- Asserted: passes — The authors put it forward as true.
- Checkable: passes — It can be checked against evidence.
- Load-bearing: passes — The paper’s conclusions depend on it.
- Based: passes — The paper gives a reason why it holds.
Probably not a substantial claim.
A conclusion the paper draws from its own results — it cites no other source for it, so there is none to check. The quote shows it is in the paper.
In the paper
“One such product, trifluoroacetic acid (TFA), has no obvious pathway of degradation and might accumulate in some water bodies, but is unlikely to cause adverse effects out to 2100.”
§ Changes in tropospheric air quality related to the protection of stratospheric ozone in a changing climate > Abstract
hedged- Asserted: passes — The authors put it forward as true.
- Checkable: passes — It can be checked against evidence.
- Load-bearing: fails — The paper’s conclusions may not depend on it.
- Based: fails — The paper may give no reason why it holds.
Probably not a substantial claim. The paper’s conclusions may not depend on it. The paper may give no reason why it holds. It may state two separate claims as one.
The paper states this without a source or data behind it here, so there is nothing to check it against. The quote shows it is in the paper.
In the paper
“Replacements for ODSs include chemicals that react with OH radicals, hence preventing the transport of these chemicals to the stratosphere.”
§ Changes in tropospheric air quality related to the protection of stratospheric ozone in a changing climate > Abstract
plainstates a cause- Asserted: passes — The authors put it forward as true.
- Checkable: passes — It can be checked against evidence.
- Load-bearing: fails — The paper’s conclusions may not depend on it.
- Based: passes — The paper gives a reason why it holds.
Probably not a substantial claim. The paper’s conclusions may not depend on it.
In the paper
“when it was shown that ambient O3 was generated by UV-induced reactions involving nitrogen oxides (NOx) and volatile organic compounds (VOCs) [7].”
§ Changes in tropospheric air quality related to the protection of stratospheric ozone in a changing climate > UV-dependent air pollutants and their effects on human health, plants, and the self-cleaning capacity of the troposphere
What the sources say
- Not checked yetcites [7] Haagen-Smit, A. J., Bradley, C. E., & Fox, M. M. (1953). Ozone formation in photochemical oxidation of organic substances. Industrial & Engineering Chemistry, 45(9), 2086–2089. https://doi.org/10.1021/ie50525a044 source
plainstates a cause- Asserted: passes — The authors put it forward as true.
- Checkable: passes — It can be checked against evidence.
- Load-bearing: fails — The paper’s conclusions may not depend on it.
- Based: passes — The paper gives a reason why it holds.
Probably not a substantial claim. The paper’s conclusions may not depend on it.
A conclusion the paper draws from its own results — it cites no other source for it, so there is none to check. The quote shows it is in the paper.
In the paper
“Conversely, reductions in UV radiation decrease chemical reactivity, causing slower production of O3 and other photochemical pollutants near source regions, e.g., urban areas, while slowing the destruction on regional and global scales.”
§ Changes in tropospheric air quality related to the protection of stratospheric ozone in a changing climate > UV-dependent air pollutants and their effects on human health, plants, and the self-cleaning capacity of the troposphere > UV radiation and ground-level ozone
plainstates a cause- Asserted: passes — The authors put it forward as true.
- Checkable: passes — It can be checked against evidence.
- Load-bearing: passes — The paper’s conclusions depend on it.
- Based: passes — The paper gives a reason why it holds.
It may state two separate claims as one.
A conclusion the paper draws from its own results — it cites no other source for it, so there is none to check. The quote shows it is in the paper.
In the paper
“Future scenarios in which stratospheric O3 returns to 1980 values or even exceeds them (the so-called super-recovery) will tend to ameliorate urban ground-level O3 slightly but worsen it in rural areas.”
§ Changes in tropospheric air quality related to the protection of stratospheric ozone in a changing climate > Abstract
plainstates a possible cause- Asserted: passes — The authors put it forward as true.
- Checkable: passes — It can be checked against evidence.
- Load-bearing: passes — The paper’s conclusions depend on it.
- Based: passes — The paper gives a reason why it holds.
It may state two separate claims as one.
In the paper
“Ground-level O3 and PM are detrimental to human health, leading to several million premature deaths per year globally, and have adverse effects on plants and the yields of crops.”
§ Changes in tropospheric air quality related to the protection of stratospheric ozone in a changing climate > Abstract
What the sources say
- Not checked yetcites [77] WHO. (2022). Air Pollution. https://www.who.int/health-topics/air-pollution#tab=tab_1. Accessed Apr 2022
plainstates a cause- Asserted: passes — The authors put it forward as true.
- Checkable: passes — It can be checked against evidence.
- Load-bearing: fails — The paper’s conclusions may not depend on it.
- Based: passes — The paper gives a reason why it holds.
Probably not a substantial claim. The paper’s conclusions may not depend on it. It may state two separate claims as one.
A conclusion the paper draws from its own results — it cites no other source for it, so there is none to check. The quote shows it is in the paper.
In the paper
“For the United States, the recovery to 1980 levels will increase the O3 column by 4–6%, and the resulting lower levels of UV radiation will tend to lower ambient O3 over a few large urban areas, while raising it slightly elsewhere, consistent with an overall slower chemical reactivity.”
§ Changes in tropospheric air quality related to the protection of stratospheric ozone in a changing climate > UV-dependent air pollutants and their effects on human health, plants, and the self-cleaning capacity of the troposphere > UV radiation and ground-level ozone
hedgedstates a possible cause- Asserted: passes — The authors put it forward as true.
- Checkable: passes — It can be checked against evidence.
- Load-bearing: passes — The paper’s conclusions depend on it.
- Based: passes — The paper gives a reason why it holds.
It may state two separate claims as one.
The paper states this without a source or data behind it here, so there is nothing to check it against. The quote shows it is in the paper.
In the paper
“These radicals react with many chemicals emitted to the troposphere, including greenhouse gases such as methane, facilitating their removal from the atmosphere and essentially determining their atmospheric lifetime.”
§ Changes in tropospheric air quality related to the protection of stratospheric ozone in a changing climate > Introduction
plainstates a cause- Asserted: passes — The authors put it forward as true.
- Checkable: passes — It can be checked against evidence.
- Load-bearing: passes — The paper’s conclusions depend on it.
- Based: passes — The paper gives a reason why it holds.
Probably not a substantial claim.
The paper states this without a source or data behind it here, so there is nothing to check it against. The quote shows it is in the paper.
In the paper
“However, their atmospheric photo-degradation can lead to persistent secondary pollutants such as trifluoroacetic acid (TFA), whose ultimate fate in the environment remains unclear, requiring continued monitoring and assessment relative to other natural and/or anthropogenic sources.”
§ Changes in tropospheric air quality related to the protection of stratospheric ozone in a changing climate > Introduction
plainstates a cause- Asserted: passes — The authors put it forward as true.
- Checkable: passes — It can be checked against evidence.
- Load-bearing: fails — The paper’s conclusions may not depend on it.
- Based: passes — The paper gives a reason why it holds.
Probably not a substantial claim. The paper’s conclusions may not depend on it.
The paper states this without a source or data behind it here, so there is nothing to check it against. The quote shows it is in the paper.
In the paper
“such as the central role of UV-generated OH radicals in controlling the overall reactivity; and the formation of O3, peroxides, acids, and other harmful gaseous intermediates, including some that can condense to form particulate matter (PM).”
§ Changes in tropospheric air quality related to the protection of stratospheric ozone in a changing climate > UV-dependent air pollutants and their effects on human health, plants, and the self-cleaning capacity of the troposphere
plainstates a cause- Asserted: passes — The authors put it forward as true.
- Checkable: passes — It can be checked against evidence.
- Load-bearing: fails — The paper’s conclusions may not depend on it.
- Based: passes — The paper gives a reason why it holds.
Probably not a substantial claim. The paper’s conclusions may not depend on it. It may state two separate claims as one.
In the paper
“Future projections tend to show an increasing global burden of tropospheric O3, although the details depend on the assumed scenario of greenhouse gas emissions (only one shown in the figure, SSP370).”
§ Changes in tropospheric air quality related to the protection of stratospheric ozone in a changing climate > UV-dependent air pollutants and their effects on human health, plants, and the self-cleaning capacity of the troposphere > UV radiation and ground-level ozone
What the sources say
- Not checked yetcites [11] Szopa, S., Naik, V., Adhikary, B., Artaxo, P., Berntsen, T., Collins, W. D., Fuzzi, S., Gallardo, L., Scharr, A. K., Klimont, Z., Liao, H., Unger, N., & Zanis, P. (2021). Short-lived climate forcers. In V. Masson-Delmotte, P. Zhai, A. Pirani, S. L. Connors, C. Péan, S. Berger, N. Caud, Y. Chen, L. Goldfarb, M. I. Gomis, M. Huang, K. Leitzell, E. Lonnoy, J. B. R. Matthews, T. K. Maycock, T. Waterfield, O. Yelekçi, R. Yu, & B. Zhou (Eds.), Climate Change 2021: The physical science basis. Contribution of Working Group I to the Sixth Assessment Report of the Intergovernmental Panel on Climate Chan
hedgedstates an association- Asserted: passes — The authors put it forward as true.
- Checkable: passes — It can be checked against evidence.
- Load-bearing: unclear — It is unclear whether the paper’s conclusions depend on it.
- Based: passes — The paper gives a reason why it holds.
It may state two separate claims as one.
The paper states this without a source or data behind it here, so there is nothing to check it against. The quote shows it is in the paper.
In the paper
“Hydroxyl radicals are lost by reaction with reduced chemicals, including carbon monoxide (CO), methane (CH4), VOCs, sulfur dioxide (SO2), and nitrogen dioxide (NO2) (Fig. 1).”
§ Changes in tropospheric air quality related to the protection of stratospheric ozone in a changing climate > UV-dependent air pollutants and their effects on human health, plants, and the self-cleaning capacity of the troposphere > Background: the UV photochemistry of tropospheric air
plainstates a cause- Asserted: passes — The authors put it forward as true.
- Checkable: passes — It can be checked against evidence.
- Load-bearing: fails — The paper’s conclusions may not depend on it.
- Based: passes — The paper gives a reason why it holds.
Probably not a substantial claim. The paper’s conclusions may not depend on it.
The paper states this without a source or data behind it here, so there is nothing to check it against. The quote shows it is in the paper.
In the paper
“This occurs through the photolysis of O3 and subsequent reaction of an electronically excited oxygen atom with water (H2O).”
§ Changes in tropospheric air quality related to the protection of stratospheric ozone in a changing climate > UV-dependent air pollutants and their effects on human health, plants, and the self-cleaning capacity of the troposphere > Background: the UV photochemistry of tropospheric air
plainstates a cause- Asserted: passes — The authors put it forward as true.
- Checkable: passes — It can be checked against evidence.
- Load-bearing: fails — The paper’s conclusions may not depend on it.
- Based: passes — The paper gives a reason why it holds.
Probably not a substantial claim. The paper’s conclusions may not depend on it.
The paper states this without a source or data behind it here, so there is nothing to check it against. The quote shows it is in the paper.
In the paper
“Ultraviolet (UV) radiation drives the net production of tropospheric ozone (O3) and a large fraction of particulate matter (PM) including sulfate, nitrate, and secondary organic aerosols.”
§ Changes in tropospheric air quality related to the protection of stratospheric ozone in a changing climate > Abstract
plainstates a cause- Asserted: passes — The authors put it forward as true.
- Checkable: passes — It can be checked against evidence.
- Load-bearing: passes — The paper’s conclusions depend on it.
- Based: unclear — It is unclear why the paper says it holds.
It may state two separate claims as one.
The paper states this without a source or data behind it here, so there is nothing to check it against. The quote shows it is in the paper.
In the paper
“More intense UV-B irradiation generally induces faster chemical reactivity in air parcels (Box 1), leading to faster removal of primary chemicals, but also more rapid and intense build up (and removal) of intermediate or secondary pollutants, such as hetero-organics (e.g., aldehydes, ketones, and organic nitrates) and other by-products including O3, peroxides, and secondary PM.”
§ Changes in tropospheric air quality related to the protection of stratospheric ozone in a changing climate > UV-dependent air pollutants and their effects on human health, plants, and the self-cleaning capacity of the troposphere > UV radiation and ground-level ozone
plainstates a cause- Asserted: passes — The authors put it forward as true.
- Checkable: passes — It can be checked against evidence.
- Load-bearing: passes — The paper’s conclusions depend on it.
- Based: passes — The paper gives a reason why it holds.
It may state two separate claims as one.
The paper states this without a source or data behind it here, so there is nothing to check it against. The quote shows it is in the paper.
In the paper
“Most ground-level O3 is produced by the UV photochemical processing of pollutants (see Sect. 2.1), with occasional contributions from downward transport of ozone-rich stratospheric air (see Sect. 2.7).”
§ Changes in tropospheric air quality related to the protection of stratospheric ozone in a changing climate > UV-dependent air pollutants and their effects on human health, plants, and the self-cleaning capacity of the troposphere > UV radiation and ground-level ozone
plainstates a cause- Asserted: passes — The authors put it forward as true.
- Checkable: passes — It can be checked against evidence.
- Load-bearing: unclear — It is unclear whether the paper’s conclusions depend on it.
- Based: passes — The paper gives a reason why it holds.
It may state two separate claims as one.
The paper states this without a source or data behind it here, so there is nothing to check it against. The quote shows it is in the paper.
In the paper
“Actions under the Montreal Protocol have led to the introduction of new chemicals to the atmosphere as replacements to some of the ozone-depleting substances, including hydrofluorochlorocarbons (HCFCs), hydrofluorocarbons (HFCs), hydrofluoroethers (HFEs), hydrofluoroolefins (HFOs) and hydrochlorofluoroolefins (HCFOs).”
§ Changes in tropospheric air quality related to the protection of stratospheric ozone in a changing climate > Introduction
plainstates a cause- Asserted: passes — The authors put it forward as true.
- Checkable: passes — It can be checked against evidence.
- Load-bearing: passes — The paper’s conclusions depend on it.
- Based: fails — The paper may give no reason why it holds.
Probably not a substantial claim. The paper may give no reason why it holds.
The paper states this without a source or data behind it here, so there is nothing to check it against. The quote shows it is in the paper.
In the paper
“Nitrogen oxides (NOx = NO + NO2) are emitted primarily as NO, and the NO2 is produced via the re-cycling of the hydroxyl radical (OH) generated from the UV-B photolysis of O3.”
§ Changes in tropospheric air quality related to the protection of stratospheric ozone in a changing climate > UV-dependent air pollutants and their effects on human health, plants, and the self-cleaning capacity of the troposphere > Background: the UV photochemistry of tropospheric air
plainstates a cause- Asserted: passes — The authors put it forward as true.
- Checkable: passes — It can be checked against evidence.
- Load-bearing: unclear — It is unclear whether the paper’s conclusions depend on it.
- Based: passes — The paper gives a reason why it holds.
It may state two separate claims as one.
The paper states this without a source or data behind it here, so there is nothing to check it against. The quote shows it is in the paper.
In the paper
“Chemicals such as chlorofluorocarbons (CFCs) that do not react with OH have the potential to reach the stratosphere in large amounts; the CFCs were, therefore, replaced with chemicals that react with OH (HCFCs, HFCs, HFOs, etc.).”
§ Changes in tropospheric air quality related to the protection of stratospheric ozone in a changing climate > UV-dependent air pollutants and their effects on human health, plants, and the self-cleaning capacity of the troposphere > Background: the UV photochemistry of tropospheric air
plainstates a cause- Asserted: passes — The authors put it forward as true.
- Checkable: passes — It can be checked against evidence.
- Load-bearing: fails — The paper’s conclusions may not depend on it.
- Based: passes — The paper gives a reason why it holds.
Probably not a substantial claim. The paper’s conclusions may not depend on it. It may state two separate claims as one.
None of the sources cited for this claim have been checked yet.
In the paper
“Ultraviolet-induced photo-processes within and on the surface of aerosols can also increase the ability of aerosols to act as cloud condensation nuclei (CCN) [73, 74], which can change cloud properties and therefore indirectly impact climate.”
§ Changes in tropospheric air quality related to the protection of stratospheric ozone in a changing climate > UV-dependent air pollutants and their effects on human health, plants, and the self-cleaning capacity of the troposphere > UV radiation and particulate matter
What the sources say
- Not checked yetcites [73] Borduas-Dedekind, N., Ossola, R., David, R. O., Boynton, L. S., Weichlinger, V., Kanji, Z. A., & McNeill, K. (2019). Photomineralization mechanism changes the ability of dissolved organic matter to activate cloud droplets and to nucleate ice crystals. Atmospheric Chemistry and Physics, 19(19), 12397–12412. https://doi.org/10.5194/acp-19-12397-2019 source
- Not checked yetcites [74] Borduas-Dedekind, N., Nizkorodov, S., & McNeill, K. (2020). UVB-irradiated laboratory-generated secondary organic aerosol extracts have increased cloud condensation nuclei abilities: Comparison with dissolved organic matter and implications for the photomineralization mechanism. Chimia (Aarau), 74(3), 142–148. https://doi.org/10.2533/chimia.2020.142 source
plainstates a cause- Asserted: passes — The authors put it forward as true.
- Checkable: passes — It can be checked against evidence.
- Load-bearing: passes — The paper’s conclusions depend on it.
- Based: passes — The paper gives a reason why it holds.
It may state two separate claims as one.
In the paper
“Thus, the World Health Organization (WHO) estimates that 4.2 million deaths every year occur because of exposure to ambient (outdoor) air pollution which includes particulates and gases, such as O3, NOx, etc. [77].”
§ Changes in tropospheric air quality related to the protection of stratospheric ozone in a changing climate > UV-dependent air pollutants and their effects on human health, plants, and the self-cleaning capacity of the troposphere > Health impacts of photochemical smog
What the sources say
- Not checked yetcites [77] WHO. (2022). Air Pollution. https://www.who.int/health-topics/air-pollution#tab=tab_1. Accessed Apr 2022
hedgedstates a cause- Asserted: passes — The authors put it forward as true.
- Checkable: passes — It can be checked against evidence.
- Load-bearing: fails — The paper’s conclusions may not depend on it.
- Based: passes — The paper gives a reason why it holds.
Probably not a substantial claim. The paper’s conclusions may not depend on it.
A result the paper reports from its own data — it cites no other source for it, so there is none to check. The quote shows it is in the paper.
In the paper
“Even at current levels (see Figs. 2 and 3), ground-level O3 damages vegetation and causes economically significant reductions in crop yields (see Sects. 2.4 and 2.5).”
§ Changes in tropospheric air quality related to the protection of stratospheric ozone in a changing climate > UV-dependent air pollutants and their effects on human health, plants, and the self-cleaning capacity of the troposphere > UV radiation and ground-level ozone
plainstates a cause- Asserted: passes — The authors put it forward as true.
- Checkable: passes — It can be checked against evidence.
- Load-bearing: unclear — It is unclear whether the paper’s conclusions depend on it.
- Based: passes — The paper gives a reason why it holds.
It may state two separate claims as one.
A conclusion the paper draws from its own results — it cites no other source for it, so there is none to check. The quote shows it is in the paper.
In the paper
“However, despite this uncertainty, even small changes in UV radiation should be of concern, because of the large number of people currently exposed to poor air quality and its significance to human health.”
§ Changes in tropospheric air quality related to the protection of stratospheric ozone in a changing climate > UV-dependent air pollutants and their effects on human health, plants, and the self-cleaning capacity of the troposphere > UV radiation and particulate matter
plain- Asserted: passes — The authors put it forward as true.
- Checkable: fails — It may be too vague to check against evidence.
- Load-bearing: passes — The paper’s conclusions depend on it.
- Based: passes — The paper gives a reason why it holds.
Probably not a substantial claim. It may be too vague to check against evidence.
A conclusion the paper draws from its own results — it cites no other source for it, so there is none to check. The quote shows it is in the paper.
In the paper
“Decreases (increases) in stratospheric O3 lead to increases (decreases) in tropospheric UV-B radiation and concentrations of OH radicals, and therefore to faster (slower) formation of these PM.”
§ Changes in tropospheric air quality related to the protection of stratospheric ozone in a changing climate > UV-dependent air pollutants and their effects on human health, plants, and the self-cleaning capacity of the troposphere > UV radiation and particulate matter
plainstates a cause- Asserted: passes — The authors put it forward as true.
- Checkable: passes — It can be checked against evidence.
- Load-bearing: passes — The paper’s conclusions depend on it.
- Based: passes — The paper gives a reason why it holds.
It may state two separate claims as one.
The paper states this without a source or data behind it here, so there is nothing to check it against. The quote shows it is in the paper.
In the paper
““secondary” PM is produced in the atmosphere, typically by condensation of gases having low saturation vapor pressures.”
§ Changes in tropospheric air quality related to the protection of stratospheric ozone in a changing climate > UV-dependent air pollutants and their effects on human health, plants, and the self-cleaning capacity of the troposphere > UV radiation and particulate matter
plainstates a cause- Asserted: passes — The authors put it forward as true.
- Checkable: passes — It can be checked against evidence.
- Load-bearing: passes — The paper’s conclusions depend on it.
- Based: passes — The paper gives a reason why it holds.
Probably not a substantial claim.
The paper states this without a source or data behind it here, so there is nothing to check it against. The quote shows it is in the paper.
In the paper
“While sulfate and nitrate PM are of secondary origin, for organics the relative global contribution of primary and secondary PM is less clear.”
§ Changes in tropospheric air quality related to the protection of stratospheric ozone in a changing climate > UV-dependent air pollutants and their effects on human health, plants, and the self-cleaning capacity of the troposphere > UV radiation and particulate matter
plain- Asserted: passes — The authors put it forward as true.
- Checkable: passes — It can be checked against evidence.
- Load-bearing: passes — The paper’s conclusions depend on it.
- Based: passes — The paper gives a reason why it holds.
It may state two separate claims as one.
A conclusion the paper draws from its own results — it cites no other source for it, so there is none to check. The quote shows it is in the paper.
In the paper
“The rate-limiting step in the production of these particles is the reaction of OH with the precursors (NO2, SO2, or VOCs), so that the dependence of OH on UV radiation (see Sect. 2.1) applies directly to the rate of formation of secondary PM as well.”
§ Changes in tropospheric air quality related to the protection of stratospheric ozone in a changing climate > UV-dependent air pollutants and their effects on human health, plants, and the self-cleaning capacity of the troposphere > UV radiation and particulate matter
plainstates a cause- Asserted: passes — The authors put it forward as true.
- Checkable: passes — It can be checked against evidence.
- Load-bearing: passes — The paper’s conclusions depend on it.
- Based: passes — The paper gives a reason why it holds.
It may state two separate claims as one.
A conclusion the paper draws from its own results — it cites no other source for it, so there is none to check. The quote shows it is in the paper.
In the paper
“Reduced emissions have systematically improved air quality in many locations, but this has increased UV radiation near the surface, potentially negating some of the benefits of the reduced emissions.”
§ Changes in tropospheric air quality related to the protection of stratospheric ozone in a changing climate > UV-dependent air pollutants and their effects on human health, plants, and the self-cleaning capacity of the troposphere > UV radiation and ground-level ozone
hedgedstates a cause- Asserted: passes — The authors put it forward as true.
- Checkable: passes — It can be checked against evidence.
- Load-bearing: passes — The paper’s conclusions depend on it.
- Based: passes — The paper gives a reason why it holds.
It may state two separate claims as one.
The paper states this without a source or data behind it here, so there is nothing to check it against. The quote shows it is in the paper.
In the paper
“Particulate matter is a major component of air pollution, and particles smaller than about 2.5 µm (PM2.5) are believed to be particularly damaging due to their ability to penetrate deeply into lungs.”
§ Changes in tropospheric air quality related to the protection of stratospheric ozone in a changing climate > UV-dependent air pollutants and their effects on human health, plants, and the self-cleaning capacity of the troposphere > UV radiation and particulate matter
hedgedstates a possible cause- Asserted: passes — The authors put it forward as true.
- Checkable: passes — It can be checked against evidence.
- Load-bearing: fails — The paper’s conclusions may not depend on it.
- Based: fails — The paper may give no reason why it holds.
Probably not a substantial claim. The paper’s conclusions may not depend on it. The paper may give no reason why it holds.
None of the sources cited for this claim have been checked yet.
In the paper
“Much larger changes would have occurred without the implementation of the Montreal Protocol (the “world avoided”), where unabated growth of emissions of CFCs would have resulted in catastrophic global loss of stratospheric O3 [24], with major impacts on UV radiation [25], incidence of skin cancer [26, 27], and reduction of the global carbon sink by damage to vegetation [28].”
§ Changes in tropospheric air quality related to the protection of stratospheric ozone in a changing climate > UV-dependent air pollutants and their effects on human health, plants, and the self-cleaning capacity of the troposphere > UV radiation and ground-level ozone
What the sources say
- Not checked yetcites [24] Newman, P. A., Oman, L. D., Douglass, A. R., Fleming, E. L., Frith, S. M., Hurwitz, M. M., Kawa, S. R., Jackman, C. H., Krotkov, N. A., Nash, E. R., Nielsen, J. E., Pawson, S., Stolarski, R. S., & Velders, G. J. M. (2009). What would have happened to the ozone layer if chlorofluorocarbons (CFCs) had not been regulated? Atmospheric Chemistry and Physics, 9(6), 2113–2128. https://doi.org/10.5194/acp-9-2113-2009 source
- Not checked yetcites [25] McKenzie, R., Bernhard, G., Liley, B., Disterhoft, P., Rhodes, S., Bais, A., Morgenstern, O., Newman, P., Oman, L., Brogniez, C., & Simic, S. (2019). Success of Montreal Protocol demonstrated by comparing high-quality UV measurements with “World Avoided” calculations from two chemistry-climate models. Scientific Reports, 9, 13. https://doi.org/10.1038/s41598-019-48625-z source
- Not checked yetcites [26] van Dijk, A., Slaper, H., den Outer, P. N., Morgenstern, O., Braesicke, P., Pyle, J. A., Garny, H., Stenke, A., Dameris, M., Kazantzidis, A., Tourpali, K., & Bais, A. F. (2013). Skin cancer risks avoided by the Montreal Protocol–worldwide modeling integrating coupled climate-chemistry models with a risk model for UV. Photochemistry & Photobiology, 89(1), 234–246. https://doi.org/10.1111/j.1751-1097.2012.01223.x source
- Not checked yetcites [27] Madronich, S., Lee-Taylor, J. M., Wagner, M., Kyle, J., Hu, Z., & Landolfi, R. (2021). Estimation of skin and ocular damage avoided in the United States through implementation of the Montreal Protocol on substances that deplete the ozone layer. ACS Earth and Space Chemistry, 5(8), 1876–1888. https://doi.org/10.1021/acsearthspacechem.1c00183 source
hedgedstates a cause- Asserted: passes — The authors put it forward as true.
- Checkable: passes — It can be checked against evidence.
- Load-bearing: unclear — It is unclear whether the paper’s conclusions depend on it.
- Based: passes — The paper gives a reason why it holds.
It may state two separate claims as one.
None of the sources cited for this claim have been checked yet.
In the paper
“In response to this, the World Health Organization (WHO) updated its 2005 Global Air Quality Guidelines (AQG) in September 2021 [83, 84].”
§ Changes in tropospheric air quality related to the protection of stratospheric ozone in a changing climate > UV-dependent air pollutants and their effects on human health, plants, and the self-cleaning capacity of the troposphere > Health impacts of photochemical smog
What the sources say
- Not checked yetcites [83] WHO. (2021). WHO global air quality guidelines: Particulate matter (PM2.5 and PM10), ozone, nitrogen dioxide, sulfur dioxide and carbon monoxide. Geneva: World Health Organization
- Not checked yetcites [84] WHO. (2017). Evolution of WHO air quality guidelines: Past, present and future (2017). World Health Organization
plain- Asserted: passes — The authors put it forward as true.
- Checkable: passes — It can be checked against evidence.
- Load-bearing: fails — The paper’s conclusions may not depend on it.
- Based: passes — The paper gives a reason why it holds.
Probably not a substantial claim. The paper’s conclusions may not depend on it.
In the paper
“Evidence continues to accumulate demonstrating that exposure to air pollution can have serious effects on nearly all organ systems of the human body.”
§ Changes in tropospheric air quality related to the protection of stratospheric ozone in a changing climate > UV-dependent air pollutants and their effects on human health, plants, and the self-cleaning capacity of the troposphere > Health impacts of photochemical smog
What the sources say
- Not checked yetcites [6] Wilson, S. R., Madronich, S., Longstreth, J. D., & Solomon, K. R. (2019). Interactive effects of changing stratospheric ozone and climate on tropospheric composition and air quality, and the consequences for human and ecosystem health. Photochemical & Photobiological Sciences, 18, 775–803. https://doi.org/10.1039/c8pp90064g source
boostedstates a cause- Asserted: passes — The authors put it forward as true.
- Checkable: passes — It can be checked against evidence.
- Load-bearing: fails — The paper’s conclusions may not depend on it.
- Based: passes — The paper gives a reason why it holds.
Probably not a substantial claim. The paper’s conclusions may not depend on it.
In the paper
“The new guidelines are aiming for annual mean concentrations of PM2.5 not exceeding 5 µg m−3 and NO2 not exceeding 10 µg m−3, and the peak season mean 8-h O3 concentration not exceeding 60 µg m−3 [83].”
§ Changes in tropospheric air quality related to the protection of stratospheric ozone in a changing climate > UV-dependent air pollutants and their effects on human health, plants, and the self-cleaning capacity of the troposphere > Health impacts of photochemical smog
What the sources say
- Not checked yetcites [83] WHO. (2021). WHO global air quality guidelines: Particulate matter (PM2.5 and PM10), ozone, nitrogen dioxide, sulfur dioxide and carbon monoxide. Geneva: World Health Organization
plain- Asserted: passes — The authors put it forward as true.
- Checkable: passes — It can be checked against evidence.
- Load-bearing: fails — The paper’s conclusions may not depend on it.
- Based: passes — The paper gives a reason why it holds.
Probably not a substantial claim. The paper’s conclusions may not depend on it. It may state two separate claims as one.
The paper states this without a source or data behind it here, so there is nothing to check it against. The quote shows it is in the paper.
In the paper
“In the context of the Montreal Protocol, UV-dependent secondary PM (sulfate, nitrate, and secondary organics) is chemically distinct from primary, UV-independent, PM.”
§ Changes in tropospheric air quality related to the protection of stratospheric ozone in a changing climate > UV-dependent air pollutants and their effects on human health, plants, and the self-cleaning capacity of the troposphere > Health impacts of photochemical smog
plain- Asserted: passes — The authors put it forward as true.
- Checkable: passes — It can be checked against evidence.
- Load-bearing: passes — The paper’s conclusions depend on it.
- Based: fails — The paper may give no reason why it holds.
Probably not a substantial claim. The paper may give no reason why it holds.
A conclusion the paper draws from its own results — it cites no other source for it, so there is none to check. The quote shows it is in the paper.
In the paper
“Thus, the relative health impacts of secondary vs. primary PM are central to this assessment.”
§ Changes in tropospheric air quality related to the protection of stratospheric ozone in a changing climate > UV-dependent air pollutants and their effects on human health, plants, and the self-cleaning capacity of the troposphere > Health impacts of photochemical smog
plain- Asserted: passes — The authors put it forward as true.
- Checkable: passes — It can be checked against evidence.
- Load-bearing: passes — The paper’s conclusions depend on it.
- Based: passes — The paper gives a reason why it holds.
Probably not a substantial claim.
In the paper
“For comparison, the corresponding 2005 WHO guideline values for PM2.5 and NO2 were 10 µg m−3 and 40 µg m−3 with no recommendation issued for long-term concentrations of O3 [85].”
§ Changes in tropospheric air quality related to the protection of stratospheric ozone in a changing climate > UV-dependent air pollutants and their effects on human health, plants, and the self-cleaning capacity of the troposphere > Health impacts of photochemical smog
What the sources say
- Not checked yetcites [85] WHO. (2006). Air Quality guidelines: global update 2005: Particulate matter, ozone, nitrogen dioxide and sulfur dioxide (Vol. EUR/05/5046029). World Health Organization. Regional Office for Europe
plain- Asserted: passes — The authors put it forward as true.
- Checkable: passes — It can be checked against evidence.
- Load-bearing: fails — The paper’s conclusions may not depend on it.
- Based: passes — The paper gives a reason why it holds.
Probably not a substantial claim. The paper’s conclusions may not depend on it. It may state two separate claims as one.
In the paper
“As outlined in our earlier assessment, the health effects of air pollution include cardiovascular and respiratory disease, cancer, effects on the brain and the reproductive system including adverse birth outcomes [6].”
§ Changes in tropospheric air quality related to the protection of stratospheric ozone in a changing climate > UV-dependent air pollutants and their effects on human health, plants, and the self-cleaning capacity of the troposphere > Health impacts of photochemical smog
What the sources say
- Not checked yetcites [6] Wilson, S. R., Madronich, S., Longstreth, J. D., & Solomon, K. R. (2019). Interactive effects of changing stratospheric ozone and climate on tropospheric composition and air quality, and the consequences for human and ecosystem health. Photochemical & Photobiological Sciences, 18, 775–803. https://doi.org/10.1039/c8pp90064g source
plainstates a cause- Asserted: passes — The authors put it forward as true.
- Checkable: passes — It can be checked against evidence.
- Load-bearing: fails — The paper’s conclusions may not depend on it.
- Based: passes — The paper gives a reason why it holds.
Probably not a substantial claim. The paper’s conclusions may not depend on it. It may state two separate claims as one.
None of the sources cited for this claim have been checked yet.
In the paper
“With the decrease in concentrations of key pollutants, studies now show the detrimental effects on health at relatively low levels of air pollution. Many show effects at concentrations lower than the current annual average standard.”
§ Changes in tropospheric air quality related to the protection of stratospheric ozone in a changing climate > UV-dependent air pollutants and their effects on human health, plants, and the self-cleaning capacity of the troposphere > Health impacts of photochemical smog
What the sources say
- Not checked yetcites [80] Brauer, M., Brook, J. R., Christidis, T., Chu, Y., Crouse, D. L., Erickson, A., Hystad, P., Li, C., Martin, R. V., Meng, J., Pappin, A. J., Pinault, L. L., Tjepkema, M., van Donkelaar, A., Weichenthal, S., & Burnett, R. T. (2019). Mortality-air pollution associations in low-exposure environments (MAPLE): Phase 1. Research Reports: Health Effects Institute, 203, 1–87
- Not checked yetcites [81] Brunekreef, B., Strak, M., Chen, J., Andersen, Z. J., Atkinson, R., Bauwelinck, M., Bellander, T., Boutron-Ruault, M. C., Brandt, J., Carey, I., Cesaroni, G., Forastiere, F., Fecht, D., Gulliver, J., Hertel, O., Hoffmann, B., de Hoogh, K., Houthuijs, D., Hvidtfeldt, U. A., & Janssen, N. A. H., et al. (2021). Mortality and morbidity effects of long-term exposure to low-level PM2.5, BC, NO2, and O3: An analysis of European cohorts in the ELAPSE project (Vol. WA 754 R432 No. 208, HEI Report Series): Health Effects Institute
- Not checked yetcites [82] Dominici, F., Schwartz, J., Di, Q., Braun, D., Choirat, C., & Zanobetti, A. (Eds.). (2022). Assessing adverse health effects of long-term exposure to low levels of ambient air pollution: Phase 1 (2020/01/08 ed., Vol. 211, HEI Research Reports). Berlin: Health Effects Institute
plainstates a cause- Asserted: passes — The authors put it forward as true.
- Checkable: passes — It can be checked against evidence.
- Load-bearing: passes — The paper’s conclusions depend on it.
- Based: passes — The paper gives a reason why it holds.
It may state two separate claims as one.
In the paper
“and NO2 exposure HR = 1.031 (95% CI 1.023–1.039).”
§ Changes in tropospheric air quality related to the protection of stratospheric ozone in a changing climate > UV-dependent air pollutants and their effects on human health, plants, and the self-cleaning capacity of the troposphere > Health impacts of photochemical smog
What the sources say
- Not checked yetcites [115] Shi, L., Steenland, K., Li, H., Liu, P., Zhang, Y., Lyles, R. H., Requia, W. J., Ilango, S. D., Chang, H. H., Wingo, T., Weber, R. J., & Schwartz, J. (2021). A national cohort study (2000–2018) of long-term air pollution exposure and incident dementia in older adults in the United States. Nature Communications, 12(1), 6754. https://doi.org/10.1038/s41467-021-27049-2 source
plainstates an association- Asserted: passes — The authors put it forward as true.
- Checkable: passes — It can be checked against evidence.
- Load-bearing: unclear — It is unclear whether the paper’s conclusions depend on it.
- Based: passes — The paper gives a reason why it holds.
The quote only partly states this claim.
In the paper
“The authors also observed significant associations between exposure to PM2.5 and the development of Alzheimer’s disease HR = 1.078 (95% CI 1.070–1.086)”
§ Changes in tropospheric air quality related to the protection of stratospheric ozone in a changing climate > UV-dependent air pollutants and their effects on human health, plants, and the self-cleaning capacity of the troposphere > Health impacts of photochemical smog
What the sources say
- Not checked yetcites [115] Shi, L., Steenland, K., Li, H., Liu, P., Zhang, Y., Lyles, R. H., Requia, W. J., Ilango, S. D., Chang, H. H., Wingo, T., Weber, R. J., & Schwartz, J. (2021). A national cohort study (2000–2018) of long-term air pollution exposure and incident dementia in older adults in the United States. Nature Communications, 12(1), 6754. https://doi.org/10.1038/s41467-021-27049-2 source
plainstates an association- Asserted: passes — The authors put it forward as true.
- Checkable: passes — It can be checked against evidence.
- Load-bearing: unclear — It is unclear whether the paper’s conclusions depend on it.
- Based: passes — The paper gives a reason why it holds.
The quote only partly states this claim.
None of the sources cited for this claim have been checked yet.
In the paper
“Ground-level ozone is a particular concern, since numerous studies have demonstrated significant damage [78, 116].”
§ Changes in tropospheric air quality related to the protection of stratospheric ozone in a changing climate > UV-dependent air pollutants and their effects on human health, plants, and the self-cleaning capacity of the troposphere > Effects of tropospheric ozone and particulates on plants
What the sources say
- Not checked yetcites [78] Lefohn, A. S., Malley, C. S., Smith, L., Wells, B., Hazucha, M., Simon, H., Naik, V., Mills, G., Schultz, M. G., Paoletti, E., De Marco, A., Xu, X., Zhang, L., Wang, T., Neufeld, H. S., Musselman, R. C., Tarasick, D., Brauer, M., Feng, Z., Tang, H., et al. (2018). Tropospheric ozone assessment report: Global ozone metrics for climate change, human health, and crop/ecosystem research. Elementa: Science of the Anthropocene, 6, 27. https://doi.org/10.1525/elementa.279 source
- Not checked yetcites [116] Paoletti, E., Feng, Z., De Marco, A., Hoshika, Y., Harmens, H., Agathokleous, E., Domingos, M., Mills, G., Sicard, P., Zhang, L., & Carrari, E. (2020). Challenges, gaps and opportunities in investigating the interactions of ozone pollution and plant ecosystems. Science of the Total Environment, 709, 136188. https://doi.org/10.1016/j.scitotenv.2019.136188 source
boostedstates a cause- Asserted: passes — The authors put it forward as true.
- Checkable: passes — It can be checked against evidence.
- Load-bearing: fails — The paper’s conclusions may not depend on it.
- Based: passes — The paper gives a reason why it holds.
Probably not a substantial claim. The paper’s conclusions may not depend on it.
In the paper
“The effect of PM10 during higher temperatures increased the risk of mortality by 2.1%, and for hospital admissions the effects increased by 11%.”
§ Changes in tropospheric air quality related to the protection of stratospheric ozone in a changing climate > UV-dependent air pollutants and their effects on human health, plants, and the self-cleaning capacity of the troposphere > Health impacts of photochemical smog
What the sources say
- Not checked yetcites [108] Areal, A. T., Zhao, Q., Wigmann, C., Schneider, A., & Schikowski, T. (2022). The effect of air pollution when modified by temperature on respiratory health outcomes: A systematic review and meta-analysis. Science of the Total Environment, 811, 152336. https://doi.org/10.1016/j.scitotenv.2021.152336 source
plainstates a cause- Asserted: passes — The authors put it forward as true.
- Checkable: passes — It can be checked against evidence.
- Load-bearing: unclear — It is unclear whether the paper’s conclusions depend on it.
- Based: passes — The paper gives a reason why it holds.
It may state two separate claims as one.
In the paper
“The strongest effect found was with respect to PM2.5 and cognitive decline.”
§ Changes in tropospheric air quality related to the protection of stratospheric ozone in a changing climate > UV-dependent air pollutants and their effects on human health, plants, and the self-cleaning capacity of the troposphere > Health impacts of photochemical smog
What the sources say
- Not checked yetcites [113] Weuve, J., Bennett, E. E., Ranker, L., Gianattasio, K. Z., Pedde, M., Adar, S. D., Yanosky, J. D., & Power, M. C. (2021). Exposure to air pollution in relation to risk of dementia and related outcomes: An updated systematic review of the epidemiological literature. Environmental Health Perspectives, 129(9), 96001. https://doi.org/10.1289/EHP8716 source
plainstates an association- Asserted: passes — The authors put it forward as true.
- Checkable: passes — It can be checked against evidence.
- Load-bearing: fails — The paper’s conclusions may not depend on it.
- Based: passes — The paper gives a reason why it holds.
Probably not a substantial claim. The paper’s conclusions may not depend on it.
In the paper
“A recent review [113] found that, despite a substantial increase in publications, there is only suggestive evidence that air pollution may influence late-life cognitive health as there is still substantial heterogeneity of findings across the studies.”
§ Changes in tropospheric air quality related to the protection of stratospheric ozone in a changing climate > UV-dependent air pollutants and their effects on human health, plants, and the self-cleaning capacity of the troposphere > Health impacts of photochemical smog
What the sources say
- Not checked yetcites [113] Weuve, J., Bennett, E. E., Ranker, L., Gianattasio, K. Z., Pedde, M., Adar, S. D., Yanosky, J. D., & Power, M. C. (2021). Exposure to air pollution in relation to risk of dementia and related outcomes: An updated systematic review of the epidemiological literature. Environmental Health Perspectives, 129(9), 96001. https://doi.org/10.1289/EHP8716 source
hedgedstates a possible cause- Asserted: passes — The authors put it forward as true.
- Checkable: passes — It can be checked against evidence.
- Load-bearing: fails — The paper’s conclusions may not depend on it.
- Based: passes — The paper gives a reason why it holds.
Probably not a substantial claim. The paper’s conclusions may not depend on it. It may state two separate claims as one.
In the paper
“In a recent meta-analysis, Areal et al. [108] showed that effects of air pollutants were modified by high temperatures, leading to higher mortality from respiratory diseases and an increase in hospital admissions.”
§ Changes in tropospheric air quality related to the protection of stratospheric ozone in a changing climate > UV-dependent air pollutants and their effects on human health, plants, and the self-cleaning capacity of the troposphere > Health impacts of photochemical smog
What the sources say
- Not checked yetcites [108] Areal, A. T., Zhao, Q., Wigmann, C., Schneider, A., & Schikowski, T. (2022). The effect of air pollution when modified by temperature on respiratory health outcomes: A systematic review and meta-analysis. Science of the Total Environment, 811, 152336. https://doi.org/10.1016/j.scitotenv.2021.152336 source
plainstates a cause- Asserted: passes — The authors put it forward as true.
- Checkable: passes — It can be checked against evidence.
- Load-bearing: unclear — It is unclear whether the paper’s conclusions depend on it.
- Based: passes — The paper gives a reason why it holds.
It may state two separate claims as one.
In the paper
“These studies confirm results from human and other animal studies that air pollutants can enter a pregnant female’s circulatory system and exert many deleterious health effects in multiple body organs including the placenta and the developing fetus [111].”
§ Changes in tropospheric air quality related to the protection of stratospheric ozone in a changing climate > UV-dependent air pollutants and their effects on human health, plants, and the self-cleaning capacity of the troposphere > Health impacts of photochemical smog
What the sources say
- Not checked yetcites [111] Costello, J. M., Steurer, M. A., Baer, R. J., Witte, J. S., & Jelliffe-Pawlowski, L. L. (2022). Residential particulate matter, proximity to major roads, traffic density and traffic volume as risk factors for preterm birth in California. Paediatric and Perinatal Epidemiology, 36(1), 70–79. https://doi.org/10.1111/ppe.12820 source
plainstates a cause- Asserted: passes — The authors put it forward as true.
- Checkable: passes — It can be checked against evidence.
- Load-bearing: unclear — It is unclear whether the paper’s conclusions depend on it.
- Based: passes — The paper gives a reason why it holds.
It may state two separate claims as one.
None of the sources cited for this claim have been checked yet.
In the paper
“Photochemical air pollution can damage plants, with potentially adverse effects on agriculture and other natural resources.”
§ Changes in tropospheric air quality related to the protection of stratospheric ozone in a changing climate > UV-dependent air pollutants and their effects on human health, plants, and the self-cleaning capacity of the troposphere > Effects of tropospheric ozone and particulates on plants
What the sources say
- Not checked yetcites [78] Lefohn, A. S., Malley, C. S., Smith, L., Wells, B., Hazucha, M., Simon, H., Naik, V., Mills, G., Schultz, M. G., Paoletti, E., De Marco, A., Xu, X., Zhang, L., Wang, T., Neufeld, H. S., Musselman, R. C., Tarasick, D., Brauer, M., Feng, Z., Tang, H., et al. (2018). Tropospheric ozone assessment report: Global ozone metrics for climate change, human health, and crop/ecosystem research. Elementa: Science of the Anthropocene, 6, 27. https://doi.org/10.1525/elementa.279 source
- Not checked yetcites [116] Paoletti, E., Feng, Z., De Marco, A., Hoshika, Y., Harmens, H., Agathokleous, E., Domingos, M., Mills, G., Sicard, P., Zhang, L., & Carrari, E. (2020). Challenges, gaps and opportunities in investigating the interactions of ozone pollution and plant ecosystems. Science of the Total Environment, 709, 136188. https://doi.org/10.1016/j.scitotenv.2019.136188 source
plainstates a cause- Asserted: passes — The authors put it forward as true.
- Checkable: passes — It can be checked against evidence.
- Load-bearing: fails — The paper’s conclusions may not depend on it.
- Based: passes — The paper gives a reason why it holds.
Probably not a substantial claim. The paper’s conclusions may not depend on it. It may state two separate claims as one.
In the paper
“Estimated decreases in the annual national production of firewood, timber for poles, roundwood and wood for pulp and paper were 7.5, 7.4, 5.0, and 4.8%, respectively.”
§ Changes in tropospheric air quality related to the protection of stratospheric ozone in a changing climate > UV-dependent air pollutants and their effects on human health, plants, and the self-cleaning capacity of the troposphere > Effects of tropospheric ozone and particulates on plants
What the sources say
- Not checked yetcites [127] Sacchelli, S., Carrari, E., Paoletti, E., Anav, A., Hoshika, Y., Sicard, P., Screpanti, A., Chirici, G., Cocozza, C., & De Marco, A. (2021). Economic impacts of ambient ozone pollution on wood production in Italy. Scientific Reports, 11(1), 1–9. https://doi.org/10.1038/s41598-020-80516-6 source
hedgedstates a cause- Asserted: passes — The authors put it forward as true.
- Checkable: passes — It can be checked against evidence.
- Load-bearing: unclear — It is unclear whether the paper’s conclusions depend on it.
- Based: passes — The paper gives a reason why it holds.
It may state two separate claims as one.
In the paper
“Ozone enters the leaf of the plant through the stomata and forms ROS, which include O2•−, H2O2, OH, 1O2, as well as reactive carbonyl species such as malondialdehyde and methylglyoxal [131].”
§ Changes in tropospheric air quality related to the protection of stratospheric ozone in a changing climate > UV-dependent air pollutants and their effects on human health, plants, and the self-cleaning capacity of the troposphere > Effects of tropospheric ozone and particulates on plants
What the sources say
- Not checked yetcites [131] Oksanen, E., & Kontunen-Soppela, S. (2021). Plants have different strategies to defend against air pollutants. Current Opinion in Environmental Science & Health, 19, 100222. https://doi.org/10.1016/j.coesh.2020.10.010 source
plainstates a cause- Asserted: passes — The authors put it forward as true.
- Checkable: passes — It can be checked against evidence.
- Load-bearing: unclear — It is unclear whether the paper’s conclusions depend on it.
- Based: passes — The paper gives a reason why it holds.
It may state two separate claims as one.
A conclusion the paper draws from its own results — it cites no other source for it, so there is none to check. The quote shows it is in the paper.
In the paper
“Clearly, tropospheric O3 has significant adverse effects on food security in some countries and this might be exacerbated in the event of super-recovery of stratospheric ozone.”
§ Changes in tropospheric air quality related to the protection of stratospheric ozone in a changing climate > UV-dependent air pollutants and their effects on human health, plants, and the self-cleaning capacity of the troposphere > Effects of tropospheric ozone and particulates on plants
boostedstates a possible cause- Asserted: passes — The authors put it forward as true.
- Checkable: passes — It can be checked against evidence.
- Load-bearing: passes — The paper’s conclusions depend on it.
- Based: passes — The paper gives a reason why it holds.
It may state two separate claims as one.
In the paper
“In a study in Argentina [119], exposures of soybeans (a sensitive crop) to O3 at a concentration of 274 μg m−3 for 7 days resulted in a reduction in below-ground biomass of 25%, a 30% reduction of nodule biomass, and a 21% reduction of biological nitrogen fixation.”
§ Changes in tropospheric air quality related to the protection of stratospheric ozone in a changing climate > UV-dependent air pollutants and their effects on human health, plants, and the self-cleaning capacity of the troposphere > Effects of tropospheric ozone and particulates on plants
What the sources say
- Not checked yetcites [119] Biancari, L., Cerrotta, C., Menéndez, A. I., Gundel, P. E., & Martínez-Ghersa, M. A. (2021). Episodes of high tropospheric ozone reduce nodulation, seed production and quality in soybean (Glycine max (L.) merr.) on low fertility soils. Environmental Pollution, 269, 116117. https://doi.org/10.1016/j.envpol.2020.116117 source
plainstates a causeSingle case- Asserted: passes — The authors put it forward as true.
- Checkable: passes — It can be checked against evidence.
- Load-bearing: unclear — It is unclear whether the paper’s conclusions depend on it.
- Based: passes — The paper gives a reason why it holds.
It may state two separate claims as one.
In the paper
“Based on a 4-year average of tropospheric concentration of O3, estimated losses in wheat were 50 million tons per year, mostly in winter wheat (48 million tons); 21 million tons in rice; 18 million tons in maize and 1.6 million tons in soybeans [123].”
§ Changes in tropospheric air quality related to the protection of stratospheric ozone in a changing climate > UV-dependent air pollutants and their effects on human health, plants, and the self-cleaning capacity of the troposphere > Effects of tropospheric ozone and particulates on plants
What the sources say
- Not checked yetcites [123] Wang, Y., Wild, O., Ashworth, K., Chen, X., Wu, Q., Qi, Y., & Wang, Z. (2022). Reductions in crop yields across China from elevated ozone. Environmental Pollution, 292(Pt A), 118218. https://doi.org/10.1016/j.envpol.2021.118218 source
hedgedstates a cause- Asserted: passes — The authors put it forward as true.
- Checkable: passes — It can be checked against evidence.
- Load-bearing: passes — The paper’s conclusions depend on it.
- Based: passes — The paper gives a reason why it holds.
It may state two separate claims as one.
In the paper
“O3 could also interfere with sensory organs and the ability of pollinators to sense sources of nectar or the ability of biological-control organisms to sense their target hosts [134].”
§ Changes in tropospheric air quality related to the protection of stratospheric ozone in a changing climate > UV-dependent air pollutants and their effects on human health, plants, and the self-cleaning capacity of the troposphere > Effects of tropospheric ozone and particulates on plants
What the sources say
- Not checked yetcites [134] Blande, J. D. (2021). Effects of air pollution on plant–insect interactions mediated by olfactory and visual cues. Current Opinion in Environmental Science & Health, 19, 100228. https://doi.org/10.1016/j.coesh.2020.100228 source
hedgedstates a possible cause- Asserted: passes — The authors put it forward as true.
- Checkable: passes — It can be checked against evidence.
- Load-bearing: unclear — It is unclear whether the paper’s conclusions depend on it.
- Based: passes — The paper gives a reason why it holds.
It may state two separate claims as one.
In the paper
“We noted that tropospheric O3 could contribute to significant losses in quality and yield of crops, e.g., 10–36% for wheat and 7–24% for rice.”
§ Changes in tropospheric air quality related to the protection of stratospheric ozone in a changing climate > UV-dependent air pollutants and their effects on human health, plants, and the self-cleaning capacity of the troposphere > Effects of tropospheric ozone and particulates on plants
What the sources say
- Not checked yetcites [6] Wilson, S. R., Madronich, S., Longstreth, J. D., & Solomon, K. R. (2019). Interactive effects of changing stratospheric ozone and climate on tropospheric composition and air quality, and the consequences for human and ecosystem health. Photochemical & Photobiological Sciences, 18, 775–803. https://doi.org/10.1039/c8pp90064g source
hedgedstates a possible cause- Asserted: passes — The authors put it forward as true.
- Checkable: passes — It can be checked against evidence.
- Load-bearing: fails — The paper’s conclusions may not depend on it.
- Based: passes — The paper gives a reason why it holds.
Probably not a substantial claim. The paper’s conclusions may not depend on it.
In the paper
“Similar effects were echoed in other grape-growing regions across the globe [126].”
§ Changes in tropospheric air quality related to the protection of stratospheric ozone in a changing climate > UV-dependent air pollutants and their effects on human health, plants, and the self-cleaning capacity of the troposphere > Effects of tropospheric ozone and particulates on plants
What the sources say
- Not checked yetcites [126] Blanco-Ward, D., Ribeiro, A., Paoletti, E., & Miranda, A. (2021). Assessment of tropospheric ozone phytotoxic effects on the grapevine (Vitis vinifera L.): A review. Atmospheric Environment, 244, 117924. https://doi.org/10.1016/j.atmosenv.2020.117924 source
plainstates an association- Asserted: passes — The authors put it forward as true.
- Checkable: passes — It can be checked against evidence.
- Load-bearing: fails — The paper’s conclusions may not depend on it.
- Based: passes — The paper gives a reason why it holds.
Probably not a substantial claim. The paper’s conclusions may not depend on it.
In the paper
“Results suggested that, at the greatest air-borne exposure, development of the tadpole was delayed and that susceptibility to Bd was increased.”
§ Changes in tropospheric air quality related to the protection of stratospheric ozone in a changing climate > UV-dependent air pollutants and their effects on human health, plants, and the self-cleaning capacity of the troposphere > Effects of tropospheric ozone and particulates on plants
What the sources say
- Not checked yetcites [130] Bosch, J., Elvira, S., Sausor, C., Bielby, J., Gonzalez-Fernandez, I., Alonso, R., & Bermejo-Bermejo, V. (2021). Increased tropospheric ozone levels enhance pathogen infection levels of amphibians. Science of the Total Environment, 759, 143461. https://doi.org/10.1016/j.scitotenv.2020.143461 source
hedgedstates a possible cause- Asserted: passes — The authors put it forward as true.
- Checkable: passes — It can be checked against evidence.
- Load-bearing: unclear — It is unclear whether the paper’s conclusions depend on it.
- Based: passes — The paper gives a reason why it holds.
It may state two separate claims as one.
In the paper
“These reaction products damage components of the cells but also stimulate signaling systems, such as the release of isoprene [132] to activate defense mechanisms.”
§ Changes in tropospheric air quality related to the protection of stratospheric ozone in a changing climate > UV-dependent air pollutants and their effects on human health, plants, and the self-cleaning capacity of the troposphere > Effects of tropospheric ozone and particulates on plants
What the sources say
- Not checked yetcites [132] Li, S., Yuan, X., Feng, Z., Du, Y., Agathokleous, E., & Paoletti, E. (2022). Whole-plant compensatory responses of isoprene emission from hybrid poplar seedlings exposed to elevated ozone. Science of the Total Environment, 806(Pt 4), 150949. https://doi.org/10.1016/j.scitotenv.2021.150949 source
plainstates a cause- Asserted: passes — The authors put it forward as true.
- Checkable: passes — It can be checked against evidence.
- Load-bearing: unclear — It is unclear whether the paper’s conclusions depend on it.
- Based: passes — The paper gives a reason why it holds.
It may state two separate claims as one.
In the paper
“Because of this, the total phytotoxic dose of O3 taken up by trees over the season has increased and outweighs the benefits of a decrease in concentration of tropospheric O3 (1.6%) that resulted from measures to control pollution between 2000 and 2014.”
§ Changes in tropospheric air quality related to the protection of stratospheric ozone in a changing climate > UV-dependent air pollutants and their effects on human health, plants, and the self-cleaning capacity of the troposphere > Effects of tropospheric ozone and particulates on plants
What the sources say
- Not checked yetcites [129] Anav, A., De Marco, A., Friedlingstein, P., Savi, F., Sicard, P., Sitch, S., Vitale, M., & Paoletti, E. (2019). Growing season extension affects ozone uptake by European forests. Science of the Total Environment, 669, 1043–1052. https://doi.org/10.1016/j.scitotenv.2019.03.020 source
plainstates a cause- Asserted: passes — The authors put it forward as true.
- Checkable: passes — It can be checked against evidence.
- Load-bearing: passes — The paper’s conclusions depend on it.
- Based: passes — The paper gives a reason why it holds.
It may state two separate claims as one.
A conclusion the paper draws from its own results — it cites no other source for it, so there is none to check. The quote shows it is in the paper.
In the paper
“These impacts could affect both food security and forests.”
§ Changes in tropospheric air quality related to the protection of stratospheric ozone in a changing climate > UV-dependent air pollutants and their effects on human health, plants, and the self-cleaning capacity of the troposphere > Effects of tropospheric ozone and particulates on plants
hedgedstates a possible cause- Asserted: passes — The authors put it forward as true.
- Checkable: passes — It can be checked against evidence.
- Load-bearing: unclear — It is unclear whether the paper’s conclusions depend on it.
- Based: passes — The paper gives a reason why it holds.
It may state two separate claims as one.
A conclusion the paper draws from its own results — it cites no other source for it, so there is none to check. The quote shows it is in the paper.
In the paper
“This could be offset by further reductions in NO and VOC emissions, so the actual O3 concentrations will depend on local and regional air quality control measures, as well as the impacts of climate change and the Montreal Protocol on stratospheric O3.”
§ Changes in tropospheric air quality related to the protection of stratospheric ozone in a changing climate > UV-dependent air pollutants and their effects on human health, plants, and the self-cleaning capacity of the troposphere > Effects of tropospheric ozone and particulates on plants
hedgedstates a possible cause- Asserted: passes — The authors put it forward as true.
- Checkable: passes — It can be checked against evidence.
- Load-bearing: passes — The paper’s conclusions depend on it.
- Based: passes — The paper gives a reason why it holds.
It may state two separate claims as one.
In the paper
“Other air pollutants co-produced with O3, e.g., peroxyacetyl nitrate (CH3C(O)O2NO2) are also phytotoxic, although their specific effects are difficult to separate from those of O3 [117].”
§ Changes in tropospheric air quality related to the protection of stratospheric ozone in a changing climate > UV-dependent air pollutants and their effects on human health, plants, and the self-cleaning capacity of the troposphere > Effects of tropospheric ozone and particulates on plants
What the sources say
- Not checked yetcites [117] Gaffney, J. S., & Marley, N. A. (2021). The impacts of peroxyacetyl nitrate in the atmosphere of megacities and large urban areas: A historical perspective. ACS Earth and Space Chemistry, 5(8), 1829–1841 source
plainstates a cause- Asserted: passes — The authors put it forward as true.
- Checkable: passes — It can be checked against evidence.
- Load-bearing: unclear — It is unclear whether the paper’s conclusions depend on it.
- Based: passes — The paper gives a reason why it holds.
It may state two separate claims as one.
In the paper
“The authors exposed tadpoles of the midwife toad (Alytes obstetricans) to air-borne O3 at concentration up to 180–220 µg m−3 for 8 h per day from an early stage of development (limbs not yet formed) to metamorphosis.”
§ Changes in tropospheric air quality related to the protection of stratospheric ozone in a changing climate > UV-dependent air pollutants and their effects on human health, plants, and the self-cleaning capacity of the troposphere > Effects of tropospheric ozone and particulates on plants
What the sources say
- Not checked yetcites [130] Bosch, J., Elvira, S., Sausor, C., Bielby, J., Gonzalez-Fernandez, I., Alonso, R., & Bermejo-Bermejo, V. (2021). Increased tropospheric ozone levels enhance pathogen infection levels of amphibians. Science of the Total Environment, 759, 143461. https://doi.org/10.1016/j.scitotenv.2020.143461 source
plain- Asserted: passes — The authors put it forward as true.
- Checkable: passes — It can be checked against evidence.
- Load-bearing: fails — The paper’s conclusions may not depend on it.
- Based: passes — The paper gives a reason why it holds.
Probably not a substantial claim. The paper’s conclusions may not depend on it.
None of the sources cited for this claim have been checked yet.
In the paper
“These defenses include physical actions, such as closure of the stomata, biochemical responses such as the release of superoxide dismutase, catalase, and peroxidases to destroy the ROS, and release of chemical buffers, such as ascorbic acid, glutathione, phenolic chemicals, flavonoids, proline [133], and other amino acids, carotenoids, tocopherols, polyamines, and sugars [131].”
§ Changes in tropospheric air quality related to the protection of stratospheric ozone in a changing climate > UV-dependent air pollutants and their effects on human health, plants, and the self-cleaning capacity of the troposphere > Effects of tropospheric ozone and particulates on plants
What the sources say
- Not checked yetcites [131] Oksanen, E., & Kontunen-Soppela, S. (2021). Plants have different strategies to defend against air pollutants. Current Opinion in Environmental Science & Health, 19, 100222. https://doi.org/10.1016/j.coesh.2020.10.010 source
- Not checked yetcites [133] Boublin, F., Cabassa-Hourton, C., Leymarie, J., & Leitao, L. (2021). Potential involvement of proline and flavonols in plant responses to ozone. Environmental Research, 207, 112214. https://doi.org/10.1016/j.envres.2021.112214 source
plainstates a cause- Asserted: passes — The authors put it forward as true.
- Checkable: passes — It can be checked against evidence.
- Load-bearing: fails — The paper’s conclusions may not depend on it.
- Based: passes — The paper gives a reason why it holds.
Probably not a substantial claim. The paper’s conclusions may not depend on it. It may state two separate claims as one.
None of the sources cited for this claim have been checked yet.
In the paper
“VSLSs are important pollutants since they can reach the lower stratosphere, despite their tropospheric lifetime of less than 6 months, and contribute to depletion of stratospheric O3 [148, 149].”
§ Changes in tropospheric air quality related to the protection of stratospheric ozone in a changing climate > UV-dependent air pollutants and their effects on human health, plants, and the self-cleaning capacity of the troposphere > Self-cleaning capacity of the atmosphere
What the sources say
- Not checked yetcites [148] Fang, X. K., Pyle, J. A., Chipperfield, M. P., Daniel, J. S., Park, S., & Prinn, R. G. (2019). Challenges for the recovery of the ozone layer. Nature Geoscience, 12(8), 592–596. https://doi.org/10.1038/s41561-019-0422-7 source
- Not checked yetcites [149] Keber, T., Bonisch, H., Hartick, C., Hauck, M., Lefrancois, F., Obersteiner, F., Ringsdorf, A., Schohl, N., Schuck, T., Hossaini, R., Graf, P., Jockel, P., & Engel, A. (2020). Bromine from short-lived source gases in the extratropical northern hemispheric upper troposphere and lower stratosphere (UTLS). Atmospheric Chemistry and Physics, 20(7), 4105–4132. https://doi.org/10.5194/acp-20-4105-2020 source
plainstates a cause- Asserted: passes — The authors put it forward as true.
- Checkable: passes — It can be checked against evidence.
- Load-bearing: unclear — It is unclear whether the paper’s conclusions depend on it.
- Based: passes — The paper gives a reason why it holds.
It may state two separate claims as one.
In the paper
“The authors suggested that this was because of the effect of dimming of photosynthetically active radiation by aerosols but that there were some benefits from cooling and nutrients provided via the aerosols.”
§ Changes in tropospheric air quality related to the protection of stratospheric ozone in a changing climate > UV-dependent air pollutants and their effects on human health, plants, and the self-cleaning capacity of the troposphere > Effects of tropospheric ozone and particulates on plants
What the sources say
- Not checked yetcites [124] Zhang, T., Yue, X., Unger, N., Feng, Z., Zheng, B., Li, T., Lei, Y., Zhou, H., Dong, X., & Liu, Y. (2021). Modeling the joint impacts of ozone and aerosols on crop yields in China: An air pollution policy scenario analysis. Atmospheric Environment, 247, 118216. https://doi.org/10.1016/j.atmosenv.2021.118216 source
hedgedstates a cause- Asserted: passes — The authors put it forward as true.
- Checkable: passes — It can be checked against evidence.
- Load-bearing: fails — The paper’s conclusions may not depend on it.
- Based: passes — The paper gives a reason why it holds.
Probably not a substantial claim. The paper’s conclusions may not depend on it. It may state two separate claims as one.
In the paper
“For example, Rex et al. [151] found a lifetime of dibromomethane (CH2Br2) as long as 188 days inside an OH minimum zone over the West Pacific, while outside the OH minimum zone, the lifetime of CH2Br2 was 55 days.”
§ Changes in tropospheric air quality related to the protection of stratospheric ozone in a changing climate > UV-dependent air pollutants and their effects on human health, plants, and the self-cleaning capacity of the troposphere > Self-cleaning capacity of the atmosphere
What the sources say
- Not checked yetcites [151] Rex, M., Wohltmann, I., Ridder, T., Lehmann, R., Rosenlof, K., Wennberg, P., Weisenstein, D., Notholt, J., Kruger, K., Mohr, V., & Tegtmeier, S. (2014). A tropical West Pacific OH minimum and implications for stratospheric composition. Atmospheric Chemistry and Physics, 14(9), 4827–4841. https://doi.org/10.5194/acp-14-4827-2014 source
plainstates an association- Asserted: passes — The authors put it forward as true.
- Checkable: passes — It can be checked against evidence.
- Load-bearing: unclear — It is unclear whether the paper’s conclusions depend on it.
- Based: passes — The paper gives a reason why it holds.
It may state two separate claims as one.
In the paper
“Based on current levels of O3 and aerosols, their results indicated that anthropogenic aerosols reduced yield of rice and wheat by 4.6 and 4.7%, respectively.”
§ Changes in tropospheric air quality related to the protection of stratospheric ozone in a changing climate > UV-dependent air pollutants and their effects on human health, plants, and the self-cleaning capacity of the troposphere > Effects of tropospheric ozone and particulates on plants
What the sources say
- Not checked yetcites [124] Zhang, T., Yue, X., Unger, N., Feng, Z., Zheng, B., Li, T., Lei, Y., Zhou, H., Dong, X., & Liu, Y. (2021). Modeling the joint impacts of ozone and aerosols on crop yields in China: An air pollution policy scenario analysis. Atmospheric Environment, 247, 118216. https://doi.org/10.1016/j.atmosenv.2021.118216 source
hedgedstates a cause- Asserted: passes — The authors put it forward as true.
- Checkable: passes — It can be checked against evidence.
- Load-bearing: fails — The paper’s conclusions may not depend on it.
- Based: passes — The paper gives a reason why it holds.
Probably not a substantial claim. The paper’s conclusions may not depend on it.
In the paper
“In a study of water-extractable chemicals collected from PM2.5 samplers on roadsides in Hungary, 13 common roadside plants were tested for sensitivity using the OECD-227 guideline test [139].”
§ Changes in tropospheric air quality related to the protection of stratospheric ozone in a changing climate > UV-dependent air pollutants and their effects on human health, plants, and the self-cleaning capacity of the troposphere > Effects of tropospheric ozone and particulates on plants
What the sources say
- Not checked yetcites [139] Kováts, N., Hubai, K., Diósi, D., Sainnokhoi, T.-A., Hoffer, A., Tóth, Á., & Teke, G. (2021). Sensitivity of typical European roadside plants to atmospheric particulate matter. Ecological Indicators, 124, 107428. https://doi.org/10.1016/j.ecolind.2021.107428 source
plain- Asserted: passes — The authors put it forward as true.
- Checkable: passes — It can be checked against evidence.
- Load-bearing: fails — The paper’s conclusions may not depend on it.
- Based: passes — The paper gives a reason why it holds.
Probably not a substantial claim. The paper’s conclusions may not depend on it.
In the paper
“The main precursor of tropospheric O3 is NOx, the tropospheric concentration of which has increased over 1980–2010 (Fig. 6).”
§ Changes in tropospheric air quality related to the protection of stratospheric ozone in a changing climate > UV-dependent air pollutants and their effects on human health, plants, and the self-cleaning capacity of the troposphere > Self-cleaning capacity of the atmosphere
What the sources say
- Not checked yetcites [141] Stevenson, D. S., Zhao, A., Naik, V., O’Connor, F. M., Tilmes, S., Zeng, G., Murray, L. T., Collins, W. J., Griffiths, P. T., Shim, S. B., Horowitz, L. W., Sentman, L. T., & Emmons, L. (2020). Trends in global tropospheric hydroxyl radical and methane lifetime since 1850 from AerChemMIP. Atmospheric Chemistry and Physics, 20(21), 12905–12920. https://doi.org/10.5194/acp-20-12905-2020 source
plainstates a cause- Asserted: passes — The authors put it forward as true.
- Checkable: passes — It can be checked against evidence.
- Load-bearing: passes — The paper’s conclusions depend on it.
- Based: passes — The paper gives a reason why it holds.
It may state two separate claims as one.
In the paper
“If emissions of CH4 from anthropogenic and natural sources continue to rise as they have since 2007, this could decrease global mean OH by up to 10% by 2050 [147], increasing the atmospheric lifetime and concentrations of CH4 in a positive feedback.”
§ Changes in tropospheric air quality related to the protection of stratospheric ozone in a changing climate > UV-dependent air pollutants and their effects on human health, plants, and the self-cleaning capacity of the troposphere > Self-cleaning capacity of the atmosphere
What the sources say
- Not checked yetcites [147] Turner, A. J., Frankenberg, C., & Kort, E. A. (2019). Interpreting contemporary trends in atmospheric methane. Proceedings of the National Academy of Sciences of the United States of America, 116(8), 2805–2813. https://doi.org/10.1073/pnas.1814297116 source
hedgedstates a possible cause- Asserted: passes — The authors put it forward as true.
- Checkable: passes — It can be checked against evidence.
- Load-bearing: passes — The paper’s conclusions depend on it.
- Based: passes — The paper gives a reason why it holds.
It may state two separate claims as one.
In the paper
“Economic yield was reduced 34% in wheat exposed to O3 and PM, 44% in wheat exposed to PM only and 52% in plants exposed to O3 alone.”
§ Changes in tropospheric air quality related to the protection of stratospheric ozone in a changing climate > UV-dependent air pollutants and their effects on human health, plants, and the self-cleaning capacity of the troposphere > Effects of tropospheric ozone and particulates on plants
What the sources say
- Not checked yetcites [140] Mina, U., Smiti, K., & Yadav, P. (2021). Thermotolerant wheat cultivar (Triticum aestivum L. var. WR544) response to ozone, EDU, and particulate matter interactive exposure. Environmental Monitoring and Assessment, 193(6), 1–16. https://doi.org/10.1007/s10661-021-09079-x source
plainstates a cause- Asserted: passes — The authors put it forward as true.
- Checkable: passes — It can be checked against evidence.
- Load-bearing: unclear — It is unclear whether the paper’s conclusions depend on it.
- Based: passes — The paper gives a reason why it holds.
It may state two separate claims as one.
In the paper
“Due to the Montreal Protocol and its Amendments, atmospheric mole fractions of CH3Br have declined considerably and, at present, emissions of CH3Br primarily stem from natural sources [152], with some anthropogenic sources related to commercial quarantine and pre-shipment applications.”
§ Changes in tropospheric air quality related to the protection of stratospheric ozone in a changing climate > UV-dependent air pollutants and their effects on human health, plants, and the self-cleaning capacity of the troposphere > Self-cleaning capacity of the atmosphere
What the sources say
- Not checked yetcites [152] Nicewonger, M. R., Saltzman, E. S., & Montzka, S. A. (2022). ENSO-driven fires cause large interannual variability in the naturally emitted, ozone-depleting trace gas CH3Br. Geophysical Research Letters, 49, e2021GL09475. https://doi.org/10.1029/2021GL094756 source
plainstates a cause- Asserted: passes — The authors put it forward as true.
- Checkable: passes — It can be checked against evidence.
- Load-bearing: unclear — It is unclear whether the paper’s conclusions depend on it.
- Based: passes — The paper gives a reason why it holds.
It may state two separate claims as one.
In the paper
“Cl-VSLSs are mostly of anthropogenic origin, while I-VSLSs and Br-VSLSs, particularly bromoform (CHBr3) and dibromomethane (CH2Br2) are mainly produced in biotic processes and are affected by climate change, including increased coastal runoff and thawing of permafrost [148].”
§ Changes in tropospheric air quality related to the protection of stratospheric ozone in a changing climate > UV-dependent air pollutants and their effects on human health, plants, and the self-cleaning capacity of the troposphere > Self-cleaning capacity of the atmosphere
What the sources say
- Not checked yetcites [148] Fang, X. K., Pyle, J. A., Chipperfield, M. P., Daniel, J. S., Park, S., & Prinn, R. G. (2019). Challenges for the recovery of the ozone layer. Nature Geoscience, 12(8), 592–596. https://doi.org/10.1038/s41561-019-0422-7 source
plainstates an association- Asserted: passes — The authors put it forward as true.
- Checkable: passes — It can be checked against evidence.
- Load-bearing: unclear — It is unclear whether the paper’s conclusions depend on it.
- Based: passes — The paper gives a reason why it holds.
It may state two separate claims as one.
In the paper
“However, the interannual variability in OH from these studies was large, i.e., the difference between modeled and measured OH trends were not statistically significant [141].”
§ Changes in tropospheric air quality related to the protection of stratospheric ozone in a changing climate > UV-dependent air pollutants and their effects on human health, plants, and the self-cleaning capacity of the troposphere > Self-cleaning capacity of the atmosphere
What the sources say
- Not checked yetcites [141] Stevenson, D. S., Zhao, A., Naik, V., O’Connor, F. M., Tilmes, S., Zeng, G., Murray, L. T., Collins, W. J., Griffiths, P. T., Shim, S. B., Horowitz, L. W., Sentman, L. T., & Emmons, L. (2020). Trends in global tropospheric hydroxyl radical and methane lifetime since 1850 from AerChemMIP. Atmospheric Chemistry and Physics, 20(21), 12905–12920. https://doi.org/10.5194/acp-20-12905-2020 source
plain- Asserted: passes — The authors put it forward as true.
- Checkable: passes — It can be checked against evidence.
- Load-bearing: unclear — It is unclear whether the paper’s conclusions depend on it.
- Based: passes — The paper gives a reason why it holds.
It may state two separate claims as one.
In the paper
“However, in the period 1980–2010 the modeled global tropospheric concentration of OH has increased, mainly because of increasing concentrations of precursors of tropospheric O3, and UV radiation [141].”
§ Changes in tropospheric air quality related to the protection of stratospheric ozone in a changing climate > UV-dependent air pollutants and their effects on human health, plants, and the self-cleaning capacity of the troposphere > Self-cleaning capacity of the atmosphere
What the sources say
- Not checked yetcites [141] Stevenson, D. S., Zhao, A., Naik, V., O’Connor, F. M., Tilmes, S., Zeng, G., Murray, L. T., Collins, W. J., Griffiths, P. T., Shim, S. B., Horowitz, L. W., Sentman, L. T., & Emmons, L. (2020). Trends in global tropospheric hydroxyl radical and methane lifetime since 1850 from AerChemMIP. Atmospheric Chemistry and Physics, 20(21), 12905–12920. https://doi.org/10.5194/acp-20-12905-2020 source
plainstates a cause- Asserted: passes — The authors put it forward as true.
- Checkable: passes — It can be checked against evidence.
- Load-bearing: passes — The paper’s conclusions depend on it.
- Based: passes — The paper gives a reason why it holds.
It may state two separate claims as one.
None of the sources cited for this claim have been checked yet.
In the paper
“The effects of PM on plants were previously assessed to be few and minor [5, 6], but new studies suggest they may be important particularly in polluted areas.”
§ Changes in tropospheric air quality related to the protection of stratospheric ozone in a changing climate > UV-dependent air pollutants and their effects on human health, plants, and the self-cleaning capacity of the troposphere > Effects of tropospheric ozone and particulates on plants
What the sources say
- Not checked yetcites [5] Madronich, S., Shao, M., Wilson, S. R., Solomon, K. R., Longstreth, J. D., & Tang, X. Y. (2015). Changes in air quality and tropospheric composition due to depletion of stratospheric ozone and interactions with changing climate: Implications for human and environmental health. Photochemical & Photobiological Sciences, 14, 149–169. https://doi.org/10.1039/c4pp90037e source
- Not checked yetcites [6] Wilson, S. R., Madronich, S., Longstreth, J. D., & Solomon, K. R. (2019). Interactive effects of changing stratospheric ozone and climate on tropospheric composition and air quality, and the consequences for human and ecosystem health. Photochemical & Photobiological Sciences, 18, 775–803. https://doi.org/10.1039/c8pp90064g source
hedgedstates a possible cause- Asserted: passes — The authors put it forward as true.
- Checkable: passes — It can be checked against evidence.
- Load-bearing: unclear — It is unclear whether the paper’s conclusions depend on it.
- Based: passes — The paper gives a reason why it holds.
It may state two separate claims as one.
In the paper
“The authors concluded that particulate pollution derived from traffic added substantial additional stress to communities of plants found on roadsides.”
§ Changes in tropospheric air quality related to the protection of stratospheric ozone in a changing climate > UV-dependent air pollutants and their effects on human health, plants, and the self-cleaning capacity of the troposphere > Effects of tropospheric ozone and particulates on plants
What the sources say
- Not checked yetcites [139] Kováts, N., Hubai, K., Diósi, D., Sainnokhoi, T.-A., Hoffer, A., Tóth, Á., & Teke, G. (2021). Sensitivity of typical European roadside plants to atmospheric particulate matter. Ecological Indicators, 124, 107428. https://doi.org/10.1016/j.ecolind.2021.107428 source
plainstates a cause- Asserted: passes — The authors put it forward as true.
- Checkable: passes — It can be checked against evidence.
- Load-bearing: fails — The paper’s conclusions may not depend on it.
- Based: passes — The paper gives a reason why it holds.
Probably not a substantial claim. The paper’s conclusions may not depend on it.
In the paper
“The production of CH3Br in seawater is a biological process mediated by phytoplankton such as diatoms [153].”
§ Changes in tropospheric air quality related to the protection of stratospheric ozone in a changing climate > UV-dependent air pollutants and their effects on human health, plants, and the self-cleaning capacity of the troposphere > Self-cleaning capacity of the atmosphere
What the sources say
- Not checked yetcites [153] Liu, S. S., Yang, G. P., He, Z., Gao, X. X., & Xu, F. (2021). Oceanic emissions of methyl halides and effect of nutrients concentration on their production: A case of the western Pacific Ocean (2 degrees N to 24 degrees N). Science of the Total Environment, 769, 144488. https://doi.org/10.1016/j.scitotenv.2020.144488 source
plainstates a cause- Asserted: passes — The authors put it forward as true.
- Checkable: passes — It can be checked against evidence.
- Load-bearing: fails — The paper’s conclusions may not depend on it.
- Based: passes — The paper gives a reason why it holds.
Probably not a substantial claim. The paper’s conclusions may not depend on it.
In the paper
“The study was conducted during mid-winter and near sources, implying that most of the PM was primary rather than secondary, and hence insensitive to any changes in UV radiation.”
§ Changes in tropospheric air quality related to the protection of stratospheric ozone in a changing climate > UV-dependent air pollutants and their effects on human health, plants, and the self-cleaning capacity of the troposphere > Effects of tropospheric ozone and particulates on plants
What the sources say
- Not checked yetcites [139] Kováts, N., Hubai, K., Diósi, D., Sainnokhoi, T.-A., Hoffer, A., Tóth, Á., & Teke, G. (2021). Sensitivity of typical European roadside plants to atmospheric particulate matter. Ecological Indicators, 124, 107428. https://doi.org/10.1016/j.ecolind.2021.107428 source
plain- Asserted: passes — The authors put it forward as true.
- Checkable: passes — It can be checked against evidence.
- Load-bearing: unclear — It is unclear whether the paper’s conclusions depend on it.
- Based: passes — The paper gives a reason why it holds.
It may state two separate claims as one.
A conclusion the paper draws from its own results — it cites no other source for it, so there is none to check. The quote shows it is in the paper.
In the paper
“The loss from O3 is greater than that from aerosols but they do act additively.”
§ Changes in tropospheric air quality related to the protection of stratospheric ozone in a changing climate > UV-dependent air pollutants and their effects on human health, plants, and the self-cleaning capacity of the troposphere > Effects of tropospheric ozone and particulates on plants
plainstates a cause- Asserted: passes — The authors put it forward as true.
- Checkable: passes — It can be checked against evidence.
- Load-bearing: passes — The paper’s conclusions depend on it.
- Based: passes — The paper gives a reason why it holds.
It may state two separate claims as one.
A conclusion the paper draws from its own results — it cites no other source for it, so there is none to check. The quote shows it is in the paper.
In the paper
“However, it is likely that these effects will be localized and could be mitigated by increased controls of tropospheric air pollutants.”
§ Changes in tropospheric air quality related to the protection of stratospheric ozone in a changing climate > UV-dependent air pollutants and their effects on human health, plants, and the self-cleaning capacity of the troposphere > Effects of tropospheric ozone and particulates on plants
hedgedstates a possible cause- Asserted: passes — The authors put it forward as true.
- Checkable: passes — It can be checked against evidence.
- Load-bearing: passes — The paper’s conclusions depend on it.
- Based: passes — The paper gives a reason why it holds.
It may state two separate claims as one.
In the paper
“For such studies, methyl chloroform (CH3CCl3) is often used [145] to infer concentrations of OH.”
§ Changes in tropospheric air quality related to the protection of stratospheric ozone in a changing climate > UV-dependent air pollutants and their effects on human health, plants, and the self-cleaning capacity of the troposphere > Self-cleaning capacity of the atmosphere
What the sources say
- Not checked yetcites [145] Naus, S., Montzka, S. A., Patra, P. K., & Krol, M. C. (2021). A three-dimensional-model inversion of methyl chloroform to constrain the atmospheric oxidative capacity. Atmospheric Chemistry and Physics, 21(6), 4809–4824. https://doi.org/10.5194/acp-21-4809-2021 source
plainstates an association- Asserted: passes — The authors put it forward as true.
- Checkable: passes — It can be checked against evidence.
- Load-bearing: fails — The paper’s conclusions may not depend on it.
- Based: passes — The paper gives a reason why it holds.
Probably not a substantial claim. The paper’s conclusions may not depend on it.
In the paper
“Efforts are now underway to use measurements of the chemical composition of air on commercial aircraft to build up a robust climatology, which can help modeling [166].”
§ Changes in tropospheric air quality related to the protection of stratospheric ozone in a changing climate > UV-dependent air pollutants and their effects on human health, plants, and the self-cleaning capacity of the troposphere > Changes in atmospheric circulation and transport of pollutants
What the sources say
- Not checked yetcites [166] Cohen, Y., Marecal, V., Josse, B., & Thouret, V. (2021). Interpol-IAGOS: A new method for assessing long-term chemistry-climate simulations in the UTLS based on IAGOS data, and its application to the MOCAGE CCMI REF-C1SD simulation. Geoscientific Model Development, 14(5), 2659–2689. https://doi.org/10.5194/gmd-14-2659-2021 source
plain- Asserted: passes — The authors put it forward as true.
- Checkable: passes — It can be checked against evidence.
- Load-bearing: fails — The paper’s conclusions may not depend on it.
- Based: passes — The paper gives a reason why it holds.
Probably not a substantial claim. The paper’s conclusions may not depend on it.
None of the sources cited for this claim have been checked yet.
In the paper
“These folds are not uniformly distributed longitudinally [162, 163] and are common over the Eastern Mediterranean, where they have been identified as a significant cause of elevated concentrations of O3 at ground level that are greater than the European Union air-quality standards [164].”
§ Changes in tropospheric air quality related to the protection of stratospheric ozone in a changing climate > UV-dependent air pollutants and their effects on human health, plants, and the self-cleaning capacity of the troposphere > Changes in atmospheric circulation and transport of pollutants
What the sources say
- Not checked yetcites [162] Akritidis, D., Pozzer, A., Flemming, J., Inness, A., & Zanis, P. (2021). A global climatology of tropopause folds in CAMS and MERRA-2 reanalyses. Journal of Geophysical Research: Atmospheres, 126(8), e2020JD034115. https://doi.org/10.1029/2020JD034115 source
- Not checked yetcites [163] Liu, J. H., Rodriguez, J. M., Oman, L. D., Douglass, A. R., Olsen, M. A., & Hu, L. (2020). Stratospheric impact on the Northern Hemisphere winter and spring ozone interannual variability in the troposphere. Atmospheric Chemistry and Physics, 20(11), 6416–6432. https://doi.org/10.5194/acp-20-6417-2020 source
- Not checked yetcites [164] Dafka, S., Akritidis, D., Zanis, P., Pozzer, A., Xoplaki, E., Luterbacher, J., & Zerefos, C. (2021). On the link between the Etesian winds, tropopause folds and tropospheric ozone over the Eastern Mediterranean during summer. Atmospheric Research. https://doi.org/10.1016/j.atmosres.2020.105161 source
plainstates a cause- Asserted: passes — The authors put it forward as true.
- Checkable: passes — It can be checked against evidence.
- Load-bearing: unclear — It is unclear whether the paper’s conclusions depend on it.
- Based: passes — The paper gives a reason why it holds.
It may state two separate claims as one.
The paper states this without a source or data behind it here, so there is nothing to check it against. The quote shows it is in the paper.
In the paper
“Air rich in O3 is injected into the troposphere at the edges of the tropics via “folds” (Fig. 8), where thin layers of air from the stratosphere are surrounded (vertically) by air from the troposphere and vice versa.”
§ Changes in tropospheric air quality related to the protection of stratospheric ozone in a changing climate > UV-dependent air pollutants and their effects on human health, plants, and the self-cleaning capacity of the troposphere > Changes in atmospheric circulation and transport of pollutants
plainstates a cause- Asserted: passes — The authors put it forward as true.
- Checkable: passes — It can be checked against evidence.
- Load-bearing: unclear — It is unclear whether the paper’s conclusions depend on it.
- Based: passes — The paper gives a reason why it holds.
It may state two separate claims as one.
In the paper
“Similarly, there are ongoing efforts to improve the use of measurements of O3 by satellites in atmospheric modeling [167], and potentially O3 sondes and in situ measurements.”
§ Changes in tropospheric air quality related to the protection of stratospheric ozone in a changing climate > UV-dependent air pollutants and their effects on human health, plants, and the self-cleaning capacity of the troposphere > Changes in atmospheric circulation and transport of pollutants
What the sources say
- Not checked yetcites [167] Huijnen, V., Miyazaki, K., Flemming, J., Inness, A., Sekiya, T., & Schultz, M. G. (2020). An intercomparison of tropospheric ozone reanalysis products from CAMS, CAMS interim, TCR-1, and TCR-2. Geoscientific Model Development, 13(3), 1513–1544. https://doi.org/10.5194/gmd-13-1513-2020 source
plain- Asserted: passes — The authors put it forward as true.
- Checkable: passes — It can be checked against evidence.
- Load-bearing: fails — The paper’s conclusions may not depend on it.
- Based: passes — The paper gives a reason why it holds.
Probably not a substantial claim. The paper’s conclusions may not depend on it.
In the paper
“Typically, the magnitude of the STE is inferred as the difference between the calculated production and loss of O3 (termed the residual) rather than modeling STE transport itself [158].”
§ Changes in tropospheric air quality related to the protection of stratospheric ozone in a changing climate > UV-dependent air pollutants and their effects on human health, plants, and the self-cleaning capacity of the troposphere > Changes in atmospheric circulation and transport of pollutants
What the sources say
- Not checked yetcites [158] Griffiths, P. T., Murray, L. T., Zeng, G., Shin, Y. M., Abraham, N. L., Archibald, A. T., Deushi, M., Emmons, L. K., Galbally, I. E., Hassler, B., Horowitz, L. W., Keeble, J., Liu, J., Moeini, O., Naik, V., O’Connor, F. M., Oshima, N., Tarasick, D., Tilmes, S., Turnock, S. T., et al. (2021). Tropospheric ozone in CMIP6 simulations. Atmospheric Chemistry and Physics, 21(5), 4187–4218. https://doi.org/10.5194/acp-21-4187-2021 source
plain- Asserted: passes — The authors put it forward as true.
- Checkable: passes — It can be checked against evidence.
- Load-bearing: fails — The paper’s conclusions may not depend on it.
- Based: passes — The paper gives a reason why it holds.
Probably not a substantial claim. The paper’s conclusions may not depend on it.
In the paper
“In contrast, the results of a modeling and observational study of the regional changes in O3 concentration in the troposphere for the period 1980–1990 through to 2000–2010 [154] suggest an increase in the concentration of O3 at the Earth’s surface, but the other studies (noted above) found that stratospheric O3 led to a small increase over this period in the Northern Hemisphere and no significant”
§ Changes in tropospheric air quality related to the protection of stratospheric ozone in a changing climate > UV-dependent air pollutants and their effects on human health, plants, and the self-cleaning capacity of the troposphere > Changes in atmospheric circulation and transport of pollutants
What the sources say
- Not checked yetcites [154] Williams, R. S., Hegglin, M. I., Kerridge, B. J., Jöckel, P., Latter, B. G., & Plummer, D. A. (2019). Characterising the seasonal and geographical variability in tropospheric ozone, stratospheric influence and recent changes. Atmospheric Chemistry and Physics, 19(6), 3589–3620. https://doi.org/10.5194/acp-19-3589-2019 source
hedgedstates a cause- Asserted: passes — The authors put it forward as true.
- Checkable: passes — It can be checked against evidence.
- Load-bearing: fails — The paper’s conclusions may not depend on it.
- Based: passes — The paper gives a reason why it holds.
Probably not a substantial claim. The paper’s conclusions may not depend on it. It may state two separate claims as one.
None of the sources cited for this claim have been checked yet.
In the paper
“Methods for identifying folds within model output are being improved [e.g., [165] and showing some promising consistency among different models [162].”
§ Changes in tropospheric air quality related to the protection of stratospheric ozone in a changing climate > UV-dependent air pollutants and their effects on human health, plants, and the self-cleaning capacity of the troposphere > Changes in atmospheric circulation and transport of pollutants
What the sources say
- Not checked yetcites [165] Akritidis, D., Pozzer, A., & Zanis, P. (2019). On the impact of future climate change on tropopause folds and tropospheric ozone. Atmospheric Chemistry and Physics, 19(22), 14387–14401. https://doi.org/10.5194/acp-19-14387-2019 source
- Not checked yetcites [162] Akritidis, D., Pozzer, A., Flemming, J., Inness, A., & Zanis, P. (2021). A global climatology of tropopause folds in CAMS and MERRA-2 reanalyses. Journal of Geophysical Research: Atmospheres, 126(8), e2020JD034115. https://doi.org/10.1029/2020JD034115 source
plain- Asserted: passes — The authors put it forward as true.
- Checkable: passes — It can be checked against evidence.
- Load-bearing: fails — The paper’s conclusions may not depend on it.
- Based: passes — The paper gives a reason why it holds.
Probably not a substantial claim. The paper’s conclusions may not depend on it. It may state two separate claims as one.
In the paper
“When assessing the relative importance of changes in GHGs vs ODSs in driving the changes in STE, they did not obtain a consistent picture from the models, although it appears that the two factors are of similar magnitude [161].”
§ Changes in tropospheric air quality related to the protection of stratospheric ozone in a changing climate > UV-dependent air pollutants and their effects on human health, plants, and the self-cleaning capacity of the troposphere > Changes in atmospheric circulation and transport of pollutants
What the sources say
- Not checked yetcites [161] Abalos, M., Orbe, C., Kinnison, D. E., Plummer, D., Oman, L. D., Jöckel, P., Morgenstern, O., Garcia, R. R., Zeng, G., Stone, K. A., & Dameris, M. (2020). Future trends in stratosphere-to-troposphere transport in CCMI models. Atmospheric Chemistry and Physics, 20(11), 6883–6901. https://doi.org/10.5194/acp-20-6883-2020 source
hedgedstates a cause- Asserted: passes — The authors put it forward as true.
- Checkable: passes — It can be checked against evidence.
- Load-bearing: unclear — It is unclear whether the paper’s conclusions depend on it.
- Based: passes — The paper gives a reason why it holds.
It may state two separate claims as one.
In the paper
“Calculations using the RCP8.5 scenario showed a marked increase in the concentration of O3 in the troposphere, with a threefold larger amount of O3 transported from the stratosphere than the RCP6.0 scenario [161].”
§ Changes in tropospheric air quality related to the protection of stratospheric ozone in a changing climate > UV-dependent air pollutants and their effects on human health, plants, and the self-cleaning capacity of the troposphere > Changes in atmospheric circulation and transport of pollutants
What the sources say
- Not checked yetcites [161] Abalos, M., Orbe, C., Kinnison, D. E., Plummer, D., Oman, L. D., Jöckel, P., Morgenstern, O., Garcia, R. R., Zeng, G., Stone, K. A., & Dameris, M. (2020). Future trends in stratosphere-to-troposphere transport in CCMI models. Atmospheric Chemistry and Physics, 20(11), 6883–6901. https://doi.org/10.5194/acp-20-6883-2020 source
plainstates a cause- Asserted: passes — The authors put it forward as true.
- Checkable: passes — It can be checked against evidence.
- Load-bearing: unclear — It is unclear whether the paper’s conclusions depend on it.
- Based: passes — The paper gives a reason why it holds.
It may state two separate claims as one.
The paper states this without a source or data behind it here, so there is nothing to check it against. The quote shows it is in the paper.
In the paper
“A second confounding factor is that models have used different definitions of the upper boundary (tropopause) of the troposphere.”
§ Changes in tropospheric air quality related to the protection of stratospheric ozone in a changing climate > UV-dependent air pollutants and their effects on human health, plants, and the self-cleaning capacity of the troposphere > Changes in atmospheric circulation and transport of pollutants
plain- Asserted: passes — The authors put it forward as true.
- Checkable: passes — It can be checked against evidence.
- Load-bearing: fails — The paper’s conclusions may not depend on it.
- Based: passes — The paper gives a reason why it holds.
Probably not a substantial claim. The paper’s conclusions may not depend on it.
A conclusion the paper draws from its own results — it cites no other source for it, so there is none to check. The quote shows it is in the paper.
In the paper
“Quantifying the transport of O3 from the stratosphere is therefore important to understanding tropospheric air quality but remains difficult.”
§ Changes in tropospheric air quality related to the protection of stratospheric ozone in a changing climate > UV-dependent air pollutants and their effects on human health, plants, and the self-cleaning capacity of the troposphere > Changes in atmospheric circulation and transport of pollutants
plainstates an association- Asserted: passes — The authors put it forward as true.
- Checkable: passes — It can be checked against evidence.
- Load-bearing: passes — The paper’s conclusions depend on it.
- Based: passes — The paper gives a reason why it holds.
It may state two separate claims as one.
None of the sources cited for this claim have been checked yet.
In the paper
“Using observations to constrain models introduces sensitivity to changes in quality and calibration of the input data and this requires careful assessment [167, 168]”
§ Changes in tropospheric air quality related to the protection of stratospheric ozone in a changing climate > UV-dependent air pollutants and their effects on human health, plants, and the self-cleaning capacity of the troposphere > Changes in atmospheric circulation and transport of pollutants
What the sources say
- Not checked yetcites [167] Huijnen, V., Miyazaki, K., Flemming, J., Inness, A., Sekiya, T., & Schultz, M. G. (2020). An intercomparison of tropospheric ozone reanalysis products from CAMS, CAMS interim, TCR-1, and TCR-2. Geoscientific Model Development, 13(3), 1513–1544. https://doi.org/10.5194/gmd-13-1513-2020 source
- Not checked yetcites [168] Krizan, P., Kozubek, M., & Lastovicka, J. (2019). Discontinuities in the ozone concentration time series from MERRA 2 reanalysis. Atmosphere. https://doi.org/10.3390/atmos10120812 source
plainstates a cause- Asserted: passes — The authors put it forward as true.
- Checkable: passes — It can be checked against evidence.
- Load-bearing: fails — The paper’s conclusions may not depend on it.
- Based: passes — The paper gives a reason why it holds.
Probably not a substantial claim. The paper’s conclusions may not depend on it.
A conclusion the paper draws from its own results — it cites no other source for it, so there is none to check. The quote shows it is in the paper.
In the paper
“It is not possible to infer the magnitude of the changes in O3 at ground level from these models, as they report O3 concentrations averaged for the entire vertical extent of the troposphere, and the impact of stratospheric O3 is much larger in the upper troposphere than at the Earth’s surface.”
§ Changes in tropospheric air quality related to the protection of stratospheric ozone in a changing climate > UV-dependent air pollutants and their effects on human health, plants, and the self-cleaning capacity of the troposphere > Changes in atmospheric circulation and transport of pollutants
plain- Asserted: passes — The authors put it forward as true.
- Checkable: passes — It can be checked against evidence.
- Load-bearing: passes — The paper’s conclusions depend on it.
- Based: passes — The paper gives a reason why it holds.
It may state two separate claims as one.
In the paper
“The IPCC AR6 assessment reports a value of 628 ± 800 Tg year−1 for 2010, with the large uncertainty highlighting how poorly this value is known [11].”
§ Changes in tropospheric air quality related to the protection of stratospheric ozone in a changing climate > UV-dependent air pollutants and their effects on human health, plants, and the self-cleaning capacity of the troposphere > Changes in atmospheric circulation and transport of pollutants
What the sources say
- Not checked yetcites [11] Szopa, S., Naik, V., Adhikary, B., Artaxo, P., Berntsen, T., Collins, W. D., Fuzzi, S., Gallardo, L., Scharr, A. K., Klimont, Z., Liao, H., Unger, N., & Zanis, P. (2021). Short-lived climate forcers. In V. Masson-Delmotte, P. Zhai, A. Pirani, S. L. Connors, C. Péan, S. Berger, N. Caud, Y. Chen, L. Goldfarb, M. I. Gomis, M. Huang, K. Leitzell, E. Lonnoy, J. B. R. Matthews, T. K. Maycock, T. Waterfield, O. Yelekçi, R. Yu, & B. Zhou (Eds.), Climate Change 2021: The physical science basis. Contribution of Working Group I to the Sixth Assessment Report of the Intergovernmental Panel on Climate Chan
plain- Asserted: passes — The authors put it forward as true.
- Checkable: passes — It can be checked against evidence.
- Load-bearing: fails — The paper’s conclusions may not depend on it.
- Based: passes — The paper gives a reason why it holds.
Probably not a substantial claim. The paper’s conclusions may not depend on it. It may state two separate claims as one.
None of the sources cited for this claim have been checked yet.
In the paper
“Other recent estimates include 347 ± 12 Tg year−1 (2007–2010) [156] and 400 ± 60 Tg year−1 (1990–2017) [157].”
§ Changes in tropospheric air quality related to the protection of stratospheric ozone in a changing climate > UV-dependent air pollutants and their effects on human health, plants, and the self-cleaning capacity of the troposphere > Changes in atmospheric circulation and transport of pollutants
What the sources say
- Not checked yetcites [156] Wang, M., & Fu, Q. (2021). Stratosphere-troposphere exchange of air masses and ozone concentrations based on reanalyses and observations. Journal of Geophysical Research: Atmospheres, 126(18), e2021JD035159. https://doi.org/10.1029/2021JD035159 source
- Not checked yetcites [157] Ruiz, D. J., & Prather, M. J. (2022). From the middle stratosphere to the surface, using nitrous oxide to constrain the stratosphere–troposphere exchange of ozone. Atmospheric Chemistry and Physics, 22(3), 2079–2093. https://doi.org/10.5194/acp-22-2079-2022 source
plain- Asserted: passes — The authors put it forward as true.
- Checkable: passes — It can be checked against evidence.
- Load-bearing: fails — The paper’s conclusions may not depend on it.
- Based: passes — The paper gives a reason why it holds.
Probably not a substantial claim. The paper’s conclusions may not depend on it. It may state two separate claims as one.
In the paper
“These production and loss terms are an order of magnitude larger (around 5000 Tg year−1) than the estimated transport [e.g., 159], so that their difference is highly uncertain.”
§ Changes in tropospheric air quality related to the protection of stratospheric ozone in a changing climate > UV-dependent air pollutants and their effects on human health, plants, and the self-cleaning capacity of the troposphere > Changes in atmospheric circulation and transport of pollutants
What the sources say
- Not checked yetcites [159] Hu, L., Jacob, D. J., Liu, X., Zhang, Y., Zhang, L., Kim, P. S., Sulprizio, M. P., & Yantosca, R. M. (2017). Global budget of tropospheric ozone: Evaluating recent model advances with satellite (OMI), aircraft (IAGOS), and ozonesonde observations. Atmospheric Environment, 167, 323–334. https://doi.org/10.1016/j.atmosenv.2017.08.036 source
plain- Asserted: passes — The authors put it forward as true.
- Checkable: passes — It can be checked against evidence.
- Load-bearing: unclear — It is unclear whether the paper’s conclusions depend on it.
- Based: passes — The paper gives a reason why it holds.
It may state two separate claims as one.
In the paper
“An assessment of amounts of O3 in the troposphere shows that model estimates of STE were around 1000 Tg year−1 O3 for results reported in 1995 but by 2015 models provided estimates approaching 400 Tg year−1, with a multi-model estimate of 535 ± 160 Tg year−1 for the year 2000 [155].”
§ Changes in tropospheric air quality related to the protection of stratospheric ozone in a changing climate > UV-dependent air pollutants and their effects on human health, plants, and the self-cleaning capacity of the troposphere > Changes in atmospheric circulation and transport of pollutants
What the sources say
- Not checked yetcites [155] Archibald, A. T., Neu, J. L., Elshorbany, Y. F., Cooper, O. R., Young, P. J., Akiyoshi, H., Cox, R. A., Coyle, M., Derwent, R. G., Deushi, M., Finco, A., Frost, G. J., Galbally, I. E., Gerosa, G., Granier, C., Griffiths, P. T., Hossaini, R., Hu, L., Jöckel, P., Josse, B., et al. (2020). Tropospheric Ozone Assessment Report: A critical review of changes in the tropospheric ozone burden and budget from 1850 to 2100. Elementa Science of the Anthropocene, 8(1), 10. https://doi.org/10.1525/elementa.2020.034 source
plain- Asserted: passes — The authors put it forward as true.
- Checkable: passes — It can be checked against evidence.
- Load-bearing: unclear — It is unclear whether the paper’s conclusions depend on it.
- Based: passes — The paper gives a reason why it holds.
It may state two separate claims as one.
A conclusion the paper draws from its own results — it cites no other source for it, so there is none to check. The quote shows it is in the paper.
In the paper
“Overall, recovery of stratospheric O3, and hence lower intensity of ground-level UV-B radiation, is expected to slightly improve air quality in cities in mid-latitudes but slightly worsen air quality in rural areas.”
§ Changes in tropospheric air quality related to the protection of stratospheric ozone in a changing climate > UV-dependent air pollutants and their effects on human health, plants, and the self-cleaning capacity of the troposphere > Conclusions
hedgedstates a possible cause- Asserted: passes — The authors put it forward as true.
- Checkable: passes — It can be checked against evidence.
- Load-bearing: passes — The paper’s conclusions depend on it.
- Based: unclear — It is unclear why the paper says it holds.
It may state two separate claims as one.
None of the sources cited for this claim have been checked yet.
In the paper
“Changes in weather patterns, including extreme weather events, are not only caused by climate change but also by polar stratospheric ozone depletion, which strengthens the stratospheric polar vortex.”
§ Changes in tropospheric air quality related to the protection of stratospheric ozone in a changing climate > UV-dependent air pollutants and their effects on human health, plants, and the self-cleaning capacity of the troposphere > Changes in atmospheric circulation and transport of pollutants
What the sources say
- Not checked yetcites [23] Bernhard, G. H., Bais, A. F., Aucamp, P. J., Klekociuk, A. R., Liley, J. B., & McKenzie, R. L. (2023). Stratospheric ozone, UV radiation, and climate interactions. Photochemical & Photobiological Sciences. https://doi.org/10.1007/s43630-023-00371-y source
- Not checked yetcites [169] Barnes, P. W., Robson, T. M., Zepp, R. G., Bornman, J. F., Jansen, M. A. K., Ossola, R., Wang, Q.-W., Robinson, S. A., Foereid, B., Klekociuk, A. R., Martinez-Abaigar, J., Hou, W. C., & Paul, N. D. (2023). Interactive effects of changes in UV radiation and climate on terrestrial ecosystems, biogeochemical cycles, and feedbacks to the climate system. Photochemical & Photobiological Sciences. https://doi.org/10.1007/s43630-023-00376-7 source
- Not checked yetcites [170] Robinson, S. A., & Erickson Iii, D. J. (2015). Not just about sunburn – the ozone hole’s profound effect on climate has significant implications for Southern Hemisphere ecosystems. Global Change Biology, 21(2), 515–527. https://doi.org/10.1111/gcb.12739 source
plainstates a cause- Asserted: passes — The authors put it forward as true.
- Checkable: passes — It can be checked against evidence.
- Load-bearing: passes — The paper’s conclusions depend on it.
- Based: passes — The paper gives a reason why it holds.
It may state two separate claims as one.
In the paper
“Whether such events will occur in the future depends on trends in the emissions of ODSs and GHGs, since GHGs affect the Arctic stratosphere via radiative cooling [180].”
§ Changes in tropospheric air quality related to the protection of stratospheric ozone in a changing climate > UV-dependent air pollutants and their effects on human health, plants, and the self-cleaning capacity of the troposphere > Changes in atmospheric circulation and transport of pollutants
What the sources say
- Not checked yetcites [180] von der Gathen, P., Kivi, R., Wohltmann, I., Salawitch, R. J., & Rex, M. (2021). Climate change favours large seasonal loss of Arctic ozone. Nature Communications, 12(1), 1–17. https://doi.org/10.1038/s41467-021-24089-6 source
plainstates a possible cause- Asserted: passes — The authors put it forward as true.
- Checkable: passes — It can be checked against evidence.
- Load-bearing: passes — The paper’s conclusions depend on it.
- Based: passes — The paper gives a reason why it holds.
It may state two separate claims as one.
A conclusion the paper draws from its own results — it cites no other source for it, so there is none to check. The quote shows it is in the paper.
In the paper
“However, the recovery of stratospheric O3 should decrease the stability of the Antarctic polar vortex, which should lead to wetter conditions in the Southern Hemisphere in the near future for this region.”
§ Changes in tropospheric air quality related to the protection of stratospheric ozone in a changing climate > UV-dependent air pollutants and their effects on human health, plants, and the self-cleaning capacity of the troposphere > Changes in atmospheric circulation and transport of pollutants
hedgedstates a cause- Asserted: passes — The authors put it forward as true.
- Checkable: passes — It can be checked against evidence.
- Load-bearing: passes — The paper’s conclusions depend on it.
- Based: passes — The paper gives a reason why it holds.
It may state two separate claims as one.
A conclusion the paper draws from its own results — it cites no other source for it, so there is none to check. The quote shows it is in the paper.
In the paper
“Hence, UV-B radiation and climate change affect concentrations of tropospheric OH with potential feedbacks on climate change and on stratospheric ozone.”
§ Changes in tropospheric air quality related to the protection of stratospheric ozone in a changing climate > UV-dependent air pollutants and their effects on human health, plants, and the self-cleaning capacity of the troposphere > Conclusions
hedgedstates a cause- Asserted: passes — The authors put it forward as true.
- Checkable: passes — It can be checked against evidence.
- Load-bearing: passes — The paper’s conclusions depend on it.
- Based: passes — The paper gives a reason why it holds.
It may state two separate claims as one.
- Rests on an assumption: The total known use and release of HFC-134a, HFC-143a, and HFC-227ea between 1990 and 2015 is complete for calculating the theoretical maximum TFA production.
- The authors state this as an assumption: The degradation half-life of TFA in the environment is very long (approximately centuries).
A conclusion the paper draws from its own results — it cites no other source for it, so there is none to check. The quote shows it is in the paper.
In the paper
“In future, these data should allow better quantification of the changes in tropospheric O3 that are caused by changes in stratospheric O3.”
§ Changes in tropospheric air quality related to the protection of stratospheric ozone in a changing climate > UV-dependent air pollutants and their effects on human health, plants, and the self-cleaning capacity of the troposphere > Changes in atmospheric circulation and transport of pollutants
hedgedstates a cause- Asserted: passes — The authors put it forward as true.
- Checkable: fails — It may be too vague to check against evidence.
- Load-bearing: fails — The paper’s conclusions may not depend on it.
- Based: passes — The paper gives a reason why it holds.
Probably not a substantial claim. It may be too vague to check against evidence. The paper’s conclusions may not depend on it.
A conclusion the paper draws from its own results — it cites no other source for it, so there is none to check. The quote shows it is in the paper.
In the paper
“Hence, the frequency of extreme weather events such as droughts and therefore wildfires in both hemispheres is influenced by direct effects of climate change and by changes in atmospheric circulation and in polar stratospheric O3.”
§ Changes in tropospheric air quality related to the protection of stratospheric ozone in a changing climate > UV-dependent air pollutants and their effects on human health, plants, and the self-cleaning capacity of the troposphere > Changes in atmospheric circulation and transport of pollutants
plainstates a cause- Asserted: passes — The authors put it forward as true.
- Checkable: passes — It can be checked against evidence.
- Load-bearing: passes — The paper’s conclusions depend on it.
- Based: passes — The paper gives a reason why it holds.
It may state two separate claims as one.
In the paper
“In addition to the strength of the stratospheric polar vortex, the El Niño Southern Oscillation and the Indian Ocean Dipole also affect weather conditions in Australia [172].”
§ Changes in tropospheric air quality related to the protection of stratospheric ozone in a changing climate > UV-dependent air pollutants and their effects on human health, plants, and the self-cleaning capacity of the troposphere > Changes in atmospheric circulation and transport of pollutants
What the sources say
- Not checked yetcites [172] Lim, E.-P., Hendon, H. H., Boschat, G., Hudson, D., Thompson, D. W. J., Dowdy, A. J., & Arblaster, J. M. (2019). Australian hot and dry extremes induced by weakenings of the stratospheric polar vortex. Nature Geoscience, 12(11), 896–901. https://doi.org/10.1038/s41561-019-0456-x source
plainstates a cause- Asserted: passes — The authors put it forward as true.
- Checkable: passes — It can be checked against evidence.
- Load-bearing: fails — The paper’s conclusions may not depend on it.
- Based: passes — The paper gives a reason why it holds.
Probably not a substantial claim. The paper’s conclusions may not depend on it.
In the paper
“Similarly to the effects of the atmospheric dynamics of the Antarctic ozone hole, Arctic stratospheric ozone depletion results in a shift of the Arctic Oscillation (AO) to more positive values (e.g., [177]) and a more zonal Northern Hemisphere jet stream.”
§ Changes in tropospheric air quality related to the protection of stratospheric ozone in a changing climate > UV-dependent air pollutants and their effects on human health, plants, and the self-cleaning capacity of the troposphere > Changes in atmospheric circulation and transport of pollutants
What the sources say
- Not checked yetcites [177] Lawrence, Z. D., Perlwitz, J., Butler, A. H., Manney, G. L., Newman, P. A., Lee, S. H., & Nash, E. R. (2020). The remarkably strong arctic stratospheric polar vortex of winter 2020: Links to record-breaking Arctic oscillation and ozone loss. Journal of Geophysical Research: Atmospheres. https://doi.org/10.1029/2020jd033271 source
plainstates a cause- Asserted: passes — The authors put it forward as true.
- Checkable: passes — It can be checked against evidence.
- Load-bearing: passes — The paper’s conclusions depend on it.
- Based: passes — The paper gives a reason why it holds.
It may state two separate claims as one.
A conclusion the paper draws from its own results — it cites no other source for it, so there is none to check. The quote shows it is in the paper.
In the paper
“These properties indicate that TFA and its salts will not bioaccumulate in organisms other than terrestrial plants and will not biomagnify in food chains.”
§ Changes in tropospheric air quality related to the protection of stratospheric ozone in a changing climate > Trifluoroacetic acid in the global environment with relevance to the Montreal Protocol > Background
hedged- Asserted: passes — The authors put it forward as true.
- Checkable: passes — It can be checked against evidence.
- Load-bearing: unclear — It is unclear whether the paper’s conclusions depend on it.
- Based: passes — The paper gives a reason why it holds.
It may state two separate claims as one.
In the paper
“The physical and chemical properties of TFA are well known [201] but key to assessing environmental risk is that it is a strong acid with a pKa of 0.3 and is completely miscible with water [190].”
§ Changes in tropospheric air quality related to the protection of stratospheric ozone in a changing climate > Trifluoroacetic acid in the global environment with relevance to the Montreal Protocol > Background
What the sources say
- Not checked yetcites [190] PubChem. (2022). Trifluoroacetic acid. https://pubchem.ncbi.nlm.nih.gov/compound/6422. Accessed 1 Jan 2022
boosted- Asserted: passes — The authors put it forward as true.
- Checkable: passes — It can be checked against evidence.
- Load-bearing: passes — The paper’s conclusions depend on it.
- Based: passes — The paper gives a reason why it holds.
It may state two separate claims as one.
A conclusion the paper draws from its own results — it cites no other source for it, so there is none to check. The quote shows it is in the paper.
In the paper
“Much of the impact of air pollutants is due to chemicals produced by UV-B-initiated photochemistry, including O3 and PM, i.e., secondary inorganic and organic aerosols.”
§ Changes in tropospheric air quality related to the protection of stratospheric ozone in a changing climate > UV-dependent air pollutants and their effects on human health, plants, and the self-cleaning capacity of the troposphere > Conclusions
plainstates a cause- Asserted: passes — The authors put it forward as true.
- Checkable: passes — It can be checked against evidence.
- Load-bearing: passes — The paper’s conclusions depend on it.
- Based: fails — The paper may give no reason why it holds.
Probably not a substantial claim. The paper may give no reason why it holds.
In the paper
“However, the theory that TFA can be formed from geogenic sources has been challenged [229].”
§ Changes in tropospheric air quality related to the protection of stratospheric ozone in a changing climate > Trifluoroacetic acid in the global environment with relevance to the Montreal Protocol > Other sources of trifluoroacetic acid in the global environment
What the sources say
- Not checked yetcites [229] Joudan, S., DeSilva, A. O., & Young, C. (2021). Insufficient evidence for the existence of natural trifluoroacetic acid. Environmental Science: Processes & Impacts, 23, 1641–1649. https://doi.org/10.1039/d1em00306b source
plain- Asserted: passes — The authors put it forward as true.
- Checkable: passes — It can be checked against evidence.
- Load-bearing: fails — The paper’s conclusions may not depend on it.
- Based: passes — The paper gives a reason why it holds.
Probably not a substantial claim. The paper’s conclusions may not depend on it.
None of the sources cited for this claim have been checked yet.
In the paper
“This is consistent with the report that concentrations of TFA increase with proximity to locations of undersea volcanic vents [227, 228].”
§ Changes in tropospheric air quality related to the protection of stratospheric ozone in a changing climate > Trifluoroacetic acid in the global environment with relevance to the Montreal Protocol > Other sources of trifluoroacetic acid in the global environment
What the sources say
- Not checked yetcites [227] Scott, B., Macdonald, R., Kannan, K., Fisk, A., Witter, A., Yamashita, N., Durham, L., Spencer, C., & Muir, D. (2005). Trifluoroacetate profiles in the Arctic, Atlantic, and Pacific oceans. Environmental Science & Technology, 39, 6555–6560. https://doi.org/10.1021/es047975u source
- Not checked yetcites [228] Scott, B. F., Spencer, C., Martin, J. W., Barra, R., Bootsma, H. A., Jones, K. C., Johnston, A. E., & Muir, D. C. G. (2005). Comparison of haloacetic acids in the environment of the Northern and Southern Hemispheres. Environmental Science & Technology, 39(22), 8664–8670. https://doi.org/10.1021/es050118l source
plainstates a cause- Asserted: passes — The authors put it forward as true.
- Checkable: passes — It can be checked against evidence.
- Load-bearing: fails — The paper’s conclusions may not depend on it.
- Based: passes — The paper gives a reason why it holds.
Probably not a substantial claim. The paper’s conclusions may not depend on it.
None of the sources cited for this claim have been checked yet.
In the paper
“Since the early reports of the widespread presence of TFA in marine waters [213, 226] and its association with 14C-dated deep waters older than 1000 years [227], it was believed that there are natural sources of TFA.”
§ Changes in tropospheric air quality related to the protection of stratospheric ozone in a changing climate > Trifluoroacetic acid in the global environment with relevance to the Montreal Protocol > Other sources of trifluoroacetic acid in the global environment
What the sources say
- Not checked yetcites [213] Frank, H., Christoph, E. H., Holm-Hansen, O., & Bullister, J. L. (2002). Trifluoroacetate in ocean waters. Environmental Science & Technology, 36, 12–15. https://doi.org/10.1021/es0101532 source
- Not checked yetcites [226] Frank, H., Klein, A., & Renschen, D. (1996). Environmental trifluoroacetate. Nature, 382, 34–34. https://doi.org/10.1038/382034a0 source
- Not checked yetcites [227] Scott, B., Macdonald, R., Kannan, K., Fisk, A., Witter, A., Yamashita, N., Durham, L., Spencer, C., & Muir, D. (2005). Trifluoroacetate profiles in the Arctic, Atlantic, and Pacific oceans. Environmental Science & Technology, 39, 6555–6560. https://doi.org/10.1021/es047975u source
plain- Asserted: passes — The authors put it forward as true.
- Checkable: passes — It can be checked against evidence.
- Load-bearing: fails — The paper’s conclusions may not depend on it.
- Based: passes — The paper gives a reason why it holds.
Probably not a substantial claim. The paper’s conclusions may not depend on it.
In the paper
“As discussed in the previous update report [225], maize and poplar plants take up TFA from contaminated soils [236].”
§ Changes in tropospheric air quality related to the protection of stratospheric ozone in a changing climate > Trifluoroacetic acid in the global environment with relevance to the Montreal Protocol > Other sources of trifluoroacetic acid in the global environment
What the sources say
- Not checked yetcites [236] Lan, Z., Yao, Y., Xu, J., Chen, H., Ren, C., Fang, X., Zhang, K., Jin, L., Hua, X., & Alder, A. C. (2020). Novel and legacy per-and polyfluoroalkyl substances (PFASs) in a farmland environment: Soil distribution and biomonitoring with plant leaves and locusts. Environmental Pollution, 263, 114487. https://doi.org/10.1016/j.envpol.2020.114487 source
plainstates a cause- Asserted: passes — The authors put it forward as true.
- Checkable: passes — It can be checked against evidence.
- Load-bearing: fails — The paper’s conclusions may not depend on it.
- Based: passes — The paper gives a reason why it holds.
Probably not a substantial claim. The paper’s conclusions may not depend on it.
A conclusion the paper draws from its own results — it cites no other source for it, so there is none to check. The quote shows it is in the paper.
In the paper
“That this amount of TFA (measured in the 1990s) is all from anthropogenic sources is very unlikely, and geogenic sources are more plausible.”
§ Changes in tropospheric air quality related to the protection of stratospheric ozone in a changing climate > Trifluoroacetic acid in the global environment with relevance to the Montreal Protocol > Other sources of trifluoroacetic acid in the global environment
hedgedSingle case- Asserted: passes — The authors put it forward as true.
- Checkable: passes — It can be checked against evidence.
- Load-bearing: unclear — It is unclear whether the paper’s conclusions depend on it.
- Based: passes — The paper gives a reason why it holds.
It may state two separate claims as one.
In the paper
“The authors suggest that the sources of TFA are replacements for the CFCs, mostly from precipitation. The authors are likely correct in this conclusion.”
§ Changes in tropospheric air quality related to the protection of stratospheric ozone in a changing climate > Trifluoroacetic acid in the global environment with relevance to the Montreal Protocol > Trifluoroacetic acid in precipitation
What the sources say
- Not checked yetcites [222] Freeling, F., Scheurer, M., Koschorreck, J., Hoffmann, G., Ternes, T. A., & Nödler, K. (2022). Levels and temporal trends of trifluoroacetate (TFA) in archived plants: Evidence for increasing emissions of gaseous TFA precursors over the last decades. Environmental Science & Technology Letters, 5, 400–405. https://doi.org/10.1021/acs.estlett.2c00164 source
hedgedstates a cause- Asserted: passes — The authors put it forward as true.
- Checkable: passes — It can be checked against evidence.
- Load-bearing: unclear — It is unclear whether the paper’s conclusions depend on it.
- Based: passes — The paper gives a reason why it holds.
It may state two separate claims as one.
A conclusion the paper draws from its own results — it cites no other source for it, so there is none to check. The quote shows it is in the paper.
In the paper
“If, as seems to be the case, the half-life is likely very long (≈ centuries), very small amounts could accumulate over time to explain the amounts observed in oceans and endorheic basins.”
§ Changes in tropospheric air quality related to the protection of stratospheric ozone in a changing climate > Trifluoroacetic acid in the global environment with relevance to the Montreal Protocol > Other sources of trifluoroacetic acid in the global environment
hedgedstates a possible cause- Asserted: passes — The authors put it forward as true.
- Checkable: passes — It can be checked against evidence.
- Load-bearing: fails — The paper’s conclusions may not depend on it.
- Based: passes — The paper gives a reason why it holds.
Probably not a substantial claim. The paper’s conclusions may not depend on it.
- The authors state this as an assumption: The degradation half-life of TFA in the environment is very long (approximately centuries).
In the paper
“The source of the TFA was most likely degradation of fluorinated gases in the troposphere and the authors suggest that the seasonality is because of seasonal changes in solar UV radiation and the photochemical formation of OH radicals responsible for production of TFA in the troposphere [220].”
§ Changes in tropospheric air quality related to the protection of stratospheric ozone in a changing climate > Trifluoroacetic acid in the global environment with relevance to the Montreal Protocol > Trifluoroacetic acid in precipitation
What the sources say
- Not checked yetcites [220] Freeling, F., Behringer, D., Heydel, F., Scheurer, M., Ternes, T. A., & Nödler, K. (2020). Trifluoroacetate in precipitation: Deriving a benchmark dataset. Environmental Science & Technology, 54, 11210–11219. https://doi.org/10.1021/acs.est.0c02910 source
hedgedstates a possible cause- Asserted: passes — The authors put it forward as true.
- Checkable: passes — It can be checked against evidence.
- Load-bearing: unclear — It is unclear whether the paper’s conclusions depend on it.
- Based: passes — The paper gives a reason why it holds.
It may state two separate claims as one.
In the paper
“Concentrations of PFOS and PFOA were greater than TFA and these chemicals are more toxic than TFA and are retained in the body for longer periods (Table 2).”
§ Changes in tropospheric air quality related to the protection of stratospheric ozone in a changing climate > Trifluoroacetic acid in the global environment with relevance to the Montreal Protocol > Other sources of trifluoroacetic acid in the global environment
What the sources say
- Not checked yetcites [242] Duan, Y., Sun, H., Yao, Y., Meng, Y., & Li, Y. (2020). Distribution of novel and legacy per-/polyfluoroalkyl substances in serum and its associations with two glycemic biomarkers among Chinese adult men and women with normal blood glucose levels. Environment International, 134, 105295. https://doi.org/10.1016/j.envint.2019.105295 source
plain- Asserted: passes — The authors put it forward as true.
- Checkable: passes — It can be checked against evidence.
- Load-bearing: unclear — It is unclear whether the paper’s conclusions depend on it.
- Based: passes — The paper gives a reason why it holds.
It may state two separate claims as one.
In the paper
“The frequency of detection of TFA was 97% but 12 other PFAS had greater frequencies of detection.”
§ Changes in tropospheric air quality related to the protection of stratospheric ozone in a changing climate > Trifluoroacetic acid in the global environment with relevance to the Montreal Protocol > Other sources of trifluoroacetic acid in the global environment
What the sources say
- Not checked yetcites [242] Duan, Y., Sun, H., Yao, Y., Meng, Y., & Li, Y. (2020). Distribution of novel and legacy per-/polyfluoroalkyl substances in serum and its associations with two glycemic biomarkers among Chinese adult men and women with normal blood glucose levels. Environment International, 134, 105295. https://doi.org/10.1016/j.envint.2019.105295 source
plain- Asserted: passes — The authors put it forward as true.
- Checkable: passes — It can be checked against evidence.
- Load-bearing: unclear — It is unclear whether the paper’s conclusions depend on it.
- Based: passes — The paper gives a reason why it holds.
It may state two separate claims as one.
In the paper
“Some bacteria use fluoxetine (Prozac®, CAS# 54,910-89-3) as a sole source of carbon and the terminal metabolite is TFA [249], which is not further metabolized.”
§ Changes in tropospheric air quality related to the protection of stratospheric ozone in a changing climate > Trifluoroacetic acid in the global environment with relevance to the Montreal Protocol > Other sources of trifluoroacetic acid in the global environment
What the sources say
- Not checked yetcites [249] Khan, M. F., & Murphy, C. D. (2021). Bacterial degradation of the anti-depressant drug fluoxetine produces trifluoroacetic acid and fluoride ion. Applied Microbiology and Biotechnology, 105, 9359–9369. https://doi.org/10.1007/s00253-021-11675-3 source
plainstates a cause- Asserted: passes — The authors put it forward as true.
- Checkable: passes — It can be checked against evidence.
- Load-bearing: unclear — It is unclear whether the paper’s conclusions depend on it.
- Based: passes — The paper gives a reason why it holds.
It may state two separate claims as one.
In the paper
“The original source(s) of the contamination in the dusts are unknown but there were amounts of unknown precursors (37 − 67 mol %) for PFAS in the dust [245].”
§ Changes in tropospheric air quality related to the protection of stratospheric ozone in a changing climate > Trifluoroacetic acid in the global environment with relevance to the Montreal Protocol > Other sources of trifluoroacetic acid in the global environment
What the sources say
- Not checked yetcites [245] Wang, B., Yao, Y., Wang, Y., Chen, H., & Sun, H. (2021). Per-and polyfluoroalkyl substances in outdoor and indoor dust from Mainland China: Contributions of unknown precursors and implications for human exposure. Environmental Science & Technology, 56(10), 6036–6045. https://doi.org/10.1021/acs.est.0c08242 source
plain- Asserted: passes — The authors put it forward as true.
- Checkable: passes — It can be checked against evidence.
- Load-bearing: unclear — It is unclear whether the paper’s conclusions depend on it.
- Based: passes — The paper gives a reason why it holds.
It may state two separate claims as one.
In the paper
“Median concentrations of TFA in outdoor dust from six locations in China ranged from 61,000 to 222,000 µg a.e. kg−1 with no consistent differences between rural and urban sites.”
§ Changes in tropospheric air quality related to the protection of stratospheric ozone in a changing climate > Trifluoroacetic acid in the global environment with relevance to the Montreal Protocol > Other sources of trifluoroacetic acid in the global environment
What the sources say
- Not checked yetcites [245] Wang, B., Yao, Y., Wang, Y., Chen, H., & Sun, H. (2021). Per-and polyfluoroalkyl substances in outdoor and indoor dust from Mainland China: Contributions of unknown precursors and implications for human exposure. Environmental Science & Technology, 56(10), 6036–6045. https://doi.org/10.1021/acs.est.0c08242 source
plain- Asserted: passes — The authors put it forward as true.
- Checkable: passes — It can be checked against evidence.
- Load-bearing: unclear — It is unclear whether the paper’s conclusions depend on it.
- Based: passes — The paper gives a reason why it holds.
It may state two separate claims as one.
In the paper
“The authors reported an association between the sum of the concentrations of PFAS and biomarkers of diabetes but offered no insight as to causality by a specific chemical or the route of exposure to these chemicals.”
§ Changes in tropospheric air quality related to the protection of stratospheric ozone in a changing climate > Trifluoroacetic acid in the global environment with relevance to the Montreal Protocol > Other sources of trifluoroacetic acid in the global environment
What the sources say
- Not checked yetcites [242] Duan, Y., Sun, H., Yao, Y., Meng, Y., & Li, Y. (2020). Distribution of novel and legacy per-/polyfluoroalkyl substances in serum and its associations with two glycemic biomarkers among Chinese adult men and women with normal blood glucose levels. Environment International, 134, 105295. https://doi.org/10.1016/j.envint.2019.105295 source
plainstates an association- Asserted: passes — The authors put it forward as true.
- Checkable: passes — It can be checked against evidence.
- Load-bearing: fails — The paper’s conclusions may not depend on it.
- Based: passes — The paper gives a reason why it holds.
Probably not a substantial claim. The paper’s conclusions may not depend on it. It may state two separate claims as one.
A conclusion the paper draws from its own results — it cites no other source for it, so there is none to check. The quote shows it is in the paper.
In the paper
“These values are 4.4 orders of magnitude less than the NOED (No Observed Effect Dose) for TFA in rats (discussed below) and do not suggest biologically significant risks for humans.”
§ Changes in tropospheric air quality related to the protection of stratospheric ozone in a changing climate > Trifluoroacetic acid in the global environment with relevance to the Montreal Protocol > Other sources of trifluoroacetic acid in the global environment
hedged- Asserted: passes — The authors put it forward as true.
- Checkable: passes — It can be checked against evidence.
- Load-bearing: unclear — It is unclear whether the paper’s conclusions depend on it.
- Based: passes — The paper gives a reason why it holds.
It may state two separate claims as one.
None of the sources cited for this claim have been checked yet.
In the paper
“As of 2020, the number of pharmaceuticals containing fluorine atom(s) was 369 [247] and in 2021, 13 new products containing fluorine were added [248]. Of these, 77 contain C–CF3 moieties [from Fig. 4 in [247]].”
§ Changes in tropospheric air quality related to the protection of stratospheric ozone in a changing climate > Trifluoroacetic acid in the global environment with relevance to the Montreal Protocol > Other sources of trifluoroacetic acid in the global environment
What the sources say
- Not checked yetcites [247] Inoue, M., Sumii, Y., & Shibata, N. (2020). Contribution of organofluorine compounds to pharmaceuticals. ACS Omega, 5(19), 10633–10640. https://doi.org/10.1021/acsomega.0c00830 source
- Not checked yetcites [248] Yu, Y., Liu, A., Dhawan, G., Mei, H., Zhang, W., Izawa, K., Soloshonok, V. A., & Han, J. (2021). Fluorine-containing pharmaceuticals approved by the FDA in 2020: Synthesis and biological activity. Chinese Chemical Letters. https://doi.org/10.1016/j.cclet.2021.05.042 source
plain- Asserted: passes — The authors put it forward as true.
- Checkable: passes — It can be checked against evidence.
- Load-bearing: unclear — It is unclear whether the paper’s conclusions depend on it.
- Based: passes — The paper gives a reason why it holds.
It may state two separate claims as one.
In the paper
“TFA can also be formed from some fluoro-pharmaceuticals during treatment of water with O3. The molar yield of TFA from fluoxetine solutions treated with O3 at 4 mg L−1 was as large as 40% [202].”
§ Changes in tropospheric air quality related to the protection of stratospheric ozone in a changing climate > Trifluoroacetic acid in the global environment with relevance to the Montreal Protocol > Other sources of trifluoroacetic acid in the global environment
What the sources say
- Not checked yetcites [202] Scheurer, M., Nödler, K., Freeling, F., Janda, J., Happel, O., Riegel, M., Müller, U., Storck, F. R., Fleig, M., Lange, F. T., Brunsch, A., & Brauch, H.-J. (2017). Small, mobile, persistent: Trifluoroacetate in the water cycle—Overlooked sources, pathways, and consequences for drinking water supply. Water Research, 126, 460–471. https://doi.org/10.1016/j.watres.2017.09.045 source
plainstates a cause- Asserted: passes — The authors put it forward as true.
- Checkable: passes — It can be checked against evidence.
- Load-bearing: unclear — It is unclear whether the paper’s conclusions depend on it.
- Based: passes — The paper gives a reason why it holds.
It may state two separate claims as one.
In the paper
“The median concentration of TFA in serum of the volunteers was 8460 ng L−1 and the 75th centile was 12,550 ng a.e. L−1.”
§ Changes in tropospheric air quality related to the protection of stratospheric ozone in a changing climate > Trifluoroacetic acid in the global environment with relevance to the Montreal Protocol > Other sources of trifluoroacetic acid in the global environment
What the sources say
- Not checked yetcites [242] Duan, Y., Sun, H., Yao, Y., Meng, Y., & Li, Y. (2020). Distribution of novel and legacy per-/polyfluoroalkyl substances in serum and its associations with two glycemic biomarkers among Chinese adult men and women with normal blood glucose levels. Environment International, 134, 105295. https://doi.org/10.1016/j.envint.2019.105295 source
plain- Asserted: passes — The authors put it forward as true.
- Checkable: passes — It can be checked against evidence.
- Load-bearing: unclear — It is unclear whether the paper’s conclusions depend on it.
- Based: passes — The paper gives a reason why it holds.
It may state two separate claims as one.
In the paper
“The potential annual production of TFA from use of pesticides in Germany was 504 tons per year (Fig. 14), based on a mean of 3 years) but should not be compared directly with the data from the United States (Table 4), which presents total estimated use over 26 years.”
§ Changes in tropospheric air quality related to the protection of stratospheric ozone in a changing climate > Trifluoroacetic acid in the global environment with relevance to the Montreal Protocol > Other sources of trifluoroacetic acid in the global environment
What the sources say
- Not checked yetcites [214] UBA. (2021). Persistent degradation products of halogenated refrigerants and blowing agents in the environment: Type, environmental concentrations, and fate with particular regard to new halogenated substitutes with low global warming potential (Vol. FB000452/ENG). Umwelt Bundesamt
plain- Asserted: passes — The authors put it forward as true.
- Checkable: passes — It can be checked against evidence.
- Load-bearing: fails — The paper’s conclusions may not depend on it.
- Based: passes — The paper gives a reason why it holds.
Probably not a substantial claim. The paper’s conclusions may not depend on it.
A conclusion the paper draws from its own results — it cites no other source for it, so there is none to check. The quote shows it is in the paper.
In the paper
“Salts of TFA have low toxicity to animals and plants and there are very wide margins between current/projected exposures and toxicity values.”
§ Changes in tropospheric air quality related to the protection of stratospheric ozone in a changing climate > Trifluoroacetic acid in the global environment with relevance to the Montreal Protocol > Conclusions and uncertainties
plain- Asserted: passes — The authors put it forward as true.
- Checkable: passes — It can be checked against evidence.
- Load-bearing: passes — The paper’s conclusions depend on it.
- Based: passes — The paper gives a reason why it holds.
It may state two separate claims as one.
A conclusion the paper draws from its own results — it cites no other source for it, so there is none to check. The quote shows it is in the paper.
In the paper
“However, there is some uncertainty in the environmental toxicity values because only two marine species are included in the toxicity data set for aquatic species; and marine macrophytes, which are keystone species with respect to habitat, have not been tested.”
§ Changes in tropospheric air quality related to the protection of stratospheric ozone in a changing climate > Trifluoroacetic acid in the global environment with relevance to the Montreal Protocol > Conclusions and uncertainties
plainstates a cause- Asserted: passes — The authors put it forward as true.
- Checkable: passes — It can be checked against evidence.
- Load-bearing: unclear — It is unclear whether the paper’s conclusions depend on it.
- Based: passes — The paper gives a reason why it holds.
It may state two separate claims as one.
A conclusion the paper draws from its own results — it cites no other source for it, so there is none to check. The quote shows it is in the paper.
In the paper
“The Montreal Protocol has led to the replacement of ODSs with fluorinated chemicals”
§ Changes in tropospheric air quality related to the protection of stratospheric ozone in a changing climate > Overall conclusions
plainstates a cause- Asserted: passes — The authors put it forward as true.
- Checkable: passes — It can be checked against evidence.
- Load-bearing: passes — The paper’s conclusions depend on it.
- Based: fails — The paper may give no reason why it holds.
Probably not a substantial claim. The paper may give no reason why it holds.
In the paper
“Studies on the photolysis of the lampricide 3-trifluoromethyl-4-nitrophenol (TFM CAS# 88–30-2) used to control the sea lamprey in the North American Great Lakes have shown that photolysis (365 nm) results in the formation of TFA [255]. Yields were dependent on the pH of the solution and ranged from 5 to 18%.”
§ Changes in tropospheric air quality related to the protection of stratospheric ozone in a changing climate > Trifluoroacetic acid in the global environment with relevance to the Montreal Protocol > Other sources of trifluoroacetic acid in the global environment
What the sources say
- Not checked yetcites [255] Ellis, D. A., & Mabury, S. A. (2000). The aqueous photolysis of TFM and related trifluoromethylphenols. An alternate source of trifluoroacetic acid in the environment. Environmental Science & Technology, 34, 632–637. https://doi.org/10.1021/es990422c source
plainstates a cause- Asserted: passes — The authors put it forward as true.
- Checkable: passes — It can be checked against evidence.
- Load-bearing: unclear — It is unclear whether the paper’s conclusions depend on it.
- Based: passes — The paper gives a reason why it holds.
It may state two separate claims as one.
A conclusion the paper draws from its own results — it cites no other source for it, so there is none to check. The quote shows it is in the paper.
In the paper
“UV-B radiation is essential to the formation of photochemical smog, including ground-level O3, particulate matter”
§ Changes in tropospheric air quality related to the protection of stratospheric ozone in a changing climate > Overall conclusions
plainstates a cause- Asserted: passes — The authors put it forward as true.
- Checkable: passes — It can be checked against evidence.
- Load-bearing: passes — The paper’s conclusions depend on it.
- Based: fails — The paper may give no reason why it holds.
Probably not a substantial claim. The paper may give no reason why it holds.
A conclusion the paper draws from its own results — it cites no other source for it, so there is none to check. The quote shows it is in the paper.
In the paper
“This persistence is not a major concern because it does not react with biomolecules.”
§ Changes in tropospheric air quality related to the protection of stratospheric ozone in a changing climate > Trifluoroacetic acid in the global environment with relevance to the Montreal Protocol > Conclusions and uncertainties
plain- Asserted: passes — The authors put it forward as true.
- Checkable: passes — It can be checked against evidence.
- Load-bearing: passes — The paper’s conclusions depend on it.
- Based: unclear — It is unclear why the paper says it holds.
It may state two separate claims as one.
None of the sources cited for this claim have been checked yet.
In the paper
“Still, MIR studies and atmospheric modeling studies of HFO-1234yf, have shown that O3 production from HFO-1234yf is indistinguishable from that from ethane (also consistent with Online Resource Table 3), and that replacing HFC-134a in vehicle air conditioning units with HFO-1234yf across the United States has a negligible impact (< 0.01%) on the formation of tropospheric ozone.”
§ Changes in tropospheric air quality related to the protection of stratospheric ozone in a changing climate > Trifluoroacetic acid in the global environment with relevance to the Montreal Protocol > Other issues relevant to the degradation of fluorinated chemicals and release of TFA
What the sources say
- Not checked yetcites [267] Carter, W. P. L. (1994). Development of ozone reactivity scales for volatile organic compounds. Air & Waste, 44, 881–899. https://doi.org/10.1080/1073161X.1994.10467290 source
- Not checked yetcites [269] Carter, W. P. L. (2009). Investigation of Atmospheric Ozone Impacts of Trans 2,3,3,3-Tetrafluoropropene, Final Report for Contract UCR-09010016. Center for Environmental Research and Technology, College of Engineering, University of California, Riverside, California
boosted- Asserted: passes — The authors put it forward as true.
- Checkable: passes — It can be checked against evidence.
- Load-bearing: passes — The paper’s conclusions depend on it.
- Based: passes — The paper gives a reason why it holds.
It may state two separate claims as one.
A conclusion the paper draws from its own results — it cites no other source for it, so there is none to check. The quote shows it is in the paper.
In the paper
“Because of its lack of reactivity, TFA salts are persistent in the environment and estimates of half-life are uncertain but could be in the range of centuries or millennia.”
§ Changes in tropospheric air quality related to the protection of stratospheric ozone in a changing climate > Trifluoroacetic acid in the global environment with relevance to the Montreal Protocol > Conclusions and uncertainties
hedgedstates a cause- Asserted: passes — The authors put it forward as true.
- Checkable: passes — It can be checked against evidence.
- Load-bearing: passes — The paper’s conclusions depend on it.
- Based: passes — The paper gives a reason why it holds.
It may state two separate claims as one.
A conclusion the paper draws from its own results — it cites no other source for it, so there is none to check. The quote shows it is in the paper.
In the paper
“The HFOs and HCFOs have shorter lifetimes in the atmosphere and deposition of TFA from these substances is likely to be more localized. This will result in greater concentrations near the locations of release.”
§ Changes in tropospheric air quality related to the protection of stratospheric ozone in a changing climate > Trifluoroacetic acid in the global environment with relevance to the Montreal Protocol > Conclusions and uncertainties
hedgedstates a possible cause- Asserted: passes — The authors put it forward as true.
- Checkable: passes — It can be checked against evidence.
- Load-bearing: passes — The paper’s conclusions depend on it.
- Based: passes — The paper gives a reason why it holds.
It may state two separate claims as one.
A conclusion the paper draws from its own results — it cites no other source for it, so there is none to check. The quote shows it is in the paper.
In the paper
“Future changes in UV-B radiation are uncertain”
§ Changes in tropospheric air quality related to the protection of stratospheric ozone in a changing climate > Overall conclusions
plain- Asserted: passes — The authors put it forward as true.
- Checkable: passes — It can be checked against evidence.
- Load-bearing: passes — The paper’s conclusions depend on it.
- Based: passes — The paper gives a reason why it holds.
Probably not a substantial claim.
A conclusion the paper draws from its own results — it cites no other source for it, so there is none to check. The quote shows it is in the paper.
In the paper
“however, interactions with climate change complicate predictions”
§ Changes in tropospheric air quality related to the protection of stratospheric ozone in a changing climate > Overall conclusions
plainstates a cause- Asserted: passes — The authors put it forward as true.
- Checkable: passes — It can be checked against evidence.
- Load-bearing: passes — The paper’s conclusions depend on it.
- Based: fails — The paper may give no reason why it holds.
Probably not a substantial claim. The paper may give no reason why it holds.
A conclusion the paper draws from its own results — it cites no other source for it, so there is none to check. The quote shows it is in the paper.
In the paper
“This is unlikely to present a risk to humans or the environment in these locations but changes in concentration in surface water (or soil) would respond rapidly to releases.”
§ Changes in tropospheric air quality related to the protection of stratospheric ozone in a changing climate > Trifluoroacetic acid in the global environment with relevance to the Montreal Protocol > Conclusions and uncertainties
hedgedstates a possible cause- Asserted: passes — The authors put it forward as true.
- Checkable: passes — It can be checked against evidence.
- Load-bearing: passes — The paper’s conclusions depend on it.
- Based: passes — The paper gives a reason why it holds.
It may state two separate claims as one.
A conclusion the paper draws from its own results — it cites no other source for it, so there is none to check. The quote shows it is in the paper.
In the paper
“TFA and its salts are easily excreted by animals and do not bioaccumulate in food chains.”
§ Changes in tropospheric air quality related to the protection of stratospheric ozone in a changing climate > Trifluoroacetic acid in the global environment with relevance to the Montreal Protocol > Conclusions and uncertainties
plain- Asserted: passes — The authors put it forward as true.
- Checkable: passes — It can be checked against evidence.
- Load-bearing: passes — The paper’s conclusions depend on it.
- Based: unclear — It is unclear why the paper says it holds.
It may state two separate claims as one.
A conclusion the paper draws from its own results — it cites no other source for it, so there is none to check. The quote shows it is in the paper.
In the paper
“Current and projected (to 2100) concentrations of TFA in the oceans provide a very large margin of exposure (thousand-fold) when compared to thresholds of toxicity, and risks to the environment and human health are de minimis.”
§ Changes in tropospheric air quality related to the protection of stratospheric ozone in a changing climate > Trifluoroacetic acid in the global environment with relevance to the Montreal Protocol > Conclusions and uncertainties
plain- Asserted: passes — The authors put it forward as true.
- Checkable: passes — It can be checked against evidence.
- Load-bearing: passes — The paper’s conclusions depend on it.
- Based: passes — The paper gives a reason why it holds.
It may state two separate claims as one.
None of the sources cited for this claim have been checked yet.
In the paper
“Some pesticides also contain one or more C–CF3 moieties [254] and are potential sources of TFA in the environment [225].”
§ Changes in tropospheric air quality related to the protection of stratospheric ozone in a changing climate > Trifluoroacetic acid in the global environment with relevance to the Montreal Protocol > Other sources of trifluoroacetic acid in the global environment
What the sources say
- Not checked yetcites [254] Ogawa, Y., Tokunaga, E., Kobayashi, O., Hirai, K., & Shibata, N. (2020). Current contributions of organofluorine compounds to the agrochemical industry. Iscience, 23, 101467. https://doi.org/10.1016/j.isci.2020.101467 source
- Not checked yetcites [225] Neale, R. E., Barnes, P. W., Robson, T. M., Neale, P. J., Williamson, C. E., Zepp, R. G., Wilson, S. R., Madronich, S., Andrady, A. L., Heikkilä, A. M., Bernhard, G. H., Bais, A. F., Aucamp, P. J., Banaszak, A. T., Bornman, J. F., Bruckman, L. S., Byrne, S. N., Foereid, B., Häder, D. P., … Zhu, M. (2021). Environmental effects of stratospheric ozone depletion, UV radiation, and interactions with climate change: UNEP Environmental Effects Assessment Panel, Update 2020. Photochemical & Photobiological Sciences, 20, 1–67. https://doi.org/10.1007/s43630-020-00001-x source
hedgedstates a possible cause- Asserted: passes — The authors put it forward as true.
- Checkable: passes — It can be checked against evidence.
- Load-bearing: unclear — It is unclear whether the paper’s conclusions depend on it.
- Based: passes — The paper gives a reason why it holds.
It may state two separate claims as one.
A conclusion the paper draws from its own results — it cites no other source for it, so there is none to check. The quote shows it is in the paper.
In the paper
“TFA is known to have a long environmental lifetime”
§ Changes in tropospheric air quality related to the protection of stratospheric ozone in a changing climate > Overall conclusions
boosted- Asserted: passes — The authors put it forward as true.
- Checkable: passes — It can be checked against evidence.
- Load-bearing: passes — The paper’s conclusions depend on it.
- Based: fails — The paper may give no reason why it holds.
Probably not a substantial claim. The paper may give no reason why it holds.
A conclusion the paper draws from its own results — it cites no other source for it, so there is none to check. The quote shows it is in the paper.
In the paper
“TFA does not bioaccumulate nor is it toxic at the low to moderate exposures currently measured in the environment or those predicted in the distant future.”
§ Changes in tropospheric air quality related to the protection of stratospheric ozone in a changing climate > Trifluoroacetic acid in the global environment with relevance to the Montreal Protocol > Human and environmental risks associated with trifluoroacetic acid in the environment
plain- Asserted: passes — The authors put it forward as true.
- Checkable: passes — It can be checked against evidence.
- Load-bearing: passes — The paper’s conclusions depend on it.
- Based: passes — The paper gives a reason why it holds.
It may state two separate claims as one.
None of the sources cited for this claim have been checked yet.
In the paper
“Although this new study on R. subcapitata has not been published in the literature, the study was conducted under Good Laboratory Practice Guidelines with Quality Assurance and Quality Control [262]. The detailed report of the study was reviewed by ECHA [263] and was classified as “reliable without restriction”, hence it has been used here in the characterization of the toxicity of TFA to aquatic”
§ Changes in tropospheric air quality related to the protection of stratospheric ozone in a changing climate > Trifluoroacetic acid in the global environment with relevance to the Montreal Protocol > Human and environmental risks associated with trifluoroacetic acid in the environment
What the sources say
- Not checked yetcites [262] OECD. (2022). Good Laboratory Practice (GLP). https://www.oecd.org/chemicalsafety/testing/good-laboratory-practiceglp.htm. Accessed 1 Apr 2022
- Not checked yetcites [263] ECHA. (2021). Trifluoroacetic acid: Toxicity to aquatic algae and cyanobacteria. https://echa.europa.eu/registration-dossier/-/registered-dossier/5203/6/2/6/?documentUUID=9e9959f8-a994-4b8c-93d7-de7a1a3c1cfa. Accessed 1 Dec 2021
plain- Asserted: passes — The authors put it forward as true.
- Checkable: passes — It can be checked against evidence.
- Load-bearing: passes — The paper’s conclusions depend on it.
- Based: passes — The paper gives a reason why it holds.
It may state two separate claims as one.
A conclusion the paper draws from its own results — it cites no other source for it, so there is none to check. The quote shows it is in the paper.
In the paper
“Because the HCFCs and HFCs are long-lived in the atmosphere, they distribute globally and TFA from these substances is more evenly deposited.”
§ Changes in tropospheric air quality related to the protection of stratospheric ozone in a changing climate > Trifluoroacetic acid in the global environment with relevance to the Montreal Protocol > Conclusions and uncertainties
plainstates a cause- Asserted: passes — The authors put it forward as true.
- Checkable: passes — It can be checked against evidence.
- Load-bearing: passes — The paper’s conclusions depend on it.
- Based: passes — The paper gives a reason why it holds.
It may state two separate claims as one.
A conclusion the paper draws from its own results — it cites no other source for it, so there is none to check. The quote shows it is in the paper.
In the paper
“These releases will add to the existing load of TFA in the environment but predicted amounts are well below the threshold for concern with respect to human and environmental health.”
§ Changes in tropospheric air quality related to the protection of stratospheric ozone in a changing climate > Trifluoroacetic acid in the global environment with relevance to the Montreal Protocol > Conclusions and uncertainties
boostedstates a cause- Asserted: passes — The authors put it forward as true.
- Checkable: passes — It can be checked against evidence.
- Load-bearing: passes — The paper’s conclusions depend on it.
- Based: passes — The paper gives a reason why it holds.
It may state two separate claims as one.
A conclusion the paper draws from its own results — it cites no other source for it, so there is none to check. The quote shows it is in the paper.
In the paper
“Even in the subclass of perfluorinated alkanoic acids, the physical, chemical, and biological properties of these substances differ widely, mostly in relation to length of the alkyl chain.”
§ Changes in tropospheric air quality related to the protection of stratospheric ozone in a changing climate > Trifluoroacetic acid in the global environment with relevance to the Montreal Protocol > Conclusions and uncertainties
plainstates an association- Asserted: passes — The authors put it forward as true.
- Checkable: passes — It can be checked against evidence.
- Load-bearing: passes — The paper’s conclusions depend on it.
- Based: fails — The paper may give no reason why it holds.
Probably not a substantial claim. The paper may give no reason why it holds.
In the paper
“Stabilized Criegee intermediates (SCI), highly reactive chemicals formed in the atmosphere, react rapidly with PFCAs including TFA, producing hydroperoxyfluoroesters. This is likely the dominant gas-phase fate of PFCAs [281], although this only constitutes a temporary reservoir.”
§ Changes in tropospheric air quality related to the protection of stratospheric ozone in a changing climate > Trifluoroacetic acid in the global environment with relevance to the Montreal Protocol > Other issues relevant to the degradation of fluorinated chemicals and release of TFA
What the sources say
- Not checked yetcites [281] Taatjes, C. A., Khan, M. A. H., Eskola, A. J., Percival, C. J., Osborn, D. L., Wallington, T. J., & Shallcross, D. E. (2019). Reaction of perfluorooctanoic acid with Criegee intermediates and implications for the atmospheric fate of perfluorocarboxylic acids. Environmental Science & Technology, 53(3), 1245–1251. https://doi.org/10.1021/acs.est.8b05073 source
hedgedstates a cause- Asserted: passes — The authors put it forward as true.
- Checkable: passes — It can be checked against evidence.
- Load-bearing: unclear — It is unclear whether the paper’s conclusions depend on it.
- Based: passes — The paper gives a reason why it holds.
It may state two separate claims as one.
None of the sources cited for this claim have been checked yet.
In the paper
“In 2020 the measured mean abundances of HFO-1234ze and HCFO-1233zd(E) in central Europe at Jungfraujoch (remote, 3580 m above sea level) were 0.98 ng/m3 (0.21 pptv) and 1.01 ng/m3 (0.19 pptv), respectively. This is an increase from 0.18 ng/m3 (0.039 pptv) and 0.02 ng m−3 (0.003 pptv) in 2013 at this same measurement station.”
§ Changes in tropospheric air quality related to the protection of stratospheric ozone in a changing climate > Trifluoroacetic acid in the global environment with relevance to the Montreal Protocol > Other issues relevant to the degradation of fluorinated chemicals and release of TFA
What the sources say
- Not checked yetcites [270] Lefrancois, F., Jesswein, M., Thoma, M., Engel, A., Stanley, K., & Schuck, T. (2021). An indirect-calibration method for non-target quantification of trace gases applied to a time series of fourth-generation synthetic halocarbons at the Taunus Observatory (Germany). Atmospheric Measurement Techniques, 14(6), 4669–4687. https://doi.org/10.5194/amt-14-4669-2021 source
- Not checked yetcites [271] Vollmer, M. K., Reimann, S., Hill, M., & Brunner, D. (2015). First observations of the fourth generation synthetic halocarbons HFC-1234yf, HFC-1234ze(E), and HCFC-1233zd(E) in the atmosphere. Environmental Science & Technology, 49(5), 2703–2708. https://doi.org/10.1021/es505123x source
- Not checked yetcites [272] Vollmer, M. K., Reimann, S., Hill, M., & Brunner, D. (2020). Update to Vollmer, M. K., S. Reimann, M. Hill, D. Brunner, First observations of the fourth generation synthetic halocarbons HFC-1234yf, HFC-1234ze(E), and HCFC-1233zd(E) in the atmosphere. Environ Sci Technol, 49, 2703–2708, https://doi.org/10.1021/es505123x. https://www.empa.ch/documents/56101/190047/HFO+update+Report/fe3b26b5-fcb6-4cd9-a6f6-5c39ac01f20a. Accessed 2 July 2022 source
plainstates an association- Asserted: passes — The authors put it forward as true.
- Checkable: passes — It can be checked against evidence.
- Load-bearing: unclear — It is unclear whether the paper’s conclusions depend on it.
- Based: passes — The paper gives a reason why it holds.
It may state two separate claims as one.
A conclusion the paper draws from its own results — it cites no other source for it, so there is none to check. The quote shows it is in the paper.
In the paper
“It is formed from combustion of fluoropolymers and as a terminal breakdown product of fluorinated pharmaceuticals and pesticides.”
§ Changes in tropospheric air quality related to the protection of stratospheric ozone in a changing climate > Trifluoroacetic acid in the global environment with relevance to the Montreal Protocol > Conclusions and uncertainties
plainstates a cause- Asserted: passes — The authors put it forward as true.
- Checkable: passes — It can be checked against evidence.
- Load-bearing: unclear — It is unclear whether the paper’s conclusions depend on it.
- Based: passes — The paper gives a reason why it holds.
It may state two separate claims as one.
In the paper
“In effect, the SCI-mediated oxidation products were found to have no significant impact on concentrations or distributions of TFA in the atmosphere [216] and this is not a pathway for net destruction of TFA in the environment.”
§ Changes in tropospheric air quality related to the protection of stratospheric ozone in a changing climate > Trifluoroacetic acid in the global environment with relevance to the Montreal Protocol > Other issues relevant to the degradation of fluorinated chemicals and release of TFA
What the sources say
- Not checked yetcites [216] Holland, R., Khan, M. A. H., Driscoll, I., Chhantyal-Pun, R., Derwent, R. G., Taatjes, C. A., Orr-Ewing, A. J., Percival, C. J., & Shallcross, D. E. (2021). Investigation of the production of trifluoroacetic acid from two halocarbons, HFC-134a and HFO-1234yf and its fates using a global three-dimensional chemical transport model. ACS Earth and Space Chemistry, 5, 849–857. https://doi.org/10.1021/acsearthspacechem.0c00355 source
plain- Asserted: passes — The authors put it forward as true.
- Checkable: passes — It can be checked against evidence.
- Load-bearing: unclear — It is unclear whether the paper’s conclusions depend on it.
- Based: passes — The paper gives a reason why it holds.
It may state two separate claims as one.
A conclusion the paper draws from its own results — it cites no other source for it, so there is none to check. The quote shows it is in the paper.
In the paper
“The Montreal Protocol has prevented large increases in UV-B radiation”
§ Changes in tropospheric air quality related to the protection of stratospheric ozone in a changing climate > Overall conclusions
plainstates a cause- Asserted: passes — The authors put it forward as true.
- Checkable: passes — It can be checked against evidence.
- Load-bearing: passes — The paper’s conclusions depend on it.
- Based: fails — The paper may give no reason why it holds.
Probably not a substantial claim. The paper may give no reason why it holds.
A conclusion the paper draws from its own results — it cites no other source for it, so there is none to check. The quote shows it is in the paper.
In the paper
“Amounts released from degradation of pharmaceuticals are very uncertain and amounts from fugitive releases from manufacturing are completely unknown.”
§ Changes in tropospheric air quality related to the protection of stratospheric ozone in a changing climate > Trifluoroacetic acid in the global environment with relevance to the Montreal Protocol > Conclusions and uncertainties
plain- Asserted: passes — The authors put it forward as true.
- Checkable: passes — It can be checked against evidence.
- Load-bearing: unclear — It is unclear whether the paper’s conclusions depend on it.
- Based: passes — The paper gives a reason why it holds.
It may state two separate claims as one.
A conclusion the paper draws from its own results — it cites no other source for it, so there is none to check. The quote shows it is in the paper.
In the paper
“The margin of exposure between the distribution of NOECs and the observed and expected concentrations in the oceans and endorheic basins is several orders of magnitude and is indicative of de minimis risk.”
§ Changes in tropospheric air quality related to the protection of stratospheric ozone in a changing climate > Trifluoroacetic acid in the global environment with relevance to the Montreal Protocol > Human and environmental risks associated with trifluoroacetic acid in the environment
hedged- Asserted: passes — The authors put it forward as true.
- Checkable: passes — It can be checked against evidence.
- Load-bearing: passes — The paper’s conclusions depend on it.
- Based: passes — The paper gives a reason why it holds.
It may state two separate claims as one.
A conclusion the paper draws from its own results — it cites no other source for it, so there is none to check. The quote shows it is in the paper.
In the paper
“Those pharmaceuticals that contain the C–CF3 moiety are expected to be a source of TFA in the environment but there are two unknowns, the yield of TFA from the breakdown of the pharmaceutical and the amounts of pharmaceuticals that are used.”
§ Changes in tropospheric air quality related to the protection of stratospheric ozone in a changing climate > Trifluoroacetic acid in the global environment with relevance to the Montreal Protocol > Other sources of trifluoroacetic acid in the global environment
plainstates a possible cause- Asserted: passes — The authors put it forward as true.
- Checkable: passes — It can be checked against evidence.
- Load-bearing: unclear — It is unclear whether the paper’s conclusions depend on it.
- Based: passes — The paper gives a reason why it holds.
It may state two separate claims as one.
In the paper
“TFA enhances the formation rate of new dimethylamine/sulfuric particles significantly (up to 227-fold [278]), but only under conditions of relatively low temperatures and sulfuric acid concentrations, and relatively high TFA and dimethylamine concentration.”
§ Changes in tropospheric air quality related to the protection of stratospheric ozone in a changing climate > Trifluoroacetic acid in the global environment with relevance to the Montreal Protocol > Other issues relevant to the degradation of fluorinated chemicals and release of TFA
What the sources say
- Not checked yetcites [278] Liu, L., Yu, F., Tu, K., Yang, Z., & Zhang, X. (2021). Influence of atmospheric conditions on the role of trifluoroacetic acid in atmospheric sulfuric acid–dimethylamine nucleation. Atmospheric Chemistry and Physics, 21(8), 6221–6230. https://doi.org/10.5194/acp-21-6221-2021 source
plainstates a cause- Asserted: passes — The authors put it forward as true.
- Checkable: passes — It can be checked against evidence.
- Load-bearing: unclear — It is unclear whether the paper’s conclusions depend on it.
- Based: passes — The paper gives a reason why it holds.
It may state two separate claims as one.
The paper relies on this without support.
Secondary aerosols are generated by UV-driven photochemistry.
“This is of direct relevance to the Montreal Protocol, since secondary aerosols are generated by UV-driven photochemistry.”
The paper relies on this without support.
The hydroxyl radical is the major oxidant in the troposphere and its concentration largely determines the lifetime of many tropospheric pollutants.
“The hydroxyl radical (OH) is the major oxidant in the troposphere and its concentration largely determines the lifetime of many tropospheric pollutants.”
The paper relies on this without support.
OH is produced via UV-B photolysis of O3.
“It is produced via UV-B photolysis of O3 (see Fig. 1).”
The authors state this as an assumption.
TFA is evenly distributed across all oceans when estimating 2100 ocean concentrations.
“if evenly distributed across all oceans”
The authors state this as an assumption.
The proportions of TFA from other refrigerants in Germany can be applied to the global estimate of deposition.
“If the proportions of TFA from other refrigerants in Germany are applied to the global estimate of deposition”
The authors state this as an assumption.
The ten-fold range used to estimate total oceanic TFA from measured concentrations is appropriate.
“using an estimated ten-fold range”
The paper relies on this without support.
The total known use and release of HFC-134a, HFC-143a, and HFC-227ea between 1990 and 2015 is complete for calculating the theoretical maximum TFA production.
“From the total known use and release of HFC-134a, HFC-143a, and HFC-227ea between 1990 and 2015, the total amount of TFA that could theoretically have been produced is 4.5 × 10⁶ tons.”
The authors state this as an assumption.
The degradation half-life of TFA in the environment is very long (approximately centuries).
“If, as seems to be the case, the half-life is likely very long (≈ centuries)”
The paper relies on this without support.
Increases in the activity of enzymes in or originating from the liver are considered as compensatory unless accompanied by physiological responses such as loss of weight.
“Increases in the activity of enzymes in or originating from the liver are considered as compensatory unless accompanied by physiological responses such as loss of weight.”
The paper relies on this without support.
HFOs have very short atmospheric lifespans and do not contribute to climate change.
“Because of this, there is a trend to replace long-lived HCFCs and HFCs with HFOs, which have very short atmospheric lifespans and do not contribute to climate change.”
The paper relies on this without support.
Fugitive releases have resulted in high levels of contamination near manufacturing facilities and TFA is routinely detected in surface waters.
“Fugitive releases have resulted in high levels of contamination near manufacturing facilities and TFA is routinely detected in surface waters.”
The authors state this as an assumption.
The actual yield of TFA from pesticides is dependent on other substituents on the molecule and the primary driver(s) of degradation, so the calculated yields based on molecular weight ratios are conservative.
“This is a conservative assumption as the actual yield of TFA is dependent on other substituents on the molecule and the primary driver(s) of degradation.”
The paper relies on this without support.
Poor air quality remains a major health problem globally, despite progress in reducing anthropogenic emissions of air pollutants.
“Poor air quality remains a major health problem globally, despite progress in reducing anthropogenic emissions of air pollutants.”
Claims other papers make about this one
Each is checked against this paper’s own text: does it say what the citing paper says it does?
The source backs part of the claim, not all of it — or backs it for a different population, condition or comparison.
In the citing paper
“The inclusion of CF3H generated by ozonolysis does not alter our previous assessments [84, 85] that HFOs have minimal contributions to the radiative forcing of climate change.”
From Environmental consequences of interacting effects of changes in stratospheric ozone, ultraviolet radiation, and climate: UNEP Environmental Effects Assessment Panel, Update 2024 (2025) · cites this paper as [85]
Experimental — accuracy not yet measuredThe cited source says what the claim attributes to it.
In the citing paper
“The current concentrations of TFA in drinking water and surface waters remain below current thresholds of concern for human and ecological health [85, 94].”
The cited source says what the claim attributes to it.
In the citing paper
“Therefore, there is no change to the previous assessment of de minimis risk from TFA to the environment and human health [84, 85].”
The cited source says what the claim attributes to it.
In the citing paper
“As discussed in our previous assessments [84, 85], photolysis is an important mechanism through which CF3CHO is lost from the atmosphere.”
Self-check
Percentages, sums and reported differences re-computed from the paper’s own numbers.
Each contradiction between two passages listed here was confirmed by an independent check.
Rated minor: it would not touch a result — a value no result rests on, a p-value that stays on the same side of the significance level, or a conflict that is clerical, resolved elsewhere in the paper, or outside its own findings.
In the paper
§ Changes in tropospheric air quality related to the protection of stratospheric ozone in a changing climate > UV-dependent air pollutants and their effects on human health, plants, and the self-cleaning capacity of the troposphere > Health impacts of photochemical smog
“OR: 1.019”
§ Changes in tropospheric air quality related to the protection of stratospheric ozone in a changing climate > UV-dependent air pollutants and their effects on human health, plants, and the self-cleaning capacity of the troposphere > Health impacts of photochemical smog
“95% CI 1.1013–1.024”
Rated minor: it would not touch a result — a value no result rests on, a p-value that stays on the same side of the significance level, or a conflict that is clerical, resolved elsewhere in the paper, or outside its own findings.
In the paper
§ Changes in tropospheric air quality related to the protection of stratospheric ozone in a changing climate > UV-dependent air pollutants and their effects on human health, plants, and the self-cleaning capacity of the troposphere > Effects of tropospheric ozone and particulates on plants
“The loss from O3 is greater than that from aerosols but they do act additively.”
§ Changes in tropospheric air quality related to the protection of stratospheric ozone in a changing climate > UV-dependent air pollutants and their effects on human health, plants, and the self-cleaning capacity of the troposphere > Effects of tropospheric ozone and particulates on plants
“Economic yield was reduced 34% in wheat exposed to O3 and PM, 44% in wheat exposed to PM only and 52% in plants exposed to O3 alone.”
Citations
Cites
Climate Change 2007: The Physical Science Basis.
Schiavon, S., & Zecchin, R. (2007) · eScholarship (California Digital Library) · Cited by 16,994
Atmospheric chemistry and physics: from air pollution to climate change
(2007) · Choice Reviews Online · doi:10.5860/choice.44-4512 · Cited by 4,437
Chemistry of Atmospheric Brown Carbon
Laskin, A., Laskin, J., & Nizkorodov, S. A. (2015) · Chemical Reviews · doi:10.1021/cr5006167 · Cited by 1,966
Contribution of Organofluorine Compounds to Pharmaceuticals
Inoue, M., Sumii, Y., & Shibata, N. (2020) · ACS Omega · doi:10.1021/acsomega.0c00830 · Cited by 1,944
Anthropogenic drivers of 2013–2017 trends in summer surface ozone in China
Li, K., Jacob, D. J., Liao, H., Shen, L., Zhang, Q., & Bates, K. H. (2019) · Proceedings of the National Academy of Sciences · doi:10.1073/pnas.1812168116 · Cited by 1,804
Development of Ozone Reactivity Scales for Volatile Organic Compounds
Carter, W. P. L. (1994) · Air & Waste · doi:10.1080/1073161x.1994.10467290 · Cited by 1,518
Air Pollution and Cardiovascular Disease
Rajagopalan, S., Al-Kindi, S. G., & Brook, R. D. (2018) · Journal of the American College of Cardiology · doi:10.1016/j.jacc.2018.07.099 · Cited by 1,299
Current Contributions of Organofluorine Compounds to the Agrochemical Industry
Ogawa, Y., Tokunaga, E., Kobayashi, O., Hirai, K., & Shibata, N. (2020) · iScience · doi:10.1016/j.isci.2020.101467 · Cited by 1,253
Chen, J., & Hoek, G. (2020) · Environment International · doi:10.1016/j.envint.2020.105974 · Cited by 1,042
Risk to human health related to the presence of perfluoroalkyl substances in food
Panel), E. P. O. C. I. T. F. C. (. C., Schrenk, D., Bignami, M., Bodin, L., Chipman, J. K., del Mazo, J., Grasl‐Kraupp, B., Hogstrand, C., Hoogenboom, L. (., Leblanc, J., et al. (2020) · EFSA Journal · doi:10.2903/j.efsa.2020.6223 · Cited by 989
Research works printed but not linked: 14
- WHO. (2021). WHO global air quality guidelines: Particulate matter (PM2.5 and PM10), ozone, nitrogen dioxide, sulfur dioxide and carbon monoxide. Geneva: World Health Organization
- WHO. (2017). Evolution of WHO air quality guidelines: Past, present and future (2017). World Health Organization
- WHO. (2006). Air Quality guidelines: global update 2005: Particulate matter, ozone, nitrogen dioxide and sulfur dioxide (Vol. EUR/05/5046029). World Health Organization. Regional Office for Europe
- DEPA. (2015). Short-chain polyfluoroalkyl substances (PFAS) (Vol. 1707). Danish Environmental Protection Agency
- NICNAS. (2016). Short chain perfluorocarboxylic acids and their direct precursors: human health tier II assessment. National Industrial Chemicals Notification and Assessment Scheme (NICNAS)
- ECCC. (2022). Canada’s great lakes strategy for PFOS, PFOA, and LC-PFCAs risk management. Environment and Climate Change Canada
- PubChem. (2022). Trifluoroacetic acid. https://pubchem.ncbi.nlm.nih.gov/compound/6422. Accessed 1 Jan 2022
- Chabot, L. (2017). ALGA, GROWTH INHIBITION TEST Effect of the trifuoroacetic acid on the growth of the unicellular alga Pseudokirchneriella subcapitata, according to OECD guideline 201 (Study conducted for RHODIA OPERATIONS – SOLVAY). Vol. 17-005-167094. Verneuil-En-Halatte
- IPCC. (2021). Climate change 2021: The physical science basis. Contribution of Working Group I to the Sixth Assessment Report of the Intergovernmental Panel on Climate Change. Cambridge University Press
- UBA. (2021). Persistent degradation products of halogenated refrigerants and blowing agents in the environment: Type, environmental concentrations, and fate with particular regard to new halogenated substitutes with low global warming potential (Vol. FB000452/ENG). Umwelt Bundesamt
- UBA. (2021). Reducing Chemical Input into Water Bodies – Trifluoroacetate (TFA) as a Persistent and Mobile Substance from Many Sources. Umweld Bundesampt German Environment Agency. ISSN 2363-829X
- UBA. (2019). Ableitung Eines Gesundheitlichen Leitwertes für Trifluoressigsäure (TFA). Umwelt Bundesampt
- IPCC/TEAP. (2005). Special report safeguarding the ozone layer and the global climate system: Issues related to hydrofluorocarbons and perfluorocarbons. World Meteorological Organization (WMO) ; Intergovernmental Panel on Climate Change; United Nations Environment Programme
- Vollmer, M. K., Reimann, S., Hill, M., & Brunner, D. (2020). Update to Vollmer, M. K., S. Reimann, M. Hill, D. Brunner, First observations of the fourth generation synthetic halocarbons HFC-1234yf, HFC-1234ze(E), and HCFC-1233zd(E) in the atmosphere. Environ Sci Technol, 49, 2703–2708, https://doi.org/10.1021/es505123x. https://www.empa.ch/documents/56101/190047/HFO+update+Report/fe3b26b5-fcb6-4cd9-a6f6-5c39ac01f20a. Accessed 2 July 2022 · DOI · Paper page
Cited by
Sorted by citations
Air pollution and climate change as grand challenges to sustainability
Afifa, Arshad, K., Hussain, N., Ashraf, M. H., & Saleem, M. (2024) · The Science of The Total Environment · doi:10.1016/j.scitotenv.2024.172370 · Cited by 347
The Global Threat from the Irreversible Accumulation of Trifluoroacetic Acid (TFA)
Arp, H. P. H., Gredelj, A., Glüge, J., Scheringer, M., & Cousins, I. T. (2024) · Environmental Science & Technology · doi:10.1021/acs.est.4c06189 · Cited by 283
The effects of exposure to solar radiation on human health
Neale, R. Ε., Lucas, R. M., Byrne, S. N., Hollestein, L. M., Rhodes, L. E., Yazar, S., Young, A. R., Berwick, M., Ireland, R. A., & Olsen, C. M. (2023) · Photochemical & Photobiological Sciences · doi:10.1007/s43630-023-00375-8 · Cited by 180
Stratospheric ozone, UV radiation, and climate interactions
Bernhard, G. H., Bais, A. F., Aucamp, P. J., Klekociuk, A. R., Liley, J. B., & McKenzie, R. L. (2023) · Photochemical & Photobiological Sciences · doi:10.1007/s43630-023-00371-y · Cited by 138
Barnes, P. W., Robson, T. M., Zepp, R. G., Bornman, J. F., Jansen, M. A. K., Ossola, R., Wang, Q.-W., Robinson, S. A., Foereid, B., Klekociuk, A. R., et al. (2023) · Photochemical & Photobiological Sciences · doi:10.1007/s43630-023-00376-7 · Cited by 113
Metadata
- Authors
- Madronich, S., Sulzberger, B., Longstreth, J. D., Schikowski, T., Andersen, M. P. S., Solomon, K. R., & Wilson, S. R.
- Affiliations
- NSF National Center for Atmospheric Research (US)
- Swiss Federal Institute of Aquatic Science and Technology (CH)
- Leibniz Institute of Environmental Medicine (DE)
- California State University, Northridge (US)
- University of Guelph (CA)
- University of Wollongong (AU)
- Corresponding author
- Madronich, S.
- Wilson, S. R.
- ORCID
- Venue
- Photochemical & Photobiological Sciences
- Published
- 2023-06-13
- Volume
- 22
- Issue
- 5
- Pages
- 1129-1176
- ISSN
- 1474-905X (ISSN-L)
- 1474-9092
- PMC
- PMC10262938
- OpenAlex
- W4380422192
- Semantic Scholar
- 665b7bfcabc45131fd17451ac3d52a81ca0be6f8
- Cited by
- 64
- References
- 257
- Citations by year
- 2026: 14 · 2025: 21 · 2024: 22 · 2023: 7
- FWCI
- 7.05
- Type
- journal article
- Language
- en
- Open access
- hybrid
- doi.org
- Locations
- Photochemical & Photobiological Sciences (publishedVersion, cc-by)
- PubMed Central (publishedVersion, cc-by)
- PubMed (publishedVersion)
- DORA Eawag (Swiss Federal Institute of Aquatic Science and Technology (Eawag)) (submittedVersion, cc-by)
- Research Online (University of Wollongong) (submittedVersion)
- Figshare (submittedVersion)
- Funders
- U.S. Department of Agriculture
- Colorado State University
- National Institute of Food and Agriculture (2019‐34263‐30552:, 2022‐34263‐38472)
- Topics
- Physical Sciences › Earth and Planetary Sciences › Atmospheric Science › Atmospheric Ozone and Climate
- Physical Sciences › Earth and Planetary Sciences › Atmospheric Science › Atmospheric chemistry and aerosols
- Physical Sciences › Environmental Science › Global and Planetary Change › Atmospheric aerosols and clouds
- Keywords
- tropospheric ozone, particulate matter, stratospheric ozone recovery, Montreal Protocol, ultraviolet radiation, hydroxyl radicals, methane, ozone-depleting substances, hydrofluorocarbons, hydrofluoroolefins, trifluoroacetic acid, climate change, air quality, secondary organic aerosol, ozone transport
About these checks
Registry, retraction, Cites and statistics results are computed, not judged, with one exception: a printed reference that no index lists is read once by a model before it counts as a citation error. Claims are extracted by a model and kept only when their quote appears verbatim in the text; each cited source is then checked, with a model’s help, for whether it says what the claim relies on. Those verdicts can be wrong — read the claim’s quote and the cited source before relying on one.
A language model drew the claims from the paper on 2026-10-07, under version 3 of the claim definition (model deepseek-v4.1-flash, prompt extract-v3).
A second model labelled each claim on 2026-10-07 (model jev-1.13-20260917, definition revision gold-guideline-v0.2).
Cited sources are checked with a language model’s help (gpt-6-sol).
Statistics and arithmetic are recomputed, not judged.
Confidence bands are shown only for fields calibrated on our annotated test set. None is calibrated yet, so no band is shown.
What counts as a claim ›How we measure confidence ›How we check this ›
Are you an author, or do you see a problem with this page? Request a review
