

The DOI matches its Crossref record; 44 of the 46 references it cites were found in a registry or an index.
Characterizing long COVID in an international cohort: 7 months of symptoms and their impact
Open accessPublished version of a preprint
Abstract
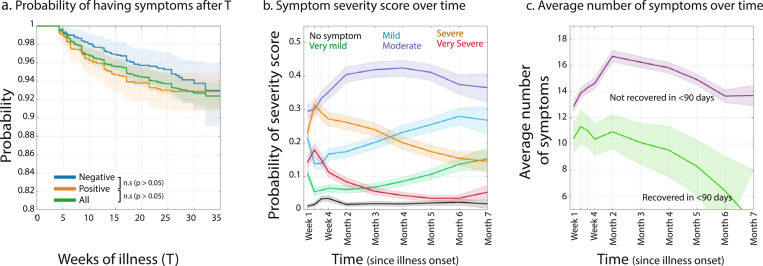
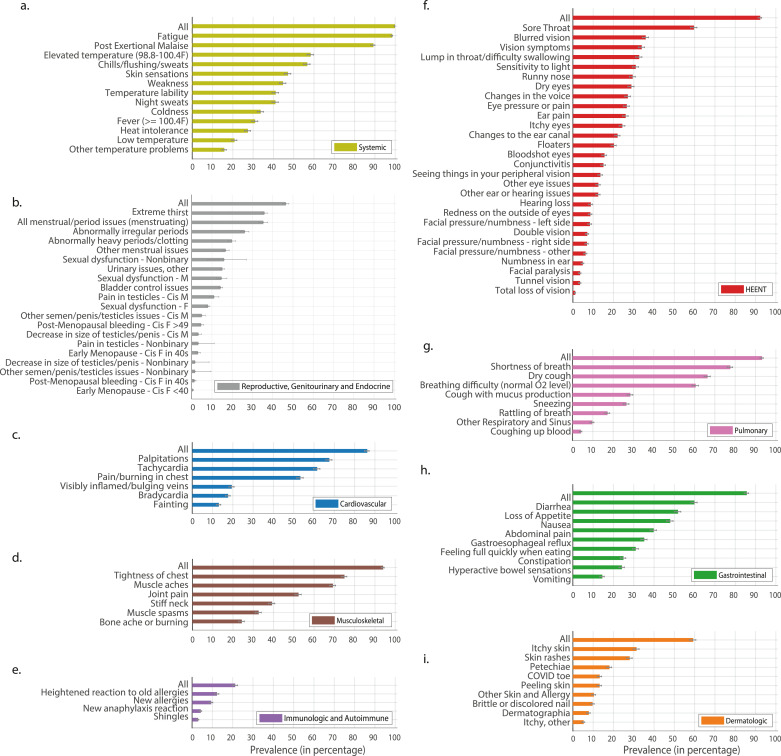
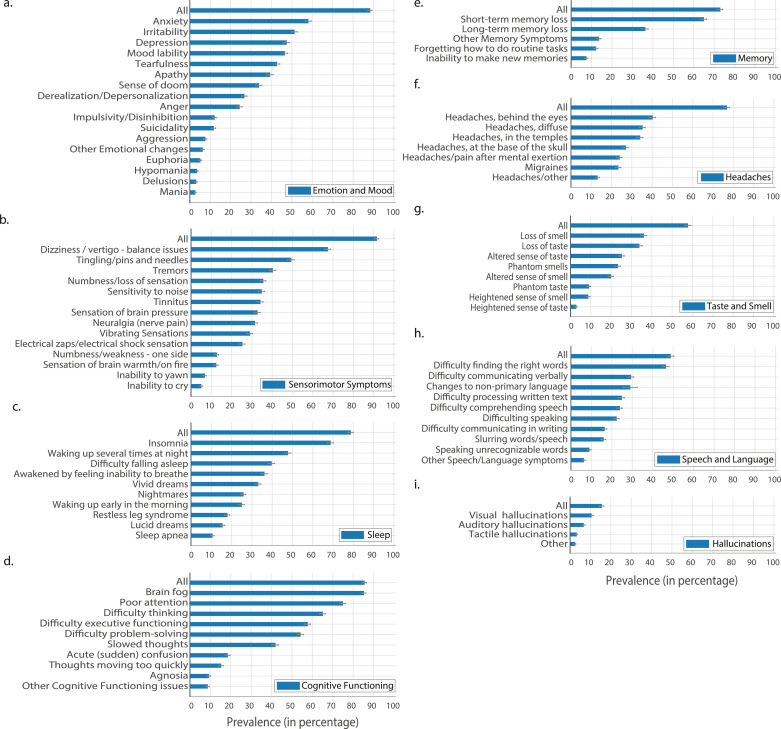
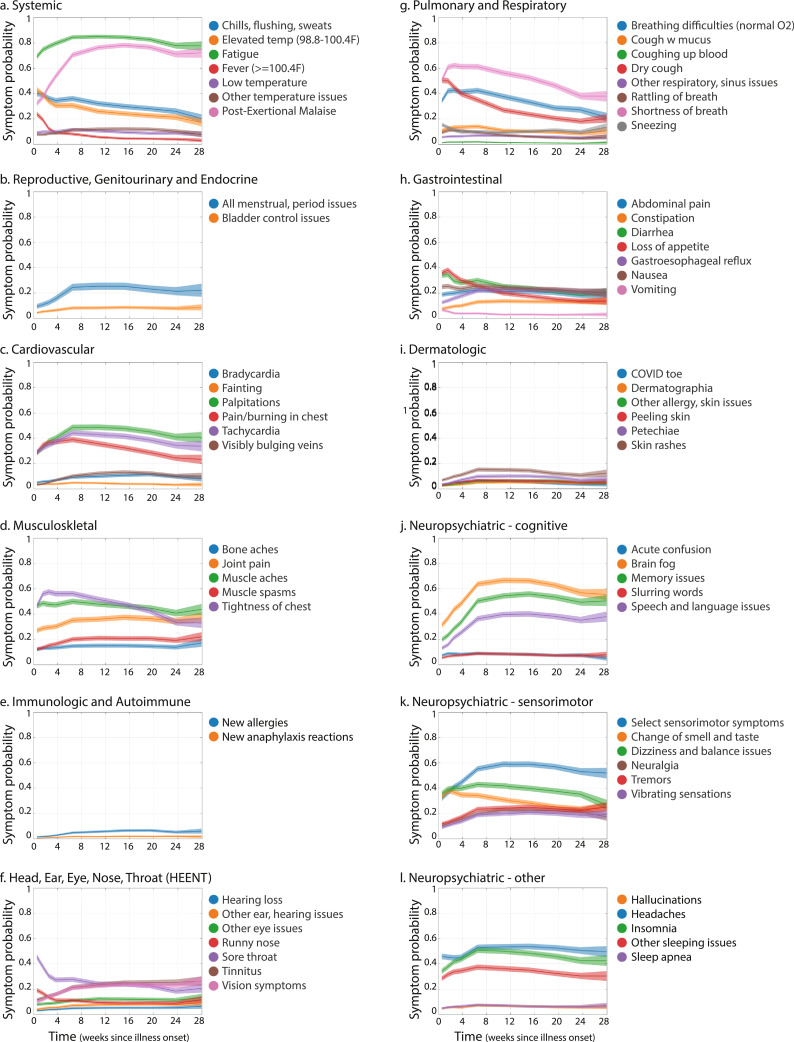
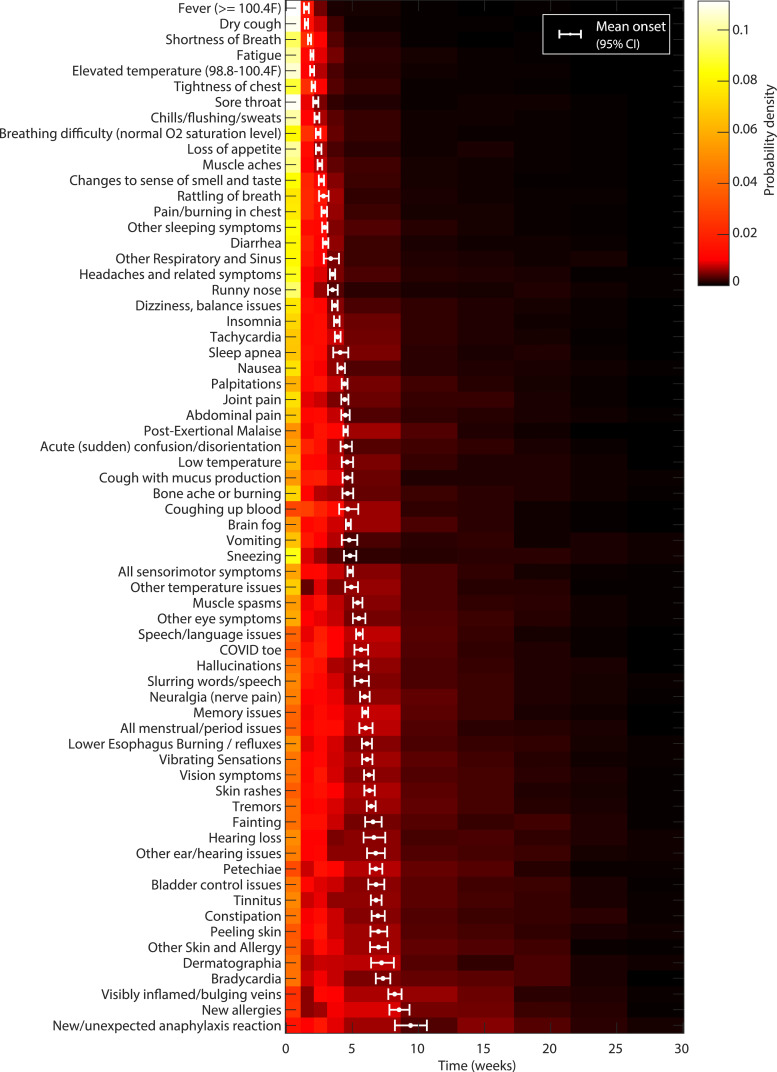
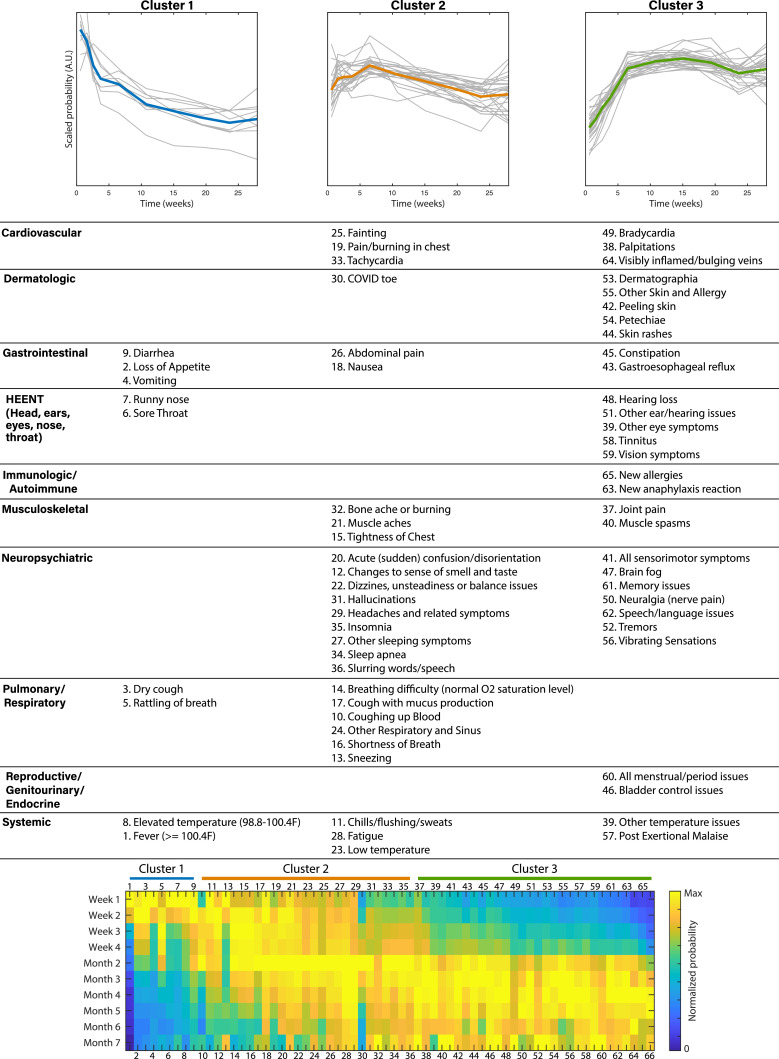
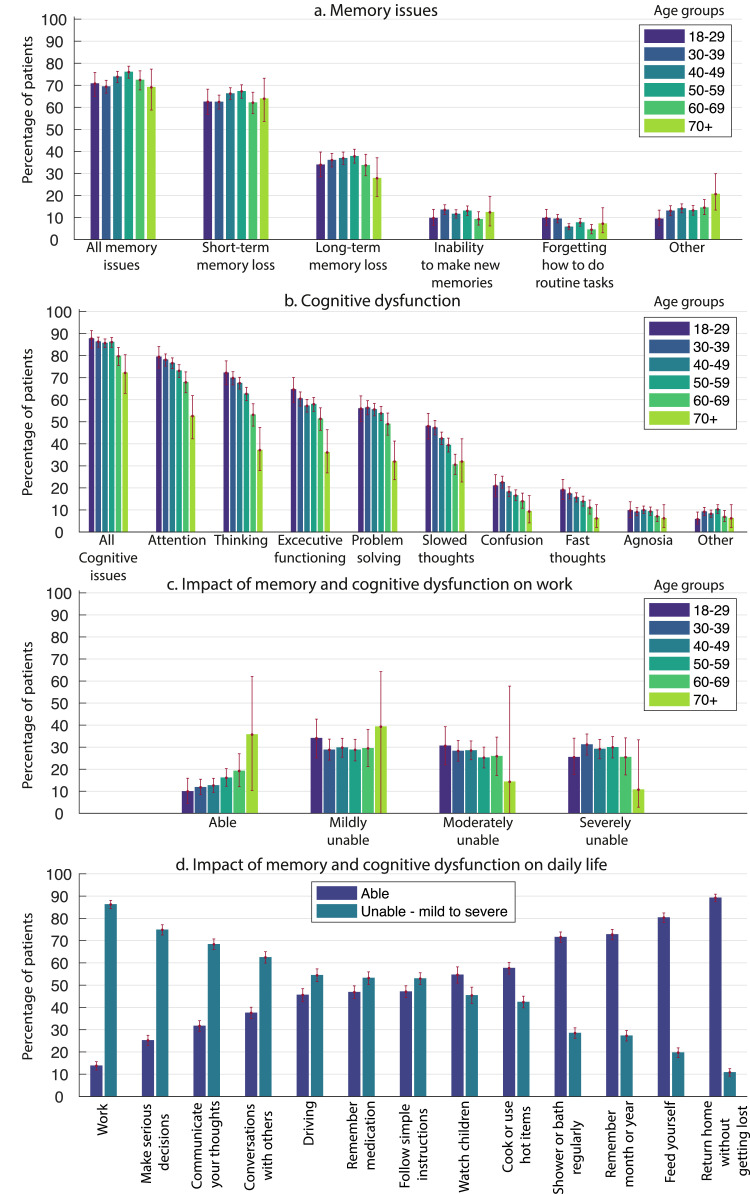
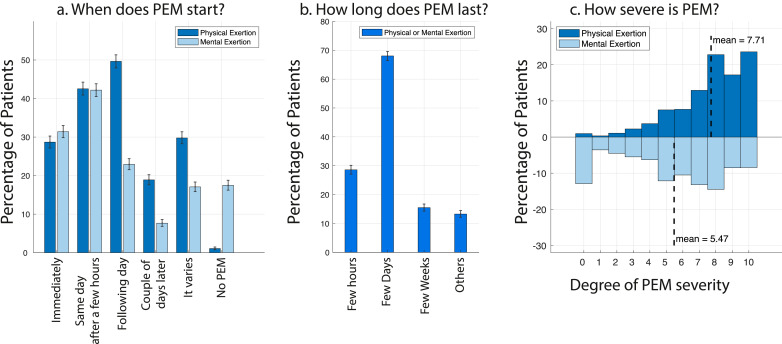
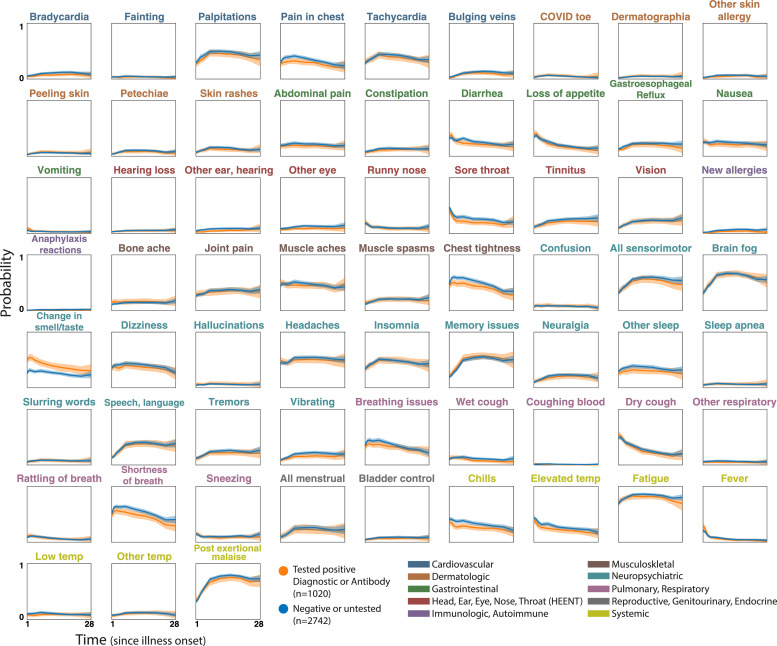
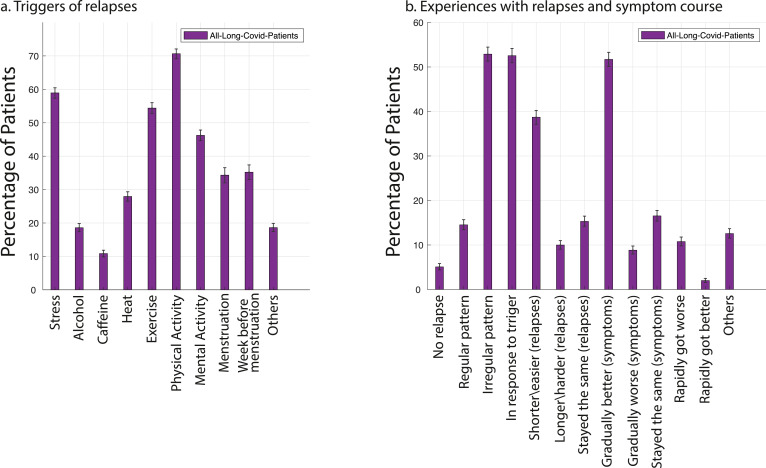
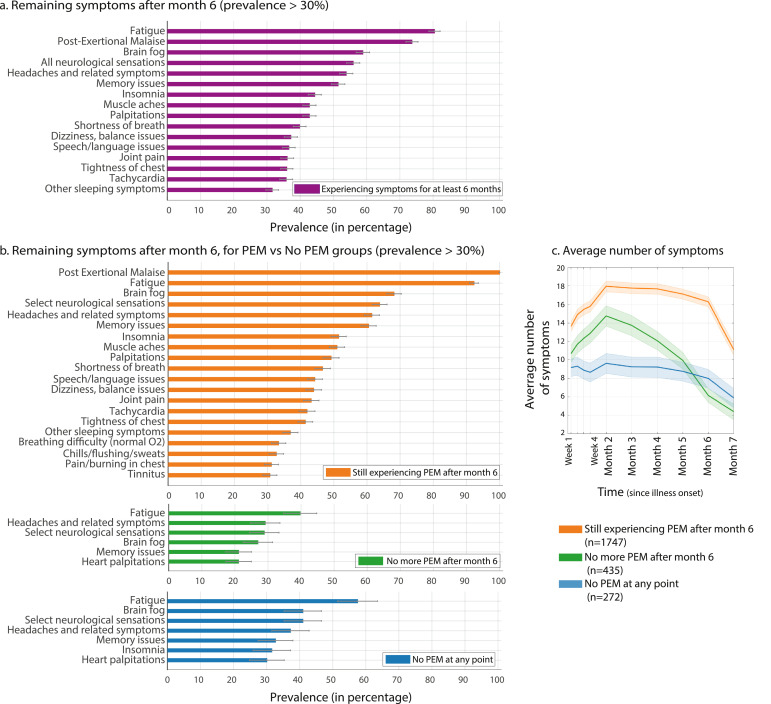
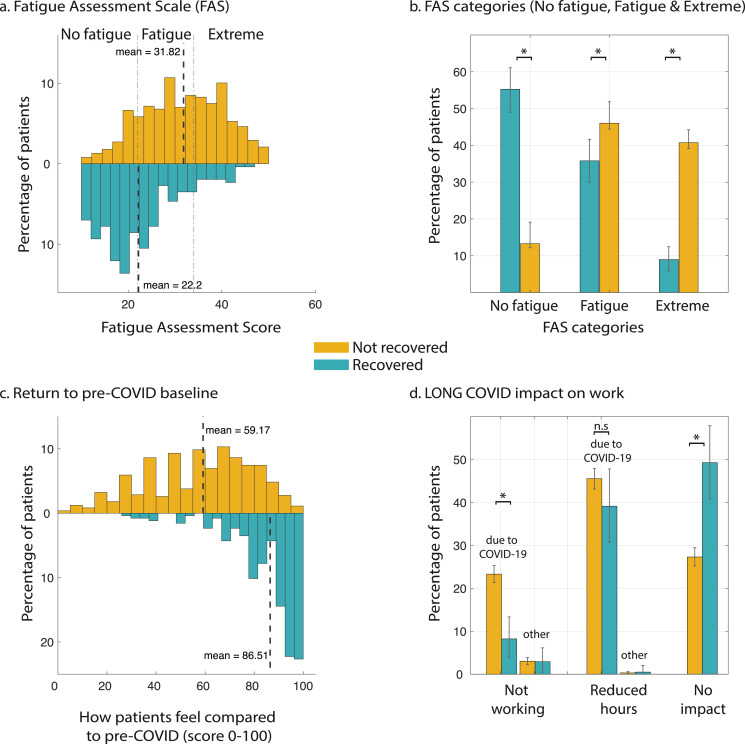
BACKGROUND: A significant number of patients with COVID-19 experience prolonged symptoms, known as Long COVID. Few systematic studies have investigated this population, particularly in outpatient settings. Hence, relatively little is known about symptom makeup and severity, expected clinical course, impact on daily functioning, and return to baseline health. METHODS: We conducted an online survey of people with suspected and confirmed COVID-19, distributed via COVID-19 support groups (e.g. Body Politic, Long COVID Support Group, Long Haul COVID Fighters) and social media (e.g. Twitter, Facebook). Data were collected from September 6, 2020 to November 25, 2020. We analyzed responses from 3762 participants with confirmed (diagnostic/antibody positive; 1020) or suspected (diagnostic/antibody negative or untested; 2742) COVID-19, from 56 countries, with illness lasting over 28 days and onset prior to June 2020. We estimated the prevalence of 203 symptoms in 10 organ systems and traced 66 symptoms over seven months. We measured the impact on life, work, and return to baseline health. FINDINGS: For the majority of respondents (>91%), the time to recovery exceeded 35 weeks. During their illness, participants experienced an average of 55.9+/- 25.5 (mean+/-STD) symptoms, across an average of 9.1 organ systems. The most frequent symptoms after month 6 were fatigue, post-exertional malaise, and cognitive dysfunction. Symptoms varied in their prevalence over time, and we identified three symptom clusters, each with a characteristic temporal profile. 85.9% of participants (95% CI, 84.8% to 87.0%) experienced relapses, primarily triggered by exercise, physical or mental activity, and stress. 86.7% (85.6% to 92.5%) of unrecovered respondents were experiencing fatigue at the time of survey, compared to 44.7% (38.5% to 50.5%) of recovered respondents. 1700 respondents (45.2%) required a reduced work schedule compared to pre-illness, and an additional 839 (22.3%) were not working at the time of survey due to illness. Cognitive dysfunction or memory issues were common across all age groups (~88%). Except for loss of smell and taste, the prevalence and trajectory of all symptoms were similar between groups with confirmed and suspected COVID-19. INTERPRETATION: Patients with Long COVID report prolonged, multisystem involvement and significant disability. By seven months, many patients have not yet recovered (mainly from systemic and neurological/cognitive symptoms), have not returned to previous levels of work, and continue to experience significant symptom burden. FUNDING: All authors contributed to this work in a voluntary capacity. The cost of survey hosting (on Qualtrics) and publication fee was covered by AA's research grant (Wellcome Trust/Gatsby Charity via Sainsbury Wellcome center, UCL).
Overview
The claims and statistics of this paper haven’t been checked yet.
Run the check — free, no account needed. It reads the open-access text and checks the sources it cites.
Integrity signals
Registry
Cites
Statistics
Figures
Verification
Claims the paper makes
The claims and statistics of this paper haven’t been checked yet.
Run the check — free, no account needed. It reads the open-access text and checks the sources it cites.
Claims other papers make about this one
Each is checked against this paper’s own text: does it say what the citing paper says it does?
The source backs part of the claim, not all of it — or backs it for a different population, condition or comparison.
In the citing paper
“Identifying subjects who are at risk of higher perceived loneliness and related psychological factors is particularly important in the context of the so called “long COVID” syndrome [50]”
From Psychological correlates of perceived loneliness in college students before and during the COVID-19 stay-at-home period: a longitudinal study (2023) · cites this paper as [50]
Experimental — accuracy not yet measuredIn the citing paper
“These symptoms can endure up to 6–7 months and even longer [[1], [2], [3], [4], [5]].”
From Female gender is associated with long COVID syndrome: a prospective cohort study (2022) · cites this paper as [3]
Self-check
Percentages, sums and reported differences re-computed from the paper’s own numbers.
The self-check needs the paper’s full text.
Citations
Cites
Persistent Symptoms in Patients After Acute COVID-19
Carfì, A., Bernabei, R., Landi, F., & for the Gemelli Against COVID-19 Post-Acute Care Study Group (2020) · JAMA · doi:10.1001/jama.2020.12603 · Cited by 4,561
Natural language processing with Python
Bird, S., Klein, E., & Loper, E. (2009) · CERN Document Server (European Organization for Nuclear Research) · Cited by 3,472
Better Bootstrap Confidence Intervals
Efron, B. (1987) · Journal of the American Statistical Association · doi:10.1080/01621459.1987.10478410 · Cited by 3,462 · cited 2×
“tical dashed lines indicate the range for “No fatigue”[10-21], “Fatigue”[22-34], and “Extreme” (>=35).”
MethodAttributes and predictors of long COVID
Sudre, C. H., Murray, B., Varsavsky, T., Graham, M. S., Penfold, R. S., Bowyer, R. C., Pujol, J. C., Klaser, K., Antonelli, M., Canas, L. S., et al. (2021) · Nature Medicine · doi:10.1038/s41591-021-01292-y · Cited by 2,707
Management of post-acute covid-19 in primary care
Greenhalgh, T., Knight, M., A’Court, C., Buxton, M., & Husain, L. (2020) · BMJ · doi:10.1136/bmj.m3026 · Cited by 1,771 · cited 1×
“While respiratory and some cardiovascular symptoms have been widely reported, neurological symptoms remain unclear [33].”
BackgroundEvolution of antibody immunity to SARS-CoV-2
Gaebler, C., Wang, Z., Lorenzi, J. C. C., Muecksch, F., Finkin, S., Tokuyama, M., Cho, A., Jankovic, M., Schaefer-Babajew, D., Oliveira, T. Y., et al. (2021) · Nature · doi:10.1038/s41586-021-03207-w · Cited by 1,674
High-dimensional characterization of post-acute sequelae of COVID-19
Al-Aly, Z., Xie, Y., & Bowe, B. (2021) · Nature · doi:10.1038/s41586-021-03553-9 · Cited by 1,518
Kucirka, L. M., Lauer, S. A., Laeyendecker, O. B., Boon, D., & Lessler, J. (2020) · Annals of Internal Medicine · doi:10.7326/m20-1495 · Cited by 1,414 · cited 1×
“Furthermore, the likelihood of false negatives increases after day 3 of symptom onset, when the false negative rate is 20%, reaching 66% by day 21[40].”
BackgroundTenforde, M. W., Kim, S. S., Lindsell, C. J., Billig Rose, E., Shapiro, N. I., Files, D. C., Gibbs, K. W., Erickson, H. L., Steingrub, J. S., Smithline, H. A., et al. (2020) · MMWR. Morbidity and Mortality Weekly Report · doi:10.15585/mmwr.mm6930e1 · Cited by 1,319 · cited 2×
“tical dashed lines indicate the range for “No fatigue”[10-21], “Fatigue”[22-34], and “Extreme” (>=35).”
BackgroundConcept Decompositions for Large Sparse Text Data Using Clustering
Dhillon, I. S., & Modha, D. S. (2001) · Machine Learning · doi:10.1023/a:1007612920971 · Cited by 1,308 · cited 1×
“Symptom time course clustering Symptom time courses were clustered using spherical k-means, a variant of k-means based on cosine distances [12].”
Research works printed but not linked: 3
- NIH workshop on post-acute sequelae of COVID-19 (Day 2) [Internet]. Available from: https://videocast.nih.gov/watch=38879
- Tang, 2020, 26, 1337
- Williams, 2021, A two-phase, single cohort study of COVID-19, Antibody Sera-Surveillance, 6
Cited by
Sorted by citations
Items 101–200 of 1,000
Psychiatric and neurological complications of long COVID
Zawilska, J. B., & Kuczyńska, K. (2022) · Journal of Psychiatric Research · doi:10.1016/j.jpsychires.2022.10.045 · Cited by 153
Post-acute COVID-19 syndrome in patients after 12 months from COVID-19 infection in Korea
Kim, Y., Bitna-Ha, Kim, S., Chang, H., Kwon, K. T., Bae, S., & Hwang, S. (2022) · BMC Infectious Diseases · doi:10.1186/s12879-022-07062-6 · Cited by 161
Postural orthostatic tachycardia syndrome as a sequela of COVID-19
Ormiston, C. K., Świątkiewicz, I., & Taub, P. R. (2022) · Heart Rhythm · doi:10.1016/j.hrthm.2022.07.014 · Cited by 154
Tunneling nanotubes provide a route for SARS-CoV-2 spreading
Pepe, A., Pietropaoli, S., Vos, M. R. J., Spaeth, G. B., & Zurzolo, C. (2022) · Science Advances · doi:10.1126/sciadv.abo0171 · Cited by 144
Systematic Review of the Prevalence of Long COVID
Woodrow, M., Carey, C., Ziauddeen, N., Thomas, R., Akrami, A., Lutje, V., Greenwood, D. C., & Alwan, N. A. (2023) · Open Forum Infectious Diseases · doi:10.1093/ofid/ofad233 · Cited by 162
Self-citationNeuroinflammation After COVID-19 With Persistent Depressive and Cognitive Symptoms
Braga, J., Lepra, M., Kish, S. J., Rusjan, P., Nasser, Z., Verhoeff, N., Vasdev, N., Bagby, M. R., Boileau, I., Husain, M. I., et al. (2023) · JAMA Psychiatry · doi:10.1001/jamapsychiatry.2023.1321 · Cited by 146
O’Connor, R. J., Preston, N., Parkin, A., Makower, S., Ross, D. H., Gee, J., Halpin, S. J., Horton, M., & Sivan, M. (2021) · Journal of Medical Virology · doi:10.1002/jmv.27415 · Cited by 139
Interleukin-6 as potential mediator of long-term neuropsychiatric symptoms of COVID-19
Kappelmann, N., Dantzer, R., & Khandaker, G. M. (2021) · Psychoneuroendocrinology · doi:10.1016/j.psyneuen.2021.105295 · Cited by 139
Long COVID: aiming for a consensus
Munblit, D., O’Hara, M. E., Akrami, A., Perego, E., Olliaro, P., & Needham, D. M. (2022) · The Lancet Respiratory Medicine · doi:10.1016/s2213-2600(22)00135-7 · Cited by 138
Self-citationLong-term gastrointestinal outcomes of COVID-19
Xu, E., Xie, Y., & Al‐Aly, Z. (2023) · Nature Communications · doi:10.1038/s41467-023-36223-7 · Cited by 141
Rando, H. M., Bennett, T. D., Byrd, J. B., Bramante, C. T., Callahan, T. J., Chute, C. G., Davis, H., Deer, R., Gagnier, J. J., Koraishy, F. M., et al. (2021) · medRxiv · doi:10.1101/2021.03.20.21253896 · Cited by 149
Self-citationAranjani, J. M., Manuel, A., Razack, H. I. A., & Mathew, S. T. (2021) · PLoS neglected tropical diseases · doi:10.1371/journal.pntd.0009921 · Cited by 136
Callan, C., Ladds, E. C., Husain, L., Pattinson, K. T. S., & Greenhalgh, T. (2022) · BMJ Open · doi:10.1136/bmjopen-2021-056366 · Cited by 151
Li, J., Zhou, Y., Ma, J., Zhang, Q., Shao, J., Liang, S., Yu, Y., Li, W., & Wang, C. (2023) · Signal Transduction and Targeted Therapy · doi:10.1038/s41392-023-01640-z · Cited by 150
Herrera, J. E., Niehaus, W., Whiteson, J. H., Azola, A. M., Baratta, J. M., Fleming, T. K., Kim, S. Y., Naqvi, H., Sampsel, S., Silver, J. K., et al. (2021) · PM&R · doi:10.1002/pmrj.12684 · Cited by 137
Vojdani, A., Vojdani, E., Saidara, E., & Maes, M. H. J. (2023) · Viruses · doi:10.3390/v15020400 · Cited by 138
Peluso, M. J., Kelly, J. D., Lu, S., Goldberg, S. A., Davidson, M. C., Mathur, S., Durstenfeld, M. S., Spinelli, M. A., Hoh, R., Tai, V., et al. (2021) · Open Forum Infectious Diseases · doi:10.1093/ofid/ofab640 · Cited by 128
Walker, S., Goodfellow, H., Pookarnjanamorakot, P., Murray, E., Bindman, J., BLANDFORD, A. E., Bradbury, K. J., Cooper, B., Hamilton, F. L., Hurst, J. R., et al. (2023) · BMJ Open · doi:10.1136/bmjopen-2022-069217 · Cited by 140
Hirschtick, J. L., Titus, A. R., Slocum, E. M., Power, L. E., Hirschtick, R. E., Elliott, M. R., McKane, P., & Fleischer, N. L. (2021) · Clinical Infectious Diseases · doi:10.1093/cid/ciab408 · Cited by 133
SARS-CoV-2 in immunocompromised individuals
DeWolf, S., Laracy, J. C., Perales, M., Kamboj, M., van den Brink, M. R. M., & Vardhana, S. A. (2022) · Immunity · doi:10.1016/j.immuni.2022.09.006 · Cited by 143
Persistent serum protein signatures define an inflammatory subcategory of long COVID
Talla, A., Vasaikar, S. V., Szeto, G. L., Lemos, M. P., Czartoski, J., Macmillan, H., Moodie, Z., Cohen, K. W., Ballweber-Fleming, L., Thomson, Z., et al. (2023) · Nature Communications · doi:10.1038/s41467-023-38682-4 · Cited by 138
Huang, Y., Pinto, M. D., Borelli, J. L., Mehrabadi, M. A., Abrihim, H., Dutt, N. D., Lambert, N., Nurmi, E. L., Chakraborty, R., Rahmani, A. M., et al. (2021) · medRxiv · doi:10.1101/2021.03.03.21252086 · Cited by 131
Bonilla, H. F., Quach, T. C., Tiwari, A., Bonilla, A., Miglis, M. G., Yang, P. C.-M., Eggert, L. E., Sharifi, H., Horomanski, A. L., Subramanian, A. K., et al. (2023) · Frontiers in Neurology · doi:10.3389/fneur.2023.1090747 · Cited by 139
Cassar, M. P., Tunnicliffe, E. M., Petousi, N., Lewandowski, A. J., Xie, C., Mahmod, M., Samat, A. H. A., Evans, R. A., Brightling, C. E., Ho, L., et al. (2021) · EClinicalMedicine · doi:10.1016/j.eclinm.2021.101159 · Cited by 132
Post-Acute Sequelae of COVID-19 and Cardiovascular Autonomic Dysfunction: What Do We Know?
Bisaccia, G., Ricci, F., Recce, V., Serio, A., Iannetti, G., Chahal, A. A., Ståhlberg, M., Khanji, M. Y., Fedorowski, A., & Gallina, S. (2021) · Journal of Cardiovascular Development and Disease · doi:10.3390/jcdd8110156 · Cited by 129
Tate, W. P., Walker, M., Sweetman, E., Helliwell, A., Peppercorn, K., Edgar, C. D., Blair, A., & Chatterjee, A. (2022) · Frontiers in Neurology · doi:10.3389/fneur.2022.877772 · Cited by 131
Shah, R., Ali, F. M., Nixon, S. J., Ingram, J. R., Salek, S., & Finlay, A. Y. (2021) · BMJ Open · doi:10.1136/bmjopen-2020-047680 · Cited by 130
The Relationship between Physical Activity and Long COVID: A Cross-Sectional Study
Wright, J., Astill, S. L., & Sivan, M. (2022) · International Journal of Environmental Research and Public Health · doi:10.3390/ijerph19095093 · Cited by 133
Strain, W. D., Sherwood, O., Banerjee, A., Van der Togt, V., Hishmeh, L., & Rossman, J. (2022) · Vaccines · doi:10.3390/vaccines10050652 · Cited by 122
Neuropsychiatric aspects of long COVID : A comprehensive review
Kubota, T., Kuroda, N., & Sone, D. (2022) · Psychiatry and Clinical Neurosciences · doi:10.1111/pcn.13508 · Cited by 129
Nirmatrelvir-Ritonavir and Symptoms in Adults With Postacute Sequelae of SARS-CoV-2 Infection
Geng, L. N., Bonilla, H. F., Hedlin, H., Jacobson, K. B., Tian, L., Jagannathan, P., Yang, P. C.-M., Subramanian, A. K., Liang, J. W., Shen, S., et al. (2024) · JAMA Internal Medicine · doi:10.1001/jamainternmed.2024.2007 · Cited by 126
Patel, M. A., Knauer, M. J., Nicholson, M., Daley, M., Nynatten, L. R. V., Martin, C. M., Patterson, E. K., Cepinskas, G., Seney, S. L., Dobretzberger, V., et al. (2022) · Molecular Medicine · doi:10.1186/s10020-022-00548-8 · Cited by 129
Epidemiological Impact of Myocarditis
Golpour, A., Patriki, D., Hanson, P., McManus, B. M., & Heidecker, B. (2021) · Journal of Clinical Medicine · doi:10.3390/jcm10040603 · Cited by 131
Neuropsychologic Profiles and Cerebral Glucose Metabolism in Neurocognitive Long COVID Syndrome
Dreßing, A., Bormann, T., Blazhenets, G., Schröter, N., Walter, L. I., Thurow, J., August, D., Hilger, H., Stete, K., Gerstacker, K., et al. (2021) · Journal of Nuclear Medicine · doi:10.2967/jnumed.121.262677 · Cited by 120
Patterns and predictors of sick leave after Covid-19 and long Covid in a national Swedish cohort
Westerlind, E., Palstam, A., Sunnerhagen, K. S., & Persson, H. (2021) · BMC Public Health · doi:10.1186/s12889-021-11013-2 · Cited by 122
Sivan, M., Parkin, A., Makower, S., & Greenwood, D. C. (2021) · Journal of Medical Virology · doi:10.1002/jmv.27456 · Cited by 137
Philip, K., Owles, H., McVey, S., Pagnuco, T., Bruce, K., Brunjes, H., Banya, W., Mollica, J., Lound, A., Zumpe, S., et al. (2022) · The Lancet Respiratory Medicine · doi:10.1016/s2213-2600(22)00125-4 · Cited by 85
Long Covid: where we stand and challenges ahead
Mantovani, A., Morrone, M. C., Patrono, C., Santoro, M., Schiaffino, S., Remuzzi, G., Bussolati, G., On behalf of the Covid-19 Commission of the Accademia Nazionale dei Lincei, Cappuccinelli, P., Fitzgerald, G., et al. (2022) · Cell Death and Differentiation · doi:10.1038/s41418-022-01052-6 · Cited by 124
Defining long COVID: Going back to the start
Alwan, N. A., & Johnson, L. (2021) · Med · doi:10.1016/j.medj.2021.03.003 · Cited by 126
Conceptualising long COVID as an episodic health condition
Brown, D. A., & O’Brien, K. K. (2021) · BMJ Global Health · doi:10.1136/bmjgh-2021-007004 · Cited by 116
Impact of COVID-19 on the Endocrine System: A Mini-review
Clarke, S. A., Abbara, A., & Dhillo, W. S. (2021) · Endocrinology · doi:10.1210/endocr/bqab203 · Cited by 116
Sotzny, F., Filgueiras, I. S., Kedor, C., Freitag, H., Wittke, K., Bauer, S., Sepúlveda, N., Fonseca, D. L. M., Baiocchi, G. C., Marques, A. H. C., et al. (2022) · Frontiers in Immunology · doi:10.3389/fimmu.2022.981532 · Cited by 111
Long COVID: a review and proposed visualization of the complexity of long COVID
Perumal, R., Shunmugam, L., Naidoo, K., Karim, S. S. A., Wilkins, D., Demo, A. G., Bréchot, C., Parthasarathy, S., Vahlne, A. G., & Nikolich‐Žugich, J. (2023) · Frontiers in Immunology · doi:10.3389/fimmu.2023.1117464 · Cited by 140
Munipalli, B., Seim, L. A., Dawson, N. L., Knight, D. R. T., & Dabrh, A. M. A. (2022) · SN Comprehensive Clinical Medicine · doi:10.1007/s42399-022-01167-4 · Cited by 118
González-Hermosillo, J. A., Martínez-López, J., Carrillo-Lampón, S. A., Ruiz-Ojeda, D., Herrera-Ramírez, S., Amezcua-Guerra, L. M., & Martínez-Alvarado, M. R. (2021) · Brain Sciences · doi:10.3390/brainsci11060760 · Cited by 116
Long COVID and neuropsychiatric manifestations (Review)
Efstathiou, V., Stefanou, M., Demetriou, M., Siafakas, N., Makris, M. P., Tsivgoulis, G. K., Zoumpourlis, V., Kympouropoulos, S. P., Tsoporis, J. N., Spandidos, D. A., et al. (2022) · Experimental and Therapeutic Medicine · doi:10.3892/etm.2022.11290 · Cited by 118
Adab, P., Haroon, S. M., O’Hara, M. E., & Jordan, R. E. (2022) · BMJ · doi:10.1136/bmj.o1431 · Cited by 107
Molnupiravir and risk of post-acute sequelae of covid-19: cohort study
Xie, Y., Choi, T., & Al‐Aly, Z. (2023) · BMJ · doi:10.1136/bmj-2022-074572 · Cited by 106
Mateu, L., Tebé, C., Loste, C., Santos, J. R., Lladós, G., López, C., España-Cueto, S., Toledo, R., Font, M., Chamorro, A., et al. (2023) · The Lancet Regional Health - Europe · doi:10.1016/j.lanepe.2023.100724 · Cited by 115
Hossain, M. A., Hossain, K. M. A., Saunders, K., Uddin, Z., Walton, L. M., Raigangar, V. L., Sakel, M., Shafin, R., Hossain, M. S., Kabir, M. F., et al. (2021) · BMJ Global Health · doi:10.1136/bmjgh-2021-006838 · Cited by 112
Sivan, M., Preston, N., Parkin, A., Makower, S., Gee, J., Ross, D. H., Tarrant, R., Davison, J., Halpin, S. J., O’Connor, R. J., et al. (2022) · Journal of Medical Virology · doi:10.1002/jmv.27878 · Cited by 104
The immunology of asymptomatic SARS-CoV-2 infection: what are the key questions?
Boyton, R. J., & Altmann, D. M. (2021) · Nature reviews. Immunology · doi:10.1038/s41577-021-00631-x · Cited by 101
Pinzon, R. T., Wijaya, V. O., Jody, A. A., Nunsio, P. N., & Buana, R. B. (2022) · Journal of Infection and Public Health · doi:10.1016/j.jiph.2022.06.013 · Cited by 108
COVID-19 symptoms over time: comparing long-haulers to ME/CFS
Jason, L. A., Islam, M. F., Conroy, K. E., Cotler, J. H., Torres, C., Johnson, M., & Mabie, B. (2021) · Fatigue Biomedicine Health & Behavior · doi:10.1080/21641846.2021.1922140 · Cited by 125
Multi-organ impairment and long COVID: a 1-year prospective, longitudinal cohort study
Dennis, A., Cuthbertson, D. J., Wootton, D. G., Crooks, M. G., Gabbay, M., Eichert, N., Mouchti, S., Pansini, M., Roca‐Fernández, A., Thomaides-Brears, H. B., et al. (2023) · Journal of the Royal Society of Medicine · doi:10.1177/01410768231154703 · Cited by 113
Fernández-Castañeda, A., Lu, P., Geraghty, A. C., Song, E., Lee, M.-H., Wood, J., Yalçın, B., Taylor, K. R., Dutton, S., Acosta-Alvarez, L., et al. (2022) · bioRxiv (Cold Spring Harbor Laboratory) · doi:10.1101/2022.01.07.475453 · Cited by 104
Cognitive impairment in people with previous COVID-19 infection: A scoping review
Bertuccelli, M., Ciringione, L., Rubega, M., Bisiacchi, P. S., Masiero, S., & Felice, A. D. (2022) · Cortex · doi:10.1016/j.cortex.2022.06.002 · Cited by 110
Post-covid medical complaints following infection with SARS-CoV-2 Omicron vs Delta variants
Magnusson, K., Kristoffersen, D. T., Dell’Isola, A., Kiadaliri, A., Turkiewicz, A., Runhaar, J., Bierma‐Zeinstra, S., Englund, M., Magnus, P. M., & Kinge, J. M. (2022) · Nature Communications · doi:10.1038/s41467-022-35240-2 · Cited by 98
Burton, A., Aughterson, H., Fancourt, D., & Philip, K. (2022) · BJPsych Open · doi:10.1192/bjo.2022.38 · Cited by 78
Tosato, M., Calvani, R., Picca, A., Ciciarello, F., Galluzzo, V., Coelho‐Júnior, H. J., Giorgio, A. D., Mario, C. D., Gervasoni, J., Gremese, E., et al. (2022) · Nutrients · doi:10.3390/nu14234984 · Cited by 96
ZHENG, C., Chen, X., Sit, C. H. P., Liang, X., Li, M., Chun‐Hang, A., & Wong, S. H. (2023) · Medicine & Science in Sports & Exercise · doi:10.1249/mss.0000000000003280 · Cited by 100
Legler, F., Meyer‐Arndt, L., Mödl, L., Kedor, C., Freitag, H., Stein, E., Hoppmann, U., Rust, R., Wittke, K., Siebert, N., et al. (2023) · EClinicalMedicine · doi:10.1016/j.eclinm.2023.102146 · Cited by 104
Besnier, F., Bérubé, B., Malo, J., Gagnon, C., Grégoire, C., Juneau, M., Simard, F., L’Allier, P. L., Nigam, A., Iglesies‐Grau, J., et al. (2022) · International Journal of Environmental Research and Public Health · doi:10.3390/ijerph19074133 · Cited by 97
Tran, V.-T., Perrodeau, É., Saldanha, J. S., Pane, I., & Ravaud, P. (2023) · BMJ Medicine · doi:10.1136/bmjmed-2022-000229 · Cited by 95
Impaired health-related quality of life in long-COVID syndrome after mild to moderate COVID-19
Malesevic, S., Sievi, N. A., Baumgartner, P., Roser, K., Sommer, G., Schmidt, D., Vallelian, F., Jelčić, I., Clarenbach, C. F., & Kohler, M. (2023) · Scientific Reports · doi:10.1038/s41598-023-34678-8 · Cited by 99
Sleep disturbance in post COVID-19 conditions: Prevalence and quality of life
Tedjasukmana, R., Budikayanti, A., Islamiyah, W. R., Witjaksono, A. M. A. L., & Hakim, M. (2023) · Frontiers in Neurology · doi:10.3389/fneur.2022.1095606 · Cited by 104
Shabnam, S., Razieh, C., Dambha‐Miller, H., Yates, T. E., Gillies, C., Chudasama, Y., Pareek, M., Banerjee, A., Kawachi, I. I., Lacey, B., et al. (2023) · Journal of the Royal Society of Medicine · doi:10.1177/01410768231168377 · Cited by 91
Taquet, M., Skórniewska, Z., Hampshire, A., Chalmers, J. D., Ho, L., Horsley, A. R., Marks, M., Poinasamy, K., Raman, B., Leavy, O. C., et al. (2023) · Nature Medicine · doi:10.1038/s41591-023-02525-y · Cited by 94
Preparing for the long-haul: Autonomic complications of COVID-19
Larsen, N. W., Stiles, L. E., & Miglis, M. G. (2021) · Autonomic Neuroscience · doi:10.1016/j.autneu.2021.102841 · Cited by 94
Parker, M., Sawant, H. B., Flannery, T., Tarrant, R., Shardha, J., Bannister, R., Ross, D. H., Halpin, S. J., Greenwood, D. C., & Sivan, M. (2022) · Journal of Medical Virology · doi:10.1002/jmv.28373 · Cited by 93
Post COVID-19 condition, work ability and occupational changes in a population-based cohort
Kerksieck, P., Ballouz, T., Haile, S., Schumacher, C., Lacy, J., Domenghino, A., Fehr, J., Bauer, G., Dressel, H., Puhan, M., et al. (2023) · The Lancet Regional Health - Europe · doi:10.1016/j.lanepe.2023.100671 · Cited by 94
Post COVID-19 Condition in South Africa: 3-Month Follow-Up after Hospitalisation with SARS-CoV-2
Dryden, M., Mudara, C., Vika, C., Blumberg, L. H., Mayet, N. T., Cohen, C., Tempia, S., Parker, A., Nel, J. S., Perumal, R., et al. (2022) · The Lancet Global Health · doi:10.1016/s2214-109x(22)00286-8 · Cited by 101
Long-Term Outcomes of Pediatric Infections: From Traditional Infectious Diseases to Long Covid
Buonsenso, D., Gennaro, L. D., Rose, C. D., Morello, R., D’Ilario, F., Zampino, G., Piazza, M., Boner, A. L., Iraci, C., O’Connell, S., et al. (2022) · Future Microbiology · doi:10.2217/fmb-2022-0031 · Cited by 97
Support amid uncertainty: Long COVID illness experiences and the role of online communities
Russell, D., Spence, N. J., Chase, J. D., Schwartz, T., Tumminello, C. M., & Bouldin, E. D. (2022) · SSM - Qualitative Research in Health · doi:10.1016/j.ssmqr.2022.100177 · Cited by 93
Cheetham, N. J., Penfold, R., Giunchiglia, V., Bowyer, V., Sudre, C. H., Canas, L. S., Deng, J., Murray, B. A. K., Kerfoot, E., Antonelli, M., et al. (2023) · EClinicalMedicine · doi:10.1016/j.eclinm.2023.102086 · Cited by 95
Clinical trials on the pharmacological treatment of long COVID: A systematic review
Chee, Y. J., Fan, B. E., Young, B. E., Dalan, R., & Lye, D. C. (2022) · Journal of Medical Virology · doi:10.1002/jmv.28289 · Cited by 92
Zisis, S. N., Durieux, J. C., Mouchati, C., Perez, J. A., & McComsey, G. A. (2022) · Open Forum Infectious Diseases · doi:10.1093/ofid/ofac228 · Cited by 85
Dementia wellbeing and COVID-19: review and expert consensus on current research and knowledge gaps
Liu, K. Y., Howard, R., Banerjee, S., Comas‐Herrera, A., Goddard, J., Knapp, M., Livingston, G., Manthorpe, J., O'Brien, J. T., Paterson, R. W., et al. (2021) · International Journal of Geriatric Psychiatry · doi:10.1002/gps.5567 · Cited by 87
Clinical Characteristics and Mechanisms of Musculoskeletal Pain in Long COVID
Khoja, O., Silva-Passadouro, B., Mulvey, M. R., Delis, I., Astill, S. L., Tan, A. L., & Sivan, M. (2022) · Journal of Pain Research · doi:10.2147/jpr.s365026 · Cited by 87
Fahriani, M., Ilmawan, M., Fajar, J. K., Maliga, H. A., Frediansyah, A., Masyeni, S., Yusuf, H., Nainu, F., Rosiello, F., Sirinam, S., et al. (2021) · Narra J · doi:10.52225/narraj.v1i2.36 · Cited by 83
Zhao, Y., Shi, L., Jiang, Z., Zeng, N., Mei, H., Lu, Y., Yang, J., Jin, F., Ni, S., Wu, S., et al. (2023) · Molecular Psychiatry · doi:10.1038/s41380-023-01951-1 · Cited by 90
Effects of COVID-19 on cognition and brain health
Zhao, S., Toniolo, S., Hampshire, A., & Husain, M. (2023) · Trends in Cognitive Sciences · doi:10.1016/j.tics.2023.08.008 · Cited by 90
Hawkins, J., Hires, C., Keenan, L., & Dunne, E. (2022) · Complementary Therapies in Medicine · doi:10.1016/j.ctim.2022.102823 · Cited by 92
Ariza, M., Cano, N., Segura, B., Adán, A., Bargalló, N., Caldú, X., Campabadal, A., Jurado, M. Á., Mataró, M., Pueyo, R., et al. (2022) · Frontiers in Aging Neuroscience · doi:10.3389/fnagi.2022.1029842 · Cited by 83
Blitshteyn, S., Whiteson, J. H., Abramoff, B. A., Azola, A. M., Bartels, M. N., Bhavaraju-Sanka, R. K., Chung, T., Fleming, T. K., Henning, E., Miglis, M. G., et al. (2022) · PM&R · doi:10.1002/pmrj.12894 · Cited by 79
Lived experience of patients with Long COVID: a qualitative study in the UK
Thomas, C., Faghy, M. A., Owen, R., Yates, J., Ferraro, F., Bewick, T., Haggan, K., & Ashton, R. E. M. (2023) · BMJ Open · doi:10.1136/bmjopen-2022-068481 · Cited by 84
Szewczykowski, C., Mardin, C. Y., Lucio, M., Wallukat, G., Hoffmanns, J., Schröder, T., Raith, F., Rogge, L., Heltmann, F., Moritz, M., et al. (2022) · International Journal of Molecular Sciences · doi:10.3390/ijms23137209 · Cited by 84
Persisting symptoms after COVID-19
Förster, C., Colombo, M. G., Wetzel, A.-J., Martus, P., & Joos, S. (2022) · Deutsches Ärzteblatt international · doi:10.3238/arztebl.m2022.0147 · Cited by 86
Wong, M. C. S., Huang, J., Wong, Y. Y., Wong, G. L., Yip, T. C., Chan, N. Y., Chau, S. W. H., Ng, S. C., Wing, Y. K., & Chan, F. K. L. (2023) · JMIR Public Health and Surveillance · doi:10.2196/42315 · Cited by 84
Long COVID: Costs for the German economy and health care and pension system
Gandjour, A. (2023) · BMC Health Services Research · doi:10.1186/s12913-023-09601-6 · Cited by 79
Post COVID-19 Condition in Children and Adolescents: An Emerging Problem
Izquierdo-Pujol, J., Morón‐López, S., Dalmau, J., González-Aumatell, A., Carreras‐Abad, C., Hernández, M. J. M., Rodrigo, C., & Martínez‐Picado, J. (2022) · Frontiers in Pediatrics · doi:10.3389/fped.2022.894204 · Cited by 87
Respiratory rehabilitation for Covid-19 related persistent dyspnoea: A one-year experience
Bouteleux, B., Henrot, P., Ernst, R., Grassion, L., Rahérison, C., Beaufils, F., Zysman, M., & Delorme, M. (2021) · Respiratory Medicine · doi:10.1016/j.rmed.2021.106648 · Cited by 79
Vernon, S. D., Hartle, M., Sullivan, K. A., Bell, J., Abbaszadeh, S., Unutmaz, D., & Bateman, L. (2023) · Work · doi:10.3233/wor-220581 · Cited by 76
van Campen, C. M. C., Rowe, P. C., & Visser, F. C. (2021) · Medicina · doi:10.3390/medicina58010028 · Cited by 72
Impact of Long COVID on health and quality of life
O’Mahony, L., Buwalda, T., Blair, M., Forde, B. M., Lunjani, N., Ambikan, A. T., Neogi, U., Barrett, P., Geary, E., O'Connor, N., et al. (2022) · HRB Open Research · doi:10.12688/hrbopenres.13516.1 · Cited by 76
Chasco, E. E., Dukes, K., Jones, D., Comellas, A. P., Hoffman, R. M., & Garg, A. (2022) · International Journal of Environmental Research and Public Health · doi:10.3390/ijerph192315499 · Cited by 76
The knowns and unknowns of long COVID-19: from mechanisms to therapeutical approaches
Gheorghita, R. E., Șoldănescu, I., Lobiuc, A., Căliman-Sturdza, O. A., Filip, R., Constantinescu‐Bercu, A., Dimian, M., Mangul, S., & Covașă, M. (2024) · Frontiers in Immunology · doi:10.3389/fimmu.2024.1344086 · Cited by 86
Lemhöfer, C., Sturm, C., Loudovici-Krug, D., Best, N., & Gutenbrunner, C. M. (2021) · Journal of Occupational Medicine and Toxicology · doi:10.1186/s12995-021-00337-9 · Cited by 79
Guo, P., Benito-Ballesteros, Á., Yeung, S. P., Liu, R., Saha, A., Curtis, L., Kaşer, M., Haggard, M. P., & Cheke, L. G. (2022) · Frontiers in Aging Neuroscience · doi:10.3389/fnagi.2022.804922 · Cited by 86
Scoping review of rehabilitation care models for post COVID-19 condition
Décary, S., GROOTE, W. D., Arienti, C., Kiekens, C., Boldrini, P., Lazzarini, S. G., Dugas, M., Stefan, T., Langlois, L., Daigle, F., et al. (2022) · Bulletin of the World Health Organization · doi:10.2471/blt.22.288105 · Cited by 72
Metadata
- Authors
- Davis, H. E., Assaf, G. S., McCorkell, L., Wei, H., Low, R. J., Re'em, Y., Redfield, S., Austin, J. P., & Akrami, A.
- Affiliations
- Patient-Led Research Collaborative (US)
- Oregon Health & Science University (US)
- Corresponding author
- Akrami, Athena
- ORCID
- Venue
- eClinicalMedicine
- Publisher
- Elsevier BV
- Published
- 2021-08
- Volume
- 38
- Pages
- 101019
- ISSN
- 2589-5370 (ISSN-L)
- PMC
- PMC8280690
- OpenAlex
- W3184339862
- Cited by
- 2,881
- References
- 46
- Citations by year
- 2026: 299 · 2025: 492 · 2024: 594 · 2023: 692 · 2022: 617 · 2021: 186
- FWCI
- 249.99
- Type
- journal article
- Language
- en
- Open access
- gold
- doi.org
- Licence
- Locations
- EClinicalMedicine (publishedVersion, cc-by)
- PubMed Central (publishedVersion, cc-by)
- PubMed (publishedVersion)
- DOAJ (DOAJ: Directory of Open Access Journals) (submittedVersion, cc-by-sa)
- Funders
- Wellcome Trust
- Topics
- Health Sciences › Medicine › Clinical Neurology › Long-Term Effects of COVID-19
- Health Sciences › Medicine › Infectious Diseases › COVID-19 Clinical Research Studies
- Social Sciences › Psychology › Clinical Psychology › COVID-19 and Mental Health
- Keywords
- long COVID, symptom clusters, fatigue, post-exertional malaise, cognitive impairment, symptom recurrence, work disability, loss of taste and smell, outpatients
About these checks
Registry, retraction, Cites and statistics results are computed, not judged, with one exception: a printed reference that no index lists is read once by a model before it counts as a citation error. Claims are extracted by a model and kept only when their quote appears verbatim in the text; each cited source is then checked, with a model’s help, for whether it says what the claim relies on. Those verdicts can be wrong — read the claim’s quote and the cited source before relying on one.
Statistics and arithmetic are recomputed, not judged.
Confidence bands are shown only for fields calibrated on our annotated test set. None is calibrated yet, so no band is shown.
What counts as a claim ›How we measure confidence ›How we check this ›
Are you an author, or do you see a problem with this page? Request a review
