

The DOI matches its Crossref record; 46 of the 47 references it cites were found in a registry or an index, and 1 are not checked yet; none of the 55 sources its claims cite is checked for support yet.
Widespread reductions in gray matter volume in depression
Open accessAbstract
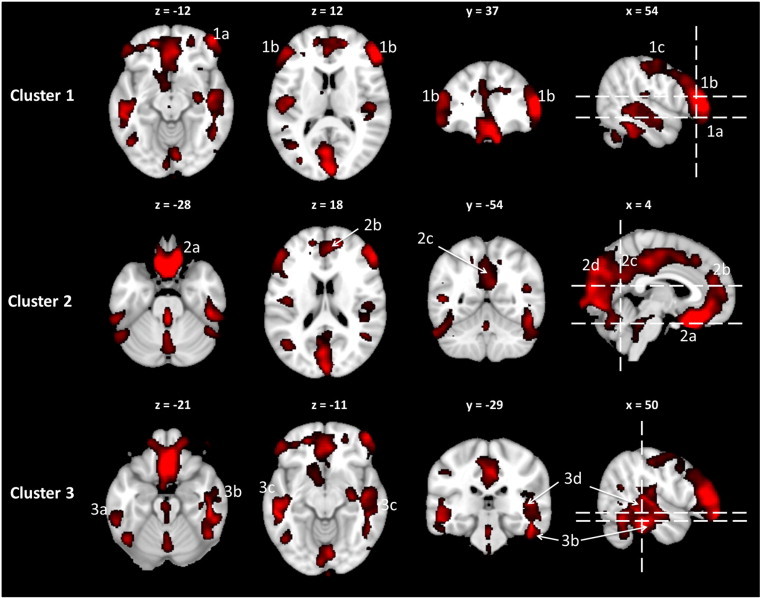
Abnormalities in functional limbic-anterior cingulate-prefrontal circuits associated with emotional reactivity, evaluation and regulation have been implicated in the pathophysiology of major depressive disorder (MDD). However, existing knowledge about structural alterations in depression is equivocal and based on cohorts of limited sample size. This study used voxel-based morphometry (VBM) and surface-based cortical thickness to investigate the structure of these circuits in a large and well-characterized patient cohort with MDD. Non-geriatric MDD outpatients (n = 102) and age- and gender-matched healthy control participants (n = 34) provided T1-weighted magnetic resonance imaging data during their baseline visit as part of the International Study to Predict Optimized Treatment for Depression. Whole-brain VBM volumetric and surface-based cortical thickness assessments were performed voxel-wise and compared (at p < 0.05 corrected for multiple comparisons) between the MDD and control groups. MDD participants had reduced gray matter volume in the anterior cingulate cortex, regions of the prefrontal circuits, including dorsolateral and dorsomedial prefrontal cortices, and lateral and medial orbitofrontal cortices, but not in limbic regions. Additional reductions were observed cortically in the posterior temporal and parieto-occipital cortices and, subcortically in the basal ganglia and cerebellum. Focal cortical thinning in the medial orbitofrontal cortex was also observed for the MDD group. These alterations in volume and cortical thickness were not associated with severity of depressive symptoms. The findings demonstrate that widespread gray matter structural abnormalities are present in a well-powered study of patients with depression. The patterns of gray matter loss correspond to the same brain functional network regions that were previously established to be abnormal in MDD, which may support an underlying structural abnormality for these circuits.
Checked 2026-10-09 · 1 reference not checked yet
Overview
AI snapshot
Written from the paper’s full text.
TL;DR
In a large non-geriatric cohort from iSPOT-D, major depressive disorder was associated with widespread gray matter volume reductions across prefrontal, cingulate, orbitofrontal, temporal, occipital, basal ganglia, and cerebellar regions, but not limbic regions. These structural differences were not correlated with depressive symptom severity.
Key findings
- MDD participants (n = 102) had 4.4% less global gray matter volume than healthy controls (n = 34; p < 0.05), with greatest lobar reductions in frontal (5.4%) and temporal (4.8%) lobes; the global difference corresponded to a CVNA of 14 years.
- Voxel-based morphometry showed reduced gray matter volume in the DLPFC (BA 46 maxima: 24% left, 27% right), ACC (8–11%), medial OFC (8–10%), gyrus rectus (26%), lateral OFC (19%), dorsomedial PFC (11% bilaterally), posterior temporal lobe (10–13%), occipital cortex (8–14%), cerebellum posterior crus I (23%), and left thalamus/putamen/caudate (9%, 7%, 8%).
- No significant hippocampal or amygdala gray matter volume loss was found; cortical thickness analysis showed only a discrete left medial OFC thinning (16% decrease; p = 0.003) and a very small left lateral OFC thickening (16% increase; 8 vertices; FDR-corrected p < 0.001).
- No clusters showed significant correlations between depressive severity (HRSD17) and VBM volume or cortical thickness in the MDD group.
Methods
- Cross-sectional baseline MRI data from the iSPOT-D study at Westmead Hospital: 102 non-geriatric MDD outpatients (aged 18–65, HRSD17 ≥ 16, DSM-IV single/recurrent nonpsychotic MDD) and 34 age- and gender-matched healthy controls.
- T1-weighted images acquired on a 3.0 T GE Signa HDx scanner using a 3D SPGR sequence (TR = 8.3 ms; TE = 3.2 ms; flip angle = 11°; TI = 500 ms; 180 contiguous 1 mm slices; 256 × 256 matrix; 1 mm isotropic voxels).
- Whole-brain VBM used VBM8/SPM8 with DARTEL normalization, modulation, and 8 mm smoothing; cortical thickness and subcortical segmentation used FreeSurfer 4.3; independent-sample t-tests compared groups voxel-wise/vertex-wise at p < 0.05 FDR-corrected, with 5 mm sphere ROIs used to calculate percent differences and CVNA from prior normal-aging data in 476 individuals.
Limitations
- The paper states that cross-sectional data cannot clarify whether gray matter changes precede depression or occur secondary to the depressive state, and that prospective studies are needed.
- The paper notes that whole-brain cortical thickness analysis may have limited sensitivity, that the significance of the focal increased left lateral OFC thickness is unclear, and that the lack of hippocampal changes may reflect the relatively young, non-geriatric cohort with average depression duration of 11 years.
- Evident from the text: the control group (n = 34) was much smaller than the MDD group (n = 102), and the study was single-site, which may affect generalizability and power despite age/gender matching.
Model-written summary. Check it against the paper before relying on it.
Integrity signals
Registry
Cites
Statistics
Figures
Verification
Claims the paper makes
34 Own result · 28 Not checked yet · 14 Sources not found · 11 Own method · 11 Own interpretation · 4 No basis given
A result the paper reports from its own data — it cites no other source for it, so there is none to check. The quote shows it is in the paper.
In the paper
“Focal cortical thinning in the medial orbitofrontal cortex was also observed for the MDD group.”
§ Widespread reductions in gray matter volume in depression☆ > Abstract
plain- Asserted: passes — The authors put it forward as true.
- Checkable: passes — It can be checked against evidence.
- Load-bearing: unclear — It is unclear whether the paper’s conclusions depend on it.
- Based: passes — The paper gives a reason why it holds.
A result the paper reports from its own data — it cites no other source for it, so there is none to check. The quote shows it is in the paper.
In the paper
“the DLPFC (BA 45, 46) with extension inferiorly to the lateral OFC (BA 47) and superiorly to involve the pre/post central gyri”
§ Widespread reductions in gray matter volume in depression☆ > Results > Whole-brain voxel-level GM volume analysis
plain- Asserted: passes — The authors put it forward as true.
- Checkable: passes — It can be checked against evidence.
- Load-bearing: passes — The paper’s conclusions depend on it.
- Based: passes — The paper gives a reason why it holds.
A result the paper reports from its own data — it cites no other source for it, so there is none to check. The quote shows it is in the paper.
In the paper
“These alterations in volume and cortical thickness were not associated with severity of depressive symptoms.”
§ Widespread reductions in gray matter volume in depression☆ > Abstract
plain- Asserted: passes — The authors put it forward as true.
- Checkable: passes — It can be checked against evidence.
- Load-bearing: unclear — It is unclear whether the paper’s conclusions depend on it.
- Based: passes — The paper gives a reason why it holds.
In the paper
“The volume decreases in the medial temporal lobe correspond to an average regional volumetric difference of 10–13% (CVNA: 21–48 years).”
§ Widespread reductions in gray matter volume in depression☆ > Results > Whole-brain voxel-level GM volume analysis
What the sources say
- Not matchedcites Grieve et al., 2005, 2011
Couldn’t be matched to a paper in Crossref, so it can’t be checked.
plaincorrelational- Asserted: passes — The authors put it forward as true.
- Checkable: passes — It can be checked against evidence.
- Load-bearing: unclear — It is unclear whether the paper’s conclusions depend on it.
- Based: passes — The paper gives a reason why it holds.
- Not matched
In the paper
“The global GM difference between depressed participants and controls equated to a CVNA of 14 years.”
§ Widespread reductions in gray matter volume in depression☆ > Results > Global and lobar GM volume measurements
What the sources say
- Not matchedcites Grieve et al., 2005, 2011
Couldn’t be matched to a paper in Crossref, so it can’t be checked.
plaincorrelational- Asserted: passes — The authors put it forward as true.
- Checkable: passes — It can be checked against evidence.
- Load-bearing: unclear — It is unclear whether the paper’s conclusions depend on it.
- Based: passes — The paper gives a reason why it holds.
- Not matched
A result the paper reports from its own data — it cites no other source for it, so there is none to check. The quote shows it is in the paper.
In the paper
“a large midline region spanning the medial orbitofrontal cortex/posterior gyrus rectus, entire cingulate cortex and the calcarine/lingual gyri”
§ Widespread reductions in gray matter volume in depression☆ > Results > Whole-brain voxel-level GM volume analysis
plain- Asserted: passes — The authors put it forward as true.
- Checkable: passes — It can be checked against evidence.
- Load-bearing: passes — The paper’s conclusions depend on it.
- Based: passes — The paper gives a reason why it holds.
A result the paper reports from its own data — it cites no other source for it, so there is none to check. The quote shows it is in the paper.
In the paper
“Compared to healthy controls, MDD participants had 4.4% less global GM volume than did healthy controls (p < 0.05).”
§ Widespread reductions in gray matter volume in depression☆ > Results > Global and lobar GM volume measurements
plain- Asserted: passes — The authors put it forward as true.
- Checkable: passes — It can be checked against evidence.
- Load-bearing: passes — The paper’s conclusions depend on it.
- Based: passes — The paper gives a reason why it holds.
- Rests on an assumption: The cross-sectional gray matter differences between MDD and control participants reflect depression-related structural abnormalities rather than pre-existing or other confounding factors.
A result the paper reports from its own data — it cites no other source for it, so there is none to check. The quote shows it is in the paper.
In the paper
“Cerebellar volume differences between the two groups were not significant.”
§ Widespread reductions in gray matter volume in depression☆ > Results > Global and lobar GM volume measurements
plain- Asserted: passes — The authors put it forward as true.
- Checkable: passes — It can be checked against evidence.
- Load-bearing: unclear — It is unclear whether the paper’s conclusions depend on it.
- Based: passes — The paper gives a reason why it holds.
A result the paper reports from its own data — it cites no other source for it, so there is none to check. The quote shows it is in the paper.
In the paper
“As expected, the MDD group had greater depressive severity (HRSD17) compared to healthy participants.”
§ Widespread reductions in gray matter volume in depression☆ > Results > Participant characteristics
plain- Asserted: passes — The authors put it forward as true.
- Checkable: passes — It can be checked against evidence.
- Load-bearing: unclear — It is unclear whether the paper’s conclusions depend on it.
- Based: passes — The paper gives a reason why it holds.
In the paper
“A GM difference of 11% on the left (CVNA: 37 years) and 11% on the right (CVNA: > 50 years) was found for these clusters.”
§ Widespread reductions in gray matter volume in depression☆ > Results > Whole-brain voxel-level GM volume analysis
What the sources say
- Not matchedcites Grieve et al., 2005, 2011
Couldn’t be matched to a paper in Crossref, so it can’t be checked.
plaincorrelational- Asserted: passes — The authors put it forward as true.
- Checkable: passes — It can be checked against evidence.
- Load-bearing: unclear — It is unclear whether the paper’s conclusions depend on it.
- Based: passes — The paper gives a reason why it holds.
- Not matched
- It may state two separate claims as one. 40
- The quote only partly states this claim. 1
- Probably not a substantial claim. 28
In the paper
“The maximal ACC volume differences were symmetric and corresponded to approximately CVNA: 26 years.”
§ Widespread reductions in gray matter volume in depression☆ > Results > Whole-brain voxel-level GM volume analysis
What the sources say
- Not matchedcites Grieve et al., 2005, 2011
Couldn’t be matched to a paper in Crossref, so it can’t be checked.
plaincorrelational- Asserted: passes — The authors put it forward as true.
- Checkable: passes — It can be checked against evidence.
- Load-bearing: unclear — It is unclear whether the paper’s conclusions depend on it.
- Based: passes — The paper gives a reason why it holds.
It may state two separate claims as one.
- Not matched
In the paper
“The GM difference centered at the maxima in BA 46 corresponded to a 24% volume difference on the left (CVNA: 32 years) and a 27% volume difference on the right (CVNA: 31 years).”
§ Widespread reductions in gray matter volume in depression☆ > Results > Whole-brain voxel-level GM volume analysis
What the sources say
- Not matchedcites Grieve et al., 2005, 2011
Couldn’t be matched to a paper in Crossref, so it can’t be checked.
plaincorrelational- Asserted: passes — The authors put it forward as true.
- Checkable: passes — It can be checked against evidence.
- Load-bearing: passes — The paper’s conclusions depend on it.
- Based: passes — The paper gives a reason why it holds.
It may state two separate claims as one.
- Not matched
A result the paper reports from its own data — it cites no other source for it, so there is none to check. The quote shows it is in the paper.
In the paper
“The anterior cingulate cortex (ACC) component of cluster 2 was maximal in the caudal ACC (11%) but involved the whole of the ACC quite homogenously (global ACC ranged from 8 to 11%).”
§ Widespread reductions in gray matter volume in depression☆ > Results > Whole-brain voxel-level GM volume analysis
plain- Asserted: passes — The authors put it forward as true.
- Checkable: passes — It can be checked against evidence.
- Load-bearing: unclear — It is unclear whether the paper’s conclusions depend on it.
- Based: passes — The paper gives a reason why it holds.
It may state two separate claims as one.
A result the paper reports from its own data — it cites no other source for it, so there is none to check. The quote shows it is in the paper.
In the paper
“These volumetric differences were greatest in the frontal and temporal lobes (5.4% and 4.8%, respectively), with significant differences also present in the parietal and occipital lobes.”
§ Widespread reductions in gray matter volume in depression☆ > Results > Global and lobar GM volume measurements
plaincorrelational- Asserted: passes — The authors put it forward as true.
- Checkable: passes — It can be checked against evidence.
- Load-bearing: passes — The paper’s conclusions depend on it.
- Based: passes — The paper gives a reason why it holds.
It may state two separate claims as one.
A result the paper reports from its own data — it cites no other source for it, so there is none to check. The quote shows it is in the paper.
In the paper
“Additional reductions were observed cortically in the posterior temporal and parieto-occipital cortices and, subcortically in the basal ganglia and cerebellum.”
§ Widespread reductions in gray matter volume in depression☆ > Abstract
plaincorrelational- Asserted: passes — The authors put it forward as true.
- Checkable: passes — It can be checked against evidence.
- Load-bearing: passes — The paper’s conclusions depend on it.
- Based: passes — The paper gives a reason why it holds.
It may state two separate claims as one.
A result the paper reports from its own data — it cites no other source for it, so there is none to check. The quote shows it is in the paper.
In the paper
“The VBM analysis showed large areas of decreased GM volume in MDD distributed across the brain, with no regions of increased GM volume.”
§ Widespread reductions in gray matter volume in depression☆ > Results > Whole-brain voxel-level GM volume analysis
plain- Asserted: passes — The authors put it forward as true.
- Checkable: passes — It can be checked against evidence.
- Load-bearing: passes — The paper’s conclusions depend on it.
- Based: passes — The paper gives a reason why it holds.
It may state two separate claims as one.
In the paper
“The GM volume decrease involved the entire mid- and posterior cingulate cortices. The volume differences were quite homogenous and similar in magnitude to that seen in the ACC, ranging from 8 to 11% (CVNA: 32–42 years). The changes were anatomically symmetric.”
§ Widespread reductions in gray matter volume in depression☆ > Results > Whole-brain voxel-level GM volume analysis
What the sources say
- Not matchedcites Grieve et al., 2005, 2011
Couldn’t be matched to a paper in Crossref, so it can’t be checked.
plaincorrelational- Asserted: passes — The authors put it forward as true.
- Checkable: passes — It can be checked against evidence.
- Load-bearing: passes — The paper’s conclusions depend on it.
- Based: passes — The paper gives a reason why it holds.
It may state two separate claims as one.
- Not matched
A result the paper reports from its own data — it cites no other source for it, so there is none to check. The quote shows it is in the paper.
In the paper
“MDD participants had reduced gray matter volume in the anterior cingulate cortex, regions of the prefrontal circuits, including dorsolateral and dorsomedial prefrontal cortices, and lateral and medial orbitofrontal cortices, but not in limbic regions.”
§ Widespread reductions in gray matter volume in depression☆ > Abstract
plain- Asserted: passes — The authors put it forward as true.
- Checkable: passes — It can be checked against evidence.
- Load-bearing: passes — The paper’s conclusions depend on it.
- Based: passes — The paper gives a reason why it holds.
It may state two separate claims as one.
In the paper
“The lobar GM volume differences equated to CVNA values of 12 years (frontal), 10 years (parietal), 15 years (temporal) and 14 years (occipital).”
§ Widespread reductions in gray matter volume in depression☆ > Results > Global and lobar GM volume measurements
What the sources say
- Not matchedcites Grieve et al., 2005, 2011
Couldn’t be matched to a paper in Crossref, so it can’t be checked.
plaincorrelational- Asserted: passes — The authors put it forward as true.
- Checkable: passes — It can be checked against evidence.
- Load-bearing: unclear — It is unclear whether the paper’s conclusions depend on it.
- Based: passes — The paper gives a reason why it holds.
It may state two separate claims as one.
- Not matched
In the paper
“The decreased GM volume in this cluster corresponded to a difference of approximately 8–10% (CVNA: 23–25 years). The changes were anatomically symmetric.”
§ Widespread reductions in gray matter volume in depression☆ > Results > Whole-brain voxel-level GM volume analysis
What the sources say
- Not matchedcites Grieve et al., 2005, 2011
Couldn’t be matched to a paper in Crossref, so it can’t be checked.
plaincorrelational- Asserted: passes — The authors put it forward as true.
- Checkable: passes — It can be checked against evidence.
- Load-bearing: unclear — It is unclear whether the paper’s conclusions depend on it.
- Based: passes — The paper gives a reason why it holds.
It may state two separate claims as one.
- Not matched
In the paper
“The gyrus rectus GM differences (26%) were profound but restricted to the posterior portion (CVNA: > 50 years).”
§ Widespread reductions in gray matter volume in depression☆ > Results > Whole-brain voxel-level GM volume analysis
What the sources say
- Not matchedcites Grieve et al., 2005, 2011
Couldn’t be matched to a paper in Crossref, so it can’t be checked.
plain- Asserted: passes — The authors put it forward as true.
- Checkable: passes — It can be checked against evidence.
- Load-bearing: unclear — It is unclear whether the paper’s conclusions depend on it.
- Based: passes — The paper gives a reason why it holds.
It may state two separate claims as one.
- Not matched
A result the paper reports from its own data — it cites no other source for it, so there is none to check. The quote shows it is in the paper.
In the paper
“a broad region in the posterior temporal lobe spanning the inferior/middle/superior temporal gyri”
§ Widespread reductions in gray matter volume in depression☆ > Results > Whole-brain voxel-level GM volume analysis
plain- Asserted: passes — The authors put it forward as true.
- Checkable: passes — It can be checked against evidence.
- Load-bearing: unclear — It is unclear whether the paper’s conclusions depend on it.
- Based: passes — The paper gives a reason why it holds.
The quote only partly states this claim.
In the paper
“For the lateral OFC, the peak cluster was located in the middle frontal gyrus (GM difference of 19%, CVNA: 24 years).”
§ Widespread reductions in gray matter volume in depression☆ > Results > Whole-brain voxel-level GM volume analysis
What the sources say
- Not matchedcites Grieve et al., 2005, 2011
Couldn’t be matched to a paper in Crossref, so it can’t be checked.
plain- Asserted: passes — The authors put it forward as true.
- Checkable: passes — It can be checked against evidence.
- Load-bearing: unclear — It is unclear whether the paper’s conclusions depend on it.
- Based: passes — The paper gives a reason why it holds.
It may state two separate claims as one.
- Not matched
A result the paper reports from its own data — it cites no other source for it, so there is none to check. The quote shows it is in the paper.
In the paper
“Our cortical thickness data confirmed the GM changes present in the medial OFC, but did not detect cortical thinning elsewhere.”
§ Widespread reductions in gray matter volume in depression☆ > Discussion
plain- Asserted: passes — The authors put it forward as true.
- Checkable: passes — It can be checked against evidence.
- Load-bearing: passes — The paper’s conclusions depend on it.
- Based: passes — The paper gives a reason why it holds.
It may state two separate claims as one.
In the paper
“Scattered GM volume differences were present in the cerebellum; the largest of these were located bilaterally in the posterior crus I region (23%; CVNA: > 50 years).”
§ Widespread reductions in gray matter volume in depression☆ > Results > Whole-brain voxel-level GM volume analysis
What the sources say
- Not matchedcites Grieve et al., 2005, 2011
Couldn’t be matched to a paper in Crossref, so it can’t be checked.
plaincorrelational- Asserted: passes — The authors put it forward as true.
- Checkable: passes — It can be checked against evidence.
- Load-bearing: unclear — It is unclear whether the paper’s conclusions depend on it.
- Based: passes — The paper gives a reason why it holds.
It may state two separate claims as one.
- Not matched
A result the paper reports from its own data — it cites no other source for it, so there is none to check. The quote shows it is in the paper.
In the paper
“In addition to these “usual suspects”, we identified a generalized midline GM volume loss that correlates anatomically with the midline resting state default mode network regions which have been implicated in depression, as well as strong GM loss in the medial temporal lobe, cerebellum and pre/post central gyrus.”
§ Widespread reductions in gray matter volume in depression☆ > Discussion
boostedcorrelational- Asserted: passes — The authors put it forward as true.
- Checkable: passes — It can be checked against evidence.
- Load-bearing: passes — The paper’s conclusions depend on it.
- Based: passes — The paper gives a reason why it holds.
It may state two separate claims as one.
A result the paper reports from its own data — it cites no other source for it, so there is none to check. The quote shows it is in the paper.
In the paper
“Additional regions of the brain were also found to have significant GM loss with MDD, including the medial temporal lobe (13%), the gyrus rectus (26%) and the occipital lobe (8–14%).”
§ Widespread reductions in gray matter volume in depression☆ > Discussion
plaincorrelational- Asserted: passes — The authors put it forward as true.
- Checkable: passes — It can be checked against evidence.
- Load-bearing: passes — The paper’s conclusions depend on it.
- Based: passes — The paper gives a reason why it holds.
It may state two separate claims as one.
A result the paper reports from its own data — it cites no other source for it, so there is none to check. The quote shows it is in the paper.
In the paper
“One of the most striking findings in our study was that no significant hippocampal or amygdala GM volume loss was present with MDD.”
§ Widespread reductions in gray matter volume in depression☆ > Discussion
plain- Asserted: passes — The authors put it forward as true.
- Checkable: passes — It can be checked against evidence.
- Load-bearing: passes — The paper’s conclusions depend on it.
- Based: passes — The paper gives a reason why it holds.
It may state two separate claims as one.
A result the paper reports from its own data — it cites no other source for it, so there is none to check. The quote shows it is in the paper.
In the paper
“Regional GM differences were present in the DLPFC (27%), ACC (11%) and the medial orbital frontal cortex (10%), all regions that have an established role in the pathophysiology of MDD.”
§ Widespread reductions in gray matter volume in depression☆ > Discussion
plaincorrelational- Asserted: passes — The authors put it forward as true.
- Checkable: passes — It can be checked against evidence.
- Load-bearing: passes — The paper’s conclusions depend on it.
- Based: passes — The paper gives a reason why it holds.
It may state two separate claims as one.
A result the paper reports from its own data — it cites no other source for it, so there is none to check. The quote shows it is in the paper.
In the paper
“Interestingly, when the contrast MDD > controls was tested, MDD participants were found to have a focal region of left lateral OFC with increased cortical thickness compared to controls; however, the cluster size for this finding was very small at 8 vertices (16% increase; FDR-corrected p-value < 0.001).”
- Also stated in: § Discussion · hedged
“In contrast to the GM findings, we found a very focal region of increased thickness in the left lateral OFC; however the significance of this finding is unclear.”
§ Widespread reductions in gray matter volume in depression☆ > Results > Whole brain cortical thickness analysis
plaincorrelational- Asserted: passes — The authors put it forward as true.
- Checkable: passes — It can be checked against evidence.
- Load-bearing: unclear — It is unclear whether the paper’s conclusions depend on it.
- Based: passes — The paper gives a reason why it holds.
It may state two separate claims as one.
- Also stated in: § Discussion · hedged
In the paper
“Although, we observe strong abnormal fMRI measures affecting the amygdala in the current cohort, the associated GM volume changes in the amygdala were weak (Grieve et al., 2013) and may not be as robust to observe for assessments made at the whole brain level.”
§ Widespread reductions in gray matter volume in depression☆ > Discussion
What the sources say
- Not checked yetcites Grieve et al., 2013 source
hedgedcorrelational- Asserted: passes — The authors put it forward as true.
- Checkable: passes — It can be checked against evidence.
- Load-bearing: unclear — It is unclear whether the paper’s conclusions depend on it.
- Based: passes — The paper gives a reason why it holds.
It may state two separate claims as one.
In the paper
“Focal regions of GM volume difference were also present in the left anterior thalamus, left putamen and left caudate (GM volume decrease: 9%, 7% and 8%, respectively; CVNA 13–15 years).”
§ Widespread reductions in gray matter volume in depression☆ > Results > Whole-brain voxel-level GM volume analysis
What the sources say
- Not matchedcites Grieve et al., 2005, 2011
Couldn’t be matched to a paper in Crossref, so it can’t be checked.
plaincorrelational- Asserted: passes — The authors put it forward as true.
- Checkable: passes — It can be checked against evidence.
- Load-bearing: unclear — It is unclear whether the paper’s conclusions depend on it.
- Based: passes — The paper gives a reason why it holds.
It may state two separate claims as one.
- Not matched
In the paper
“These data have informed prevailing theories of the mechanisms of MDD, which highlight an imbalance between an overactive salience network (involving in the putamen, amygdala, and anterior cingulate) and decreased responsiveness in regions involved in contextual processing (dorsal striatum and dorsolateral prefrontal cortex — DLPFC) (Hamilton et al., 2012).”
§ Widespread reductions in gray matter volume in depression☆ > Introduction
What the sources say
- Not checked yetcites Hamilton et al., 2012 source
plaincorrelational- Asserted: passes — The authors put it forward as true.
- Checkable: passes — It can be checked against evidence.
- Load-bearing: fails — The paper’s conclusions may not depend on it.
- Based: passes — The paper gives a reason why it holds.
Probably not a substantial claim. The paper’s conclusions may not depend on it.
A conclusion the paper draws from its own results — it cites no other source for it, so there is none to check. The quote shows it is in the paper.
In the paper
“A further factor that likely contributes to the variability in the nature of the structural literature relating to MDD is the heterogeneity of the condition itself.”
§ Widespread reductions in gray matter volume in depression☆ > Introduction
hedgedconditional- Asserted: passes — The authors put it forward as true.
- Checkable: fails — It may be too vague to check against evidence.
- Load-bearing: fails — The paper’s conclusions may not depend on it.
- Based: fails — The paper may give no reason why it holds.
Probably not a substantial claim. It may be too vague to check against evidence. The paper’s conclusions may not depend on it. The paper may give no reason why it holds.
The paper states this without a source or data behind it here, so there is nothing to check it against. The quote shows it is in the paper.
In the paper
“Considered overall, the data that supports these changes is limited due to the small number of participants in most studies, the large amount of variation in the regions identified and the enormous variation in methodology.”
§ Widespread reductions in gray matter volume in depression☆ > Introduction
plain- Asserted: passes — The authors put it forward as true.
- Checkable: passes — It can be checked against evidence.
- Load-bearing: passes — The paper’s conclusions depend on it.
- Based: passes — The paper gives a reason why it holds.
It may state two separate claims as one.
None of the sources cited for this claim have been checked yet.
In the paper
“The heterogeneity between studies is echoed in two recent meta-analyses which show convergent findings for cingulate and OFC regions but differ in their findings relating to striatal and limbic structures (Egger et al., 2008; Tang et al., 2007).”
§ Widespread reductions in gray matter volume in depression☆ > Introduction
What the sources say
- Not checked yetcites Egger et al., 2008 source
- Not checked yetcites Tang et al., 2007
plaincorrelational- Asserted: passes — The authors put it forward as true.
- Checkable: passes — It can be checked against evidence.
- Load-bearing: unclear — It is unclear whether the paper’s conclusions depend on it.
- Based: passes — The paper gives a reason why it holds.
It may state two separate claims as one.
The paper states this without a source or data behind it here, so there is nothing to check it against. The quote shows it is in the paper.
In the paper
“While it is clear that volumetric GM regional loss occurs in MDD, the precise pattern of this loss has not been clearly defined.”
§ Widespread reductions in gray matter volume in depression☆ > Introduction
boostedcorrelational- Asserted: passes — The authors put it forward as true.
- Checkable: passes — It can be checked against evidence.
- Load-bearing: passes — The paper’s conclusions depend on it.
- Based: passes — The paper gives a reason why it holds.
It may state two separate claims as one.
The paper states this without a source or data behind it here, so there is nothing to check it against. The quote shows it is in the paper.
In the paper
“Another region which has been consistently identified in functional imaging studies of MDD is the DLPFC”
§ Widespread reductions in gray matter volume in depression☆ > Introduction
boostedcorrelational- Asserted: passes — The authors put it forward as true.
- Checkable: passes — It can be checked against evidence.
- Load-bearing: fails — The paper’s conclusions may not depend on it.
- Based: passes — The paper gives a reason why it holds.
Probably not a substantial claim. The paper’s conclusions may not depend on it.
In the paper
“A recent analysis of gray matter structural networks highlighted the presence of global organizational abnormalities that are associated with a diagnosis of depression (Singh et al., in press).”
§ Widespread reductions in gray matter volume in depression☆ > Introduction
What the sources say
- Not checked yetcites Singh et al., in press
plaincorrelational- Asserted: passes — The authors put it forward as true.
- Checkable: passes — It can be checked against evidence.
- Load-bearing: fails — The paper’s conclusions may not depend on it.
- Based: passes — The paper gives a reason why it holds.
Probably not a substantial claim. The paper’s conclusions may not depend on it.
In the paper
“A substantial body of imaging data demonstrates spatially distributed functional abnormalities occurring throughout the brain in MDD (Drevets et al., 2008).”
§ Widespread reductions in gray matter volume in depression☆ > Introduction
What the sources say
- Not checked yetcites Drevets et al., 2008 source
boostedcorrelational- Asserted: passes — The authors put it forward as true.
- Checkable: passes — It can be checked against evidence.
- Load-bearing: passes — The paper’s conclusions depend on it.
- Based: passes — The paper gives a reason why it holds.
Probably not a substantial claim.
None of the sources cited for this claim have been checked yet.
In the paper
“We have recently presented data from this study supporting the concept that functional and white matter Diffusion Tensor Imaging (DTI) structural deficits underlie the fronto-limbic dysfunction observed in MDD (Grieve et al., 2013; Korgaonkar et al., 2011, 2012).”
§ Widespread reductions in gray matter volume in depression☆ > Introduction
What the sources say
- Not checked yetcites Grieve et al., 2013 source
- Not matchedcites Korgaonkar et al., 2011, 2012
Couldn’t be matched to a paper in Crossref, so it can’t be checked.
plaindirect- Asserted: passes — The authors put it forward as true.
- Checkable: passes — It can be checked against evidence.
- Load-bearing: passes — The paper’s conclusions depend on it.
- Based: passes — The paper gives a reason why it holds.
Probably not a substantial claim.
A conclusion the paper draws from its own results — it cites no other source for it, so there is none to check. The quote shows it is in the paper.
In the paper
“The global patterns of the abnormalities that are being identified using DTI and functional MRI suggest that associated GM changes may also be present which might reflect these abnormal networks.”
§ Widespread reductions in gray matter volume in depression☆ > Introduction
hedgedcorrelational- Asserted: passes — The authors put it forward as true.
- Checkable: passes — It can be checked against evidence.
- Load-bearing: passes — The paper’s conclusions depend on it.
- Based: passes — The paper gives a reason why it holds.
Probably not a substantial claim. It may state two separate claims as one.
None of the sources cited for this claim have been checked yet.
In the paper
“Existing studies in patients with MDD have shown loss of GM volume across a range of cortical brain regions, including the medial prefrontal regions of the anterior cingulate cortex and orbitofrontal cortex (OFC), the lateral prefrontal cortex, the temporal cortex (Ballmaier et al., 2004), and the pre- and post-central gyri (Taki et al., 2005).”
§ Widespread reductions in gray matter volume in depression☆ > Introduction
What the sources say
- Not checked yetcites Ballmaier et al., 2004 source
- Not checked yetcites Taki et al., 2005
plaincorrelational- Asserted: passes — The authors put it forward as true.
- Checkable: passes — It can be checked against evidence.
- Load-bearing: passes — The paper’s conclusions depend on it.
- Based: passes — The paper gives a reason why it holds.
It may state two separate claims as one.
What the paper did — it cites no source for this, so there is none to check. The quote shows it is in the paper.
In the paper
“Since our cohort was age and gender matched we did not co-vary for these parameters.”
§ Widespread reductions in gray matter volume in depression☆ > Material and methods > Statistical analyses
plaindirect- Asserted: passes — The authors put it forward as true.
- Checkable: passes — It can be checked against evidence.
- Load-bearing: passes — The paper’s conclusions depend on it.
- Based: passes — The paper gives a reason why it holds.
Probably not a substantial claim.
- Rests on an assumption: Age and gender matching is sufficient to remove confounding by age and gender.
In the paper
“The relatively young age of our cohort is also important since the DLPFC undergoes accelerated GM loss during “normal” aging (Grieve et al., 2005), so in a geriatric MDD cohort these changes may be attenuated relative to the normal population due to age-related changes common to both groups.”
§ Widespread reductions in gray matter volume in depression☆ > Discussion
What the sources say
- Not checked yetcites Grieve et al., 2005 source
hedgedconditional- Asserted: passes — The authors put it forward as true.
- Checkable: passes — It can be checked against evidence.
- Load-bearing: passes — The paper’s conclusions depend on it.
- Based: passes — The paper gives a reason why it holds.
It may state two separate claims as one.
What the paper did — it cites no source for this, so there is none to check. The quote shows it is in the paper.
In the paper
“Ours is the largest study to specifically examine GM volumetric changes in MDD and it provides a very robust level of evidence documenting the structural pattern of GM loss.”
§ Widespread reductions in gray matter volume in depression☆ > Discussion
boosted- Asserted: passes — The authors put it forward as true.
- Checkable: passes — It can be checked against evidence.
- Load-bearing: passes — The paper’s conclusions depend on it.
- Based: passes — The paper gives a reason why it holds.
It may state two separate claims as one.
None of the sources cited for this claim have been checked yet.
In the paper
“Importantly, the medial orbital prefrontal cortex/gyrus rectus is badly affected by magnetic susceptibility artifact in fMRI studies, and to a lesser extent in DTI studies, due to the sensitivity of the echo planar imaging sequence to magnetic field gradients that occur adjacent to the paranasal sinuses.”
§ Widespread reductions in gray matter volume in depression☆ > Discussion
What the sources say
plaindirect- Asserted: passes — The authors put it forward as true.
- Checkable: passes — It can be checked against evidence.
- Load-bearing: unclear — It is unclear whether the paper’s conclusions depend on it.
- Based: passes — The paper gives a reason why it holds.
It may state two separate claims as one.
What the paper did — it cites no source for this, so there is none to check. The quote shows it is in the paper.
In the paper
“While a VBM analysis is an unbiased method to tackle these issues, the necessity for a severe correction for type 1 error at the whole brain level may limit statistical power especially with smaller cohorts.”
§ Widespread reductions in gray matter volume in depression☆ > Discussion
hedgedconditional- Asserted: passes — The authors put it forward as true.
- Checkable: passes — It can be checked against evidence.
- Load-bearing: fails — The paper’s conclusions may not depend on it.
- Based: passes — The paper gives a reason why it holds.
Probably not a substantial claim. The paper’s conclusions may not depend on it. It may state two separate claims as one.
What the paper did — it cites no source for this, so there is none to check. The quote shows it is in the paper.
In the paper
“Cortical segmentation and labels were manually inspected for accuracy.”
§ Widespread reductions in gray matter volume in depression☆ > Material and methods > Cortical thickness and sub-cortical volume analysis
plain- Asserted: passes — The authors put it forward as true.
- Checkable: passes — It can be checked against evidence.
- Load-bearing: fails — The paper’s conclusions may not depend on it.
- Based: passes — The paper gives a reason why it holds.
Probably not a substantial claim. The paper’s conclusions may not depend on it.
What the paper did — it cites no source for this, so there is none to check. The quote shows it is in the paper.
In the paper
“A statistical threshold of p < 0.05 (false discovery rate [FDR] corrected for multiple comparisons) was used.”
§ Widespread reductions in gray matter volume in depression☆ > Material and methods > Statistical analyses
plain- Asserted: passes — The authors put it forward as true.
- Checkable: passes — It can be checked against evidence.
- Load-bearing: passes — The paper’s conclusions depend on it.
- Based: passes — The paper gives a reason why it holds.
Probably not a substantial claim.
What the paper did — it cites no source for this, so there is none to check. The quote shows it is in the paper.
In the paper
“Cross-sectional data is unable to clarify whether these volume changes precede the development of depression or whether they occur secondary to the depressive state.”
§ Widespread reductions in gray matter volume in depression☆ > Discussion
plain- Asserted: passes — The authors put it forward as true.
- Checkable: passes — It can be checked against evidence.
- Load-bearing: passes — The paper’s conclusions depend on it.
- Based: passes — The paper gives a reason why it holds.
Probably not a substantial claim.
None of the sources cited for this claim have been checked yet.
In the paper
“These gradients reduce the contrast-to-noise of the Blood Oxygenation Level-Dependent response and also cause geometric distortion (Cusack et al., 2005; Grieve, 2000).”
§ Widespread reductions in gray matter volume in depression☆ > Discussion
What the sources say
plaindirect- Asserted: passes — The authors put it forward as true.
- Checkable: passes — It can be checked against evidence.
- Load-bearing: passes — The paper’s conclusions depend on it.
- Based: passes — The paper gives a reason why it holds.
Probably not a substantial claim. It may state two separate claims as one.
A conclusion the paper draws from its own results — it cites no other source for it, so there is none to check. The quote shows it is in the paper.
In the paper
“This finding may be secondary to the loss in sensitivity implicit in a whole-brain analysis, or may be a reflection that the GM volume changes are not adequately captured by cortical thickness measures.”
§ Widespread reductions in gray matter volume in depression☆ > Discussion
hedgedconditional- Asserted: passes — The authors put it forward as true.
- Checkable: passes — It can be checked against evidence.
- Load-bearing: fails — The paper’s conclusions may not depend on it.
- Based: passes — The paper gives a reason why it holds.
Probably not a substantial claim. The paper’s conclusions may not depend on it. It may state two separate claims as one.
In the paper
“The key methodological factors contributing to this are the variability in delineating this region across previous studies employing a region of interest approach and the large inter-individual variability for this region (Sanches et al., 2009).”
§ Widespread reductions in gray matter volume in depression☆ > Discussion
What the sources say
- Not checked yetcites Sanches et al., 2009 source
plaindirect- Asserted: passes — The authors put it forward as true.
- Checkable: passes — It can be checked against evidence.
- Load-bearing: passes — The paper’s conclusions depend on it.
- Based: passes — The paper gives a reason why it holds.
It may state two separate claims as one.
What the paper did — it cites no source for this, so there is none to check. The quote shows it is in the paper.
In the paper
“Our study presents a highly powered, highly standardized cross-sectional analysis of a well-described cohort with depression, providing valuable and novel insights into the GM volume changes that characterize depression.”
§ Widespread reductions in gray matter volume in depression☆ > Discussion
boosted- Asserted: passes — The authors put it forward as true.
- Checkable: passes — It can be checked against evidence.
- Load-bearing: passes — The paper’s conclusions depend on it.
- Based: passes — The paper gives a reason why it holds.
Probably not a substantial claim. It may state two separate claims as one.
What the paper did — it cites no source for this, so there is none to check. The quote shows it is in the paper.
In the paper
“This study was conducted according to the principles of the Declaration of Helsinki 2008.”
§ Widespread reductions in gray matter volume in depression☆ > Material and methods > Participants
plain- Asserted: passes — The authors put it forward as true.
- Checkable: passes — It can be checked against evidence.
- Load-bearing: fails — The paper’s conclusions may not depend on it.
- Based: passes — The paper gives a reason why it holds.
Probably not a substantial claim. The paper’s conclusions may not depend on it.
What the paper did — it cites no source for this, so there is none to check. The quote shows it is in the paper.
In the paper
“Our cohort is well characterized and non-geriatric, with an average age of 34 years (standard deviation: 13 years).”
§ Widespread reductions in gray matter volume in depression☆ > Discussion
plain- Asserted: passes — The authors put it forward as true.
- Checkable: passes — It can be checked against evidence.
- Load-bearing: fails — The paper’s conclusions may not depend on it.
- Based: passes — The paper gives a reason why it holds.
Probably not a substantial claim. The paper’s conclusions may not depend on it. It may state two separate claims as one.
In the paper
“These comparisons are based on our previously presented data on normal aging in 476 individuals without a psychiatric or other medical diagnosis (Grieve et al., 2005, 2011).”
§ Widespread reductions in gray matter volume in depression☆ > Material and methods > Statistical analyses
What the sources say
- Not matchedcites Grieve et al., 2005, 2011
Couldn’t be matched to a paper in Crossref, so it can’t be checked.
plainn = 476- Asserted: passes — The authors put it forward as true.
- Checkable: passes — It can be checked against evidence.
- Load-bearing: passes — The paper’s conclusions depend on it.
- Based: passes — The paper gives a reason why it holds.
Probably not a substantial claim.
- Not matched
What the paper did — it cites no source for this, so there is none to check. The quote shows it is in the paper.
In the paper
“The whole-brain analysis approach used in the study also means that no a priori regional bias was added to our findings.”
§ Widespread reductions in gray matter volume in depression☆ > Discussion
plaindirect- Asserted: passes — The authors put it forward as true.
- Checkable: passes — It can be checked against evidence.
- Load-bearing: fails — The paper’s conclusions may not depend on it.
- Based: passes — The paper gives a reason why it holds.
Probably not a substantial claim. The paper’s conclusions may not depend on it.
In the paper
“The OFC has extensive connections with the limbic system, including from the cingulate cortex (Ongür and Price, 2000).”
§ Widespread reductions in gray matter volume in depression☆ > Discussion
What the sources say
- Not checked yetcites Ongür and Price, 2000
plaincorrelational- Asserted: passes — The authors put it forward as true.
- Checkable: passes — It can be checked against evidence.
- Load-bearing: fails — The paper’s conclusions may not depend on it.
- Based: passes — The paper gives a reason why it holds.
Probably not a substantial claim. The paper’s conclusions may not depend on it.
What the paper did — it cites no source for this, so there is none to check. The quote shows it is in the paper.
In the paper
“Our cohort is a relatively young population and has an average duration of depression of 11 years.”
§ Widespread reductions in gray matter volume in depression☆ > Discussion
plain- Asserted: passes — The authors put it forward as true.
- Checkable: passes — It can be checked against evidence.
- Load-bearing: passes — The paper’s conclusions depend on it.
- Based: passes — The paper gives a reason why it holds.
It may state two separate claims as one.
None of the sources cited for this claim have been checked yet.
In the paper
“While some of the reasons for this may be methodological such as MR image acquisition parameters, post acquisition processing and the method used for volumetric assessment (Geuze et al., 2005; Morey et al., 2009), it is clear that volumetric changes of the hippocampus that occur with age, with various neuropsychiatric disorders, and also in response to stress are quite heterogeneous.”
§ Widespread reductions in gray matter volume in depression☆ > Discussion
What the sources say
boosted- Asserted: passes — The authors put it forward as true.
- Checkable: passes — It can be checked against evidence.
- Load-bearing: fails — The paper’s conclusions may not depend on it.
- Based: passes — The paper gives a reason why it holds.
Probably not a substantial claim. The paper’s conclusions may not depend on it.
The paper states this without a source or data behind it here, so there is nothing to check it against. The quote shows it is in the paper.
In the paper
“Previous studies (with different MDD cohorts) that looked at both of these measures have shown mixed data, with some having shown no cortical thickness changes while others have shown changes.”
§ Widespread reductions in gray matter volume in depression☆ > Discussion
plain- Asserted: passes — The authors put it forward as true.
- Checkable: passes — It can be checked against evidence.
- Load-bearing: fails — The paper’s conclusions may not depend on it.
- Based: fails — The paper may give no reason why it holds.
Probably not a substantial claim. The paper’s conclusions may not depend on it. The paper may give no reason why it holds. It may state two separate claims as one.
None of the sources cited for this claim have been checked yet.
In the paper
“While the lack of correlation in our study replicates previous studies that found the same (McKinnon et al., 2009; Zou et al., 2010), a significant association between GM volume and depression severity has also been previously reported (Chen et al., 2007; Cheng et al., 2010).”
§ Widespread reductions in gray matter volume in depression☆ > Discussion
What the sources say
plaincorrelational- Asserted: passes — The authors put it forward as true.
- Checkable: passes — It can be checked against evidence.
- Load-bearing: fails — The paper’s conclusions may not depend on it.
- Based: passes — The paper gives a reason why it holds.
Probably not a substantial claim. The paper’s conclusions may not depend on it. It may state two separate claims as one.
None of the sources cited for this claim have been checked yet.
In the paper
“Hippocampal volume loss has been identified as a significant feature of MDD in one recent meta-analysis of structural brain changes in depression, but not in a second meta-analysis.”
§ Widespread reductions in gray matter volume in depression☆ > Discussion
plain- Asserted: passes — The authors put it forward as true.
- Checkable: passes — It can be checked against evidence.
- Load-bearing: fails — The paper’s conclusions may not depend on it.
- Based: passes — The paper gives a reason why it holds.
Probably not a substantial claim. The paper’s conclusions may not depend on it. It may state two separate claims as one.
In the paper
“Our previous work using DTI data showed that connectivity in the cingulate portion of the cingulate bundle has structural changes with MDD at baseline and also has an impact on remission (Korgaonkar et al., under review).”
§ Widespread reductions in gray matter volume in depression☆ > Discussion
What the sources say
- Not checked yetcites Korgaonkar et al., under review
plaindirect- Asserted: passes — The authors put it forward as true.
- Checkable: passes — It can be checked against evidence.
- Load-bearing: fails — The paper’s conclusions may not depend on it.
- Based: passes — The paper gives a reason why it holds.
Probably not a substantial claim. The paper’s conclusions may not depend on it. It may state two separate claims as one.
In the paper
“The functional role of the cingulate cortex—and specifically the ACC—in depression is well described (Drevets et al., 2008).”
§ Widespread reductions in gray matter volume in depression☆ > Discussion
What the sources say
- Not checked yetcites Drevets et al., 2008 source
boosted- Asserted: passes — The authors put it forward as true.
- Checkable: passes — It can be checked against evidence.
- Load-bearing: fails — The paper’s conclusions may not depend on it.
- Based: passes — The paper gives a reason why it holds.
Probably not a substantial claim. The paper’s conclusions may not depend on it.
In the paper
“Abnormal resting state functional connectivity of these same regions has been described in MDD (Greicius et al., 2007).”
§ Widespread reductions in gray matter volume in depression☆ > Discussion
What the sources say
- Not checked yetcites Greicius et al., 2007 source
plaincorrelational- Asserted: passes — The authors put it forward as true.
- Checkable: passes — It can be checked against evidence.
- Load-bearing: fails — The paper’s conclusions may not depend on it.
- Based: passes — The paper gives a reason why it holds.
Probably not a substantial claim. The paper’s conclusions may not depend on it.
In the paper
“Heritability analyses using twins data have demonstrated that there are different genetic drivers for GM volume and cortical thickness measures (Winkler et al., 2010).”
§ Widespread reductions in gray matter volume in depression☆ > Discussion
What the sources say
- Not checked yetcites Winkler et al., 2010 source
boostedcorrelational- Asserted: passes — The authors put it forward as true.
- Checkable: passes — It can be checked against evidence.
- Load-bearing: fails — The paper’s conclusions may not depend on it.
- Based: passes — The paper gives a reason why it holds.
Probably not a substantial claim. The paper’s conclusions may not depend on it.
The paper relies on this without support.
The iSPOT-D MDD outpatient sample is representative of non-geriatric MDD patients generally.
“Non-geriatric MDD outpatients (n = 102) and age- and gender-matched healthy control participants (n = 34) provided T1-weighted magnetic resonance imaging data during their baseline visit as part of the International Study to Predict Optimized Treatment for Depression.”
The paper relies on this without support.
The cross-sectional gray matter differences between MDD and control participants reflect depression-related structural abnormalities rather than pre-existing or other confounding factors.
“MDD participants had reduced gray matter volume in the anterior cingulate cortex, regions of the prefrontal circuits, including dorsolateral and dorsomedial prefrontal cortices, and lateral and medial orbitofrontal cortices, but not in limbic regions.”
The paper relies on this without support.
Age and gender matching is sufficient to remove confounding by age and gender.
“Since our cohort was age and gender matched we did not co-vary for these parameters.”
The paper relies on this without support.
Normal aging gray matter volume loss rates (CVNA) are valid for converting observed MDD gray matter loss into equivalent years of normal aging.
“would be expected from nearly 14 years of normal aging”
“greater than 50 years CVNA”
The paper relies on this without support.
There is a scarcity of prior data that specifically examines gray matter volume changes in the DLPFC with MDD.
“There is a scarcity of prior data that specifically examines GM volume changes in the DLPFC with MDD.”
Claims other papers make about this one
Each is checked against this paper’s own text: does it say what the citing paper says it does?
In the citing paper
“reductions of grey-matter volume have been demonstrated specifically in the posterolateral OFC (BA 47, caudal BA 11 and the adjoining BA 45), and also in the subgenual cingulate cortex (BA 24, 25) (Nugent et al., 2006; Drevets, 2007; Grieve et al., 2013).”
From The orbitofrontal cortex: reward, emotion and depression (2020) · cites this paper as Grieve et al., 2013
Citations
Cites
Tzourio-Mazoyer, N., Landeau, B., Papathanassiou, D., Crivello, F., Etard, O., Delcroix, N., Mazoyer, B., & Joliot, M. (2002) · NeuroImage · doi:10.1006/nimg.2001.0978 · Cited by 16,319
Projections of Global Mortality and Burden of Disease from 2002 to 2030
Mathers, C. D., & Loncar, D. (2006) · PLoS Medicine · doi:10.1371/journal.pmed.0030442 · Cited by 11,386
Cortical Surface-Based Analysis
Dale, A. M., Fischl, B., & Sereno, M. I. (1999) · NeuroImage · doi:10.1006/nimg.1998.0395 · Cited by 10,910
A fast diffeomorphic image registration algorithm
Ashburner, J. (2007) · NeuroImage · doi:10.1016/j.neuroimage.2007.07.007 · Cited by 8,122
Functional connectivity in the resting brain: a network analysis of the default mode hypothesis
Greicius, M. D., Krasnow, B., Reiss, A. L., & Menon, V. (2003) · Proceedings of the National Academy of Sciences · doi:10.1073/pnas.0135058100 · Cited by 6,358
Cortical Surface-Based Analysis
Fischl, B., Sereno, M. I., & Dale, A. M. (1999) · NeuroImage · doi:10.1006/nimg.1998.0396 · Cited by 6,147
Measuring the thickness of the human cerebral cortex from magnetic resonance images
Fischl, B. R., & Dale, A. M. (2000) · Proceedings of the National Academy of Sciences · doi:10.1073/pnas.200033797 · Cited by 5,981
Ongur, D. (2000) · Cerebral Cortex · doi:10.1093/cercor/10.3.206 · Cited by 2,627
Greicius, M. D., Flores, B. H., Menon, V., Glover, G. H., Solvason, H. B., Kenna, H., Reiss, A. L., & Schatzberg, A. F. (2007) · Biological Psychiatry · doi:10.1016/j.biopsych.2006.09.020 · Cited by 2,214
Winkler, A. M., Kochunov, P., Blangero, J., Almasy, L., Zilles, K., Fox, P. T., Duggirala, R., & Glahn, D. C. (2010) · NeuroImage · doi:10.1016/j.neuroimage.2009.12.028 · Cited by 1,172
The subgenual anterior cingulate cortex in mood disorders
Drevets, W. C., Savitz, J., & Trimble, M. (2008) · CNS Spectrums · doi:10.1017/s1092852900013754 · Cited by 1,109
A meta‐analytic study of changes in brain activation in depression
Fitzgerald, P. B., Laird, A. R., Maller, J., & Daskalakis, Z. J. (2008) · Human Brain Mapping · doi:10.1002/hbm.20426 · Cited by 903
Koolschijn, P. C. M. P., van Haren, N. E. M., Lensvelt‐Mulders, G. J. L. M., Hulshoff Pol, H. E., & Kahn, R. S. (2009) · Human Brain Mapping · doi:10.1002/hbm.20801 · Cited by 902
Hamilton, J. P., Etkin, A., Furman, D. J., Lemus, M. G., Johnson, R. F., & Gotlib, I. H. (2012) · American Journal of Psychiatry · doi:10.1176/appi.ajp.2012.11071105 · Cited by 866
Mirowsky, J., & Ross, C. E. (1992) · Journal of Health and Social Behavior · doi:10.2307/2137349 · Cited by 856
Bora, E., Fornito, A., Pantelis, C., & Yücel, M. (2012) · Journal of Affective Disorders · doi:10.1016/j.jad.2011.03.049 · Cited by 763
McKinnon, M. C., Yucel, K., Nazarov, A., & MacQueen, G. M. (2009) · Journal of Psychiatry and Neuroscience · doi:10.1139/jpn.0905 · Cited by 742
Statistical approach to segmentation of single-channel cerebral MR images
Rajapakse, J. C., Giedd, J. N., & Rapoport, J. L. (1997) · IEEE Transactions on Medical Imaging · doi:10.1109/42.563663 · Cited by 678
Fast and robust parameter estimation for statistical partial volume models in brain MRI
Tohka, J., Zijdenbos, A. P., & Evans, A. C. (2004) · NeuroImage · doi:10.1016/j.neuroimage.2004.05.007 · Cited by 670
Morey, R. A., Petty, C. M., Xu, Y., Pannu Hayes, J., Wagner, H. R., Lewis, D. V., LaBar, K. S., Styner, M., & McCarthy, G. (2009) · NeuroImage · doi:10.1016/j.neuroimage.2008.12.033 · Cited by 540
Arnone, D., McIntosh, A. M., Ebmeier, K. P., Munafò, M. R., & Anderson, I. M. (2012) · European Neuropsychopharmacology · doi:10.1016/j.euroneuro.2011.05.003 · Cited by 495
Chen, C.-H., Ridler, K., Suckling, J., Williams, S., Fu, C. H. Y., Merlo-Pich, E., & Bullmore, E. (2007) · Biological Psychiatry · doi:10.1016/j.biopsych.2006.09.018 · Cited by 354
Preservation of limbic and paralimbic structures in aging
Grieve, S. M., Clark, C. R., Williams, L. M., Peduto, A. J., & Gordon, E. (2005) · Human Brain Mapping · doi:10.1002/hbm.20115 · Cited by 293
Self-citationBora, E., Harrison, B. J., Davey, C. G., Yücel, M., & Pantelis, C. (2012) · Psychological Medicine · doi:10.1017/s0033291711001668 · Cited by 276
Fitzgerald, P. B., Oxley, T. J., Laird, A. R., Kulkarni, J., Egan, G. F., & Daskalakis, Z. J. (2006) · Psychiatry Research Neuroimaging · doi:10.1016/j.pscychresns.2006.04.006 · Cited by 254
Golkar, A., Lonsdorf, T. B., Olsson, A., Lindstrom, K. M., Berrebi, J., Fransson, P., Schalling, M., Ingvar, M., & Öhman, A. (2012) · PLoS ONE · doi:10.1371/journal.pone.0048107 · Cited by 235
A meta-analytic study of changes in brain activation in depression
Fitzgerald, P. B., Maller, J. J., Hoy, K. E., Oxley, T. J., Daskalakis, Z. J., & Laird, A. R. (2006) · Acta Neuropsychiatrica · doi:10.1017/s0924270800031173 · Cited by 233
Korgaonkar, M. S., Grieve, S. M., Koslow, S. H., Gabrieli, J. D. E., Gordon, E., & Williams, L. M. (2011) · Human Brain Mapping · doi:10.1002/hbm.21178 · Cited by 205
Self-citationWilliams, L. M., Rush, A. J., Koslow, S. H., Wisniewski, S. R., Cooper, N. J., Nemeroff, C. B., Schatzberg, A. F., & Gordon, E. (2011) · Trials · doi:10.1186/1745-6215-12-4 · Cited by 198
Self-citationMR-based in vivo hippocampal volumetrics: 1. Review of methodologies currently employed
Geuze, E., Vermetten, E., & Bremner, J. D. (2005) · Molecular Psychiatry · doi:10.1038/sj.mp.4001580 · Cited by 185
Anomalous Gray Matter Structural Networks in Major Depressive Disorder
Singh, M. K., Kesler, S. R., Hosseini, S. M. H., Kelley, R. G., Amatya, D. N., Hamilton, J. P., Chen, M. C., & Gotlib, I. H. (2013) · Biological Psychiatry · doi:10.1016/j.biopsych.2013.03.005 · Cited by 150
Zou, K., Deng, W., Li, T., Zhang, B., Jiang, L., Huang, C., Sun, X., & Sun, X. (2010) · Biological Psychiatry · doi:10.1016/j.biopsych.2009.09.014 · Cited by 141
Tang, Y., Wang, F., Xie, G., Liu, J., Li, L., Su, L., Liu, Y., Xian, H., He, Z., & Blumberg, H. P. (2007) · Psychiatry Research Neuroimaging · doi:10.1016/j.pscychresns.2007.03.005 · Cited by 140
Korgaonkar, M. S., Grieve, S. M., Etkin, A., Koslow, S. H., & Williams, L. M. (2013) · Neuropsychopharmacology · doi:10.1038/npp.2012.252 · Cited by 135
Self-citationTaki, Y., Kinomura, S., Awata, S., Inoue, K., Sato, K., Ito, H., Goto, R., Uchida, S., Tsuji, I., Arai, H., et al. (2005) · Journal of Affective Disorders · doi:10.1016/j.jad.2005.08.003 · Cited by 127
Mirowsky, J., & Ross, C. E. (1992) · PubMed · Cited by 117
Pattern of brain atrophy in elderly patients with depression revealed by voxel-based morphometry
Egger, K., Schocke, M., Weiss, E., Auffinger, S., Esterhammer, R., Goebel, G., Walch, T., Mechtcheriakov, S., & Marksteiner, J. (2008) · Psychiatry Research Neuroimaging · doi:10.1016/j.pscychresns.2007.12.018 · Cited by 113
Cheng, Y., Xu, J., Chai, P., Li, H., Luo, C., Yang, T., Li, L., Shan, B., Xu, X., & Xu, L. (2010) · Neuroscience Letters · doi:10.1016/j.neulet.2010.05.075 · Cited by 108
Mapping brain size and cortical gray matter changes in elderly depression
Ballmaier, M., Sowell, E. R., Thompson, P. M., Kumar, A., Narr, K. L., Lavretsky, H., Welcome, S. E., DeLuca, H., & Toga, A. W. (2004) · Biological Psychiatry · doi:10.1016/j.biopsych.2003.09.004 · Cited by 91
Schwartz, C. E., Kunwar, P. S., Greve, D. N., Moran, L. R., Viner, J. C., Covino, J. M., Kagan, J., Stewart, S. E., Snidman, N. C., Vangel, M. G., et al. (2010) · Archives of General Psychiatry · doi:10.1001/archgenpsychiatry.2009.171 · Cited by 82 · cited 1×
“Cerebellar volume differences between the two groups were not significant.”
BackgroundGrieve, S. M., Korgaonkar, M. S., Clark, C. R., & Williams, L. M. (2011) · NeuroImage · doi:10.1016/j.neuroimage.2010.12.087 · Cited by 64
Self-citationAn evaluation of the use of passive shimming to improve frontal sensitivity in fMRI
Cusack, R., Russell, B., Cox, S. M. L., De Panfilis, C., Schwarzbauer, C., & Ansorge, R. (2005) · NeuroImage · doi:10.1016/j.neuroimage.2004.08.029 · Cited by 59 · cited 1×
“Cerebellar volume differences between the two groups were not significant.”
BackgroundMapping inter-regional connectivity of the entire cortex to characterize major depressive disorder
Korgaonkar, M. S., Cooper, N. J., Williams, L. M., & Grieve, S. M. (2012) · Neuroreport · doi:10.1097/wnr.0b013e3283546264 · Cited by 57
Self-citationGrieve, S. M., Korgaonkar, M. S., Etkin, A., Harris, A., Koslow, S. H., Wisniewski, S., Schatzberg, A. F., Nemeroff, C. B., Gordon, E., & Williams, L. M. (2013) · Trials · doi:10.1186/1745-6215-14-224 · Cited by 44
Self-citationAn MRI-based approach for the measurement of the dorsolateral prefrontal cortex in humans
Sanches, M., Caetano, S., Nicoletti, M., Monkul, E. S., Chen, H. H., Hatch, J. P., Yeh, P.-H., Mullis, R. L., Keshavan, M. S., Rajowska, G., et al. (2009) · Psychiatry Research Neuroimaging · doi:10.1016/j.pscychresns.2009.02.007 · Cited by 23
Tu, X., Liu, F., Jordan, J. B., Ye, X. F., Fu, P., Wang, F., & Zhong, S. (2013) · Trials · doi:10.1186/1745-6215-14-223 · Cited by 16
Grieve (2000) · doi:10.1002/(sici)1522-2594(200005)43:5
Self-citation
Cited by
Sorted by citations
The orbitofrontal cortex: reward, emotion and depression
Rolls, E. T., Cheng, W., & Feng, J. (2020) · Brain Communications · doi:10.1093/braincomms/fcaa196 · Cited by 474
Abnormal Structural Networks Characterize Major Depressive Disorder: A Connectome Analysis
Korgaonkar, M. S., Fornito, A., Williams, L. M., & Grieve, S. M. (2014) · Biological Psychiatry · doi:10.1016/j.biopsych.2014.02.018 · Cited by 367
Self-citationWilliams, L. M. (2016) · Depression and Anxiety · doi:10.1002/da.22556 · Cited by 302
Self-citationReproductive Steroid Regulation of Mood and Behavior
Schiller, C. E., Johnson, S., Abate, A., Schmidt, P. J., & Rubinow, D. R. (2016) · Comprehensive physiology · doi:10.1002/cphy.c150014 · Cited by 224
Särkämö, T., Ripollés, P., Vepsäläinen, H., Autti, T. H., Silvennoinen, H. M., Salli, E., Laitinen, S., Forsblom, A., Soinila, S. O., & Rodríguez‐Fornells, A. (2014) · Frontiers in Human Neuroscience · doi:10.3389/fnhum.2014.00245 · Cited by 209
Metadata
- Authors
- Grieve, S. M., Korgaonkar, M. S., Koslow, S. H., Gordon, E., & Williams, L. M.
- Affiliations
- The University of Sydney (AU)
- University of Miami (US)
- Corresponding author
- Grieve, Stuart M.
- Venue
- NeuroImage: Clinical
- Publisher
- Elsevier BV
- Published
- 2013
- Volume
- 3
- Pages
- 332-339
- ISSN
- 2213-1582 (ISSN-L)
- PMC
- PMC3814952
- OpenAlex
- W2085105520
- Semantic Scholar
- 9a38fb0b491f72f6074900f28dc4cc2ed6374f7f
- Cited by
- 388
- References
- 45
- Citations by year
- 2026: 22 · 2025: 25 · 2024: 36 · 2023: 27 · 2022: 35 · 2021: 36 · 2020: 28 · 2019: 29 · 2018: 31 · 2017: 29 · 2016: 32 · 2015: 38 · 2014: 19 · 2013: 1
- FWCI
- 22.07
- Type
- journal article
- Language
- en
- Open access
- gold
- doi.org
- Licence
- Locations
- NeuroImage Clinical (publishedVersion, cc-by-nc-nd)
- Europe PMC (PubMed Central) (publishedVersion, cc-by-nc-nd)
- PubMed Central (publishedVersion, cc-by-nc-nd)
- PubMed (publishedVersion)
- Funders
- Brain Resource Company Operations Pty Ltd
- Sydney Medical School Foundation
- Topics
- Health Sciences › Medicine › Pharmacology (medical) › Treatment of Major Depression
- Life Sciences › Neuroscience › Cognitive Neuroscience › Neural and Behavioral Psychology Studies
- Life Sciences › Neuroscience › Cognitive Neuroscience › Functional Brain Connectivity Studies
- Keywords
- major depressive disorder, gray matter volume, cortical thickness, anterior cingulate cortex, prefrontal cortex, orbitofrontal cortex, limbic circuits, structural brain abnormalities, basal ganglia, cerebellum, cortical thinning, voxel-based morphometry
About these checks
Registry, retraction, Cites and statistics results are computed, not judged, with one exception: a printed reference that no index lists is read once by a model before it counts as a citation error. Claims are extracted by a model and kept only when their quote appears verbatim in the text; each cited source is then checked, with a model’s help, for whether it says what the claim relies on. Those verdicts can be wrong — read the claim’s quote and the cited source before relying on one.
A language model drew the claims from the paper on 2026-10-09, under version 3 of the claim definition (model deepseek-v4.1-flash, prompt extract-v3).
A second model labelled each claim on 2026-10-09 (model jev-1.13-20260917, definition revision gold-guideline-v0.2).
Statistics and arithmetic are recomputed, not judged.
Confidence bands are shown only for fields calibrated on our annotated test set. None is calibrated yet, so no band is shown.
What counts as a claim ›How we measure confidence ›How we check this ›
Are you an author, or do you see a problem with this page? Request a review
