

The DOI matches its Crossref record; 44 of the 44 references it cites were found in a registry or an index; 22 of the 41 sources its claims cite were checked for support.
APOE2, E3, and E4 differentially modulate cellular homeostasis, cholesterol metabolism, and inflammatory response in isogenic iPSC-derived astrocytes
Open accessPublished version of a preprint
Abstract
The apolipoprotein E4 (APOE4) variant is the strongest genetic risk factor for Alzheimer disease (AD), while the APOE2 allele is protective. A major question is how different APOE genotypes affect the physiology of astrocytes, the main APOE-producing brain cells. Here, we differentiated human APOE-isogenic induced pluripotent stem cells (iPSCs) (APOE4, E3, E2, and APOE knockout [APOE-KO]) to functional "iAstrocytes". Mass-spectrometry-based proteomic analysis showed genotype-dependent reductions of cholesterol and lipid metabolic and biosynthetic pathways (reduction: APOE4 >E3 >E2). Cholesterol efflux and biosynthesis were reduced in APOE4 iAstrocytes, while subcellular localization of cholesterol in lysosomes was elevated. An increase in immunoregulatory proteomic pathways (APOE4 >E3 >E2) was accompanied by elevated cytokine release in APOE4 cells (APOE4 >E3 >E2 >KO). Activation of iAstrocytes exacerbated proteomic changes and cytokine secretion mostly in APOE4 iAstrocytes, while APOE2 and APOE-KO iAstrocytes were least affected. Taken together, APOE4 iAstrocytes reveal a disease-relevant phenotype, causing dysregulated cholesterol/lipid homeostasis, increased inflammatory signaling, and reduced β-amyloid uptake, while APOE2 iAstrocytes show opposing effects.
Overview
AI snapshot
Written from the paper’s full text.
TL;DR
APOE-isogenic human iPSC-derived astrocytes show allele-dependent phenotypes, with APOE4 displaying reduced cholesterol/lipid biosynthesis and efflux, increased lysosomal cholesterol, higher inflammatory signaling, and lower glutamate/Aβ42 uptake, while APOE2 often resembles APOE-KO. APOE4 iAstrocytes are also most susceptible to IL-1β-induced proteomic and cytokine changes.
Key findings
- Differentiation yielded mature, quiescent iAstrocytes from APOE2, APOE3, APOE4, and APOE-KO iPSCs; label-free proteomics detected 3,765 proteins, with 2,432 differentially expressed between NPCs and iAstrocytes (FDR <0.1). APOE-KO samples were omitted from quantitative proteomic analysis because they were more dispersed by PCA and had substantially fewer peptides/proteins.
- Homeostatic functions declined allele-dependently: glutamate uptake was lowest in APOE4 and highest in APOE2/APOE-KO (KO = E2 > E3 > E4); Aβ42 uptake trended KO > E2 > E3 ≥ E4 (E3 vs E4 p = 0.054), and RAP blocked Aβ uptake in APOE-KO, E2, and E3 but not E4 (p = 0.23).
- Cholesterol/lipid pathways were downregulated in APOE4 versus E3/E2 by GSEA; FDFT1 and ABCA1 were regulated KO = E2 > E3 > E4; total, cellular, and secreted cholesterol were E2 = E3 > E4 = KO; non-membrane-bound cholesterol was E4 > E3 = E2 = KO; lysosomal cholesterol colocalization was E4 > E2; LAMP2 was E3 > E2 = E4 = KO; lysosomal activity was KO = E2 > E3 = E4.
- Inflammatory pathways at baseline were E4 > E3 > E2; cytokine release after IL-1β or TNF-α was E4 > E3 > E2 > KO except IL-8, and IL-6/IL-8 were detectable at baseline in APOE4. IL-1β treatment exacerbated proteomic changes mostly in APOE4, while APOE2 and APOE-KO were least affected.
Methods
- APOE-isogenic iPSC lines from EBiSC (BIONi010-C-2, -C-3, -C-4, -C-6) were differentiated to NPCs and then to iAstrocytes using ScienCell astrocyte medium; FCS was withdrawn and AraC added from day 30–37, with analysis at day 44.
- Main assays included label-free mass-spectrometry proteomics with GSEA/edgeR, HPTLC lipid quantification, western blot, immunocytochemistry/confocal imaging, flow-cytometry Aβ42 uptake, MSD cytokine measurement, Filipin III/Dextran-Alexa 555 staining, lysosomal activity, and NF-κB assay.
- Most experiments used three independent experiments with individual data points plotted; MSD cytokine data came from five cell culture wells in one experiment.
Limitations
- The paper states that APOE-KO iAstrocytes were excluded from quantitative proteomic analysis because of higher variation and lower peptide/protein numbers, which would bias normalization.
- The paper notes that day 44 iAstrocytes were not susceptible to Aβ42 activation, possibly requiring priming, and that no major endosomal/lysosomal morphology abnormalities were observed; it also cannot exclude a transient NF-κB increase.
- Evident from the text: each APOE genotype was represented by a single isogenic iPSC line, cytokine data came from one MSD experiment, and findings are from an in vitro iPSC-derived astrocyte model.
Model-written summary. Check it against the paper before relying on it.
Integrity signals
Registry
Cites
Statistics
Figures
Verification
Claims the paper makes
79 Own result · 28 Own interpretation · 12 Partly supported · 11 No full text of the sources · 8 No basis given · 6 Supported · 4 Sources not found · 3 Not checked yet · 1 Couldn’t confirm · 1 Own method · accuracy not yet measured
Every source the paper cites for this claim was checked and supports it.
In the paper
“These results demonstrate an isoform-dependent regulation of APOE protein levels, as was previously shown for E3 and E4 in vitro, or in patient cerebrospinal fluid (CSF) (Lin et al., 2018; Mahley, 2016).”
§ APOE2, E3, and E4 differentially modulate cellular homeostasis, cholesterol metabolism, and inflammatory response in isogenic iPSC-derived astrocytes > Results > Homeostatic functions show APOE allele-dependent decline in iAstrocytes
What the sources say
- Supportedcites Lin et al., 2018 source
The Results section, under “APOE4 astrocytes exhibit compromised Aβ uptake,” reports significantly lower cellular and secreted APOE protein in APOE4 than APOE3 iPSC-derived astrocytes. This supports the cited in vitro comparison of isoform-dependent APOE protein levels; the sentence also cites another source for the patient-CSF alternative. (LLM, conf=0.92)
- Supportedcites Mahley, 2016 source
In “ApoE Structure Modulates ApoE Levels and Metabolism,” the paper reports that cultured apoE3/4 astrocytes secrete less apoE4 than apoE3. In “Isoform-Specific Effects on Human CSF ApoE Levels,” it reports an isoform-dependent gradient in human CSF, with apoE4 lowest. These passages support the attributed comparison of apoE protein levels in vitro and in human CSF. (LLM, conf=0.91)
boosteddirect- Asserted: passes — The authors put it forward as true.
- Checkable: passes — It can be checked against evidence.
- Load-bearing: passes — The paper’s conclusions depend on it.
- Based: passes — The paper gives a reason why it holds.
- Supported
The cited sources support only part of this claim — read each source’s verdict below.
In the paper
“Our findings of an inflammatory phenotype in resting APOE4 iAstrocytes could explain the mechanistic link between chronic inflammation and AD pathogenesis in APOE4 carriers (Tao et al., 2018).”
§ APOE2, E3, and E4 differentially modulate cellular homeostasis, cholesterol metabolism, and inflammatory response in isogenic iPSC-derived astrocytes > Discussion > Cholesterol metabolism and inflammatory regulation
What the sources say
- Partly supportedcites Tao et al., 2018 sourceExperimental — accuracy not yet measured
The Results and Discussion report an association between chronic low-grade inflammation and increased Alzheimer disease risk in ApoE4 carriers, supporting the link the citing authors invoke. But the Discussion explicitly says the mechanism for that interaction is unknown, so this source does not establish a mechanistic link. The iAstrocyte finding is the citing authors’ own finding, not one attributed to Tao et al. (LLM, conf=0.84)
hedgedconditional- Asserted: passes — The authors put it forward as true.
- Checkable: passes — It can be checked against evidence.
- Load-bearing: passes — The paper’s conclusions depend on it.
- Based: passes — The paper gives a reason why it holds.
- Rests on an assumption: The in vitro iPSC-derived iAstrocyte model recapitulates relevant aspects of human astrocyte biology and APOE-related AD mechanisms.
- Partly supported
A result the paper reports from its own data — it cites no other source for it, so there is none to check. The quote shows it is in the paper.
In the paper
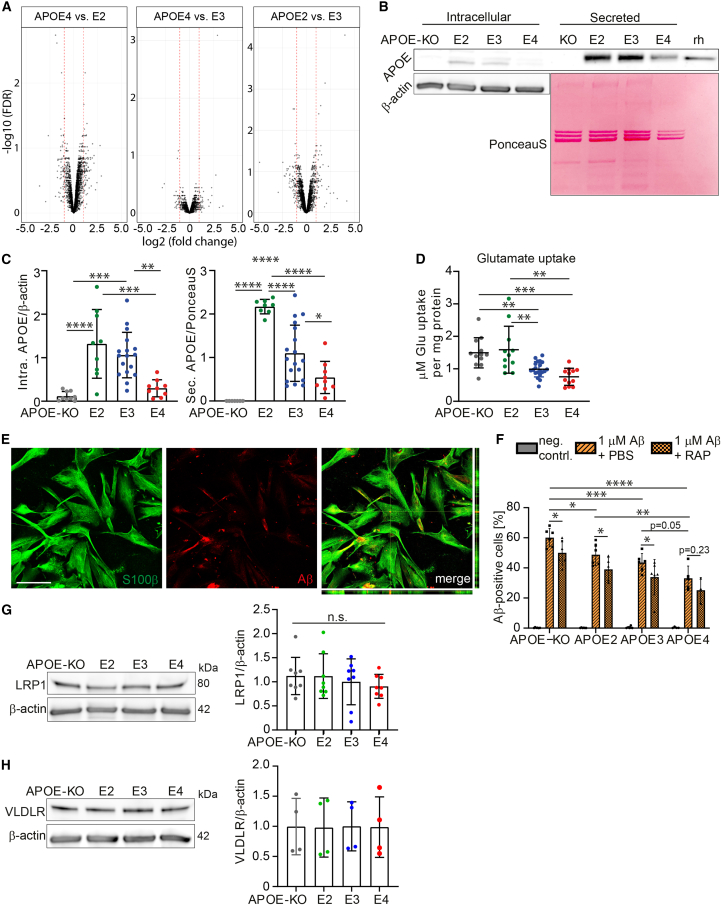
“Blocking LDLR family members caused a significant decrease in Aβ uptake in APOE-KO, E2, and E3, but not in E4 iAstrocytes (p = 0.23).”
§ APOE2, E3, and E4 differentially modulate cellular homeostasis, cholesterol metabolism, and inflammatory response in isogenic iPSC-derived astrocytes > Results > Homeostatic functions show APOE allele-dependent decline in iAstrocytes
plaindirect- Asserted: passes — The authors put it forward as true.
- Checkable: passes — It can be checked against evidence.
- Load-bearing: passes — The paper’s conclusions depend on it.
- Based: passes — The paper gives a reason why it holds.
- Rests on an assumption: Aβ42 is mostly taken up through receptor-dependent endocytosis, such as LRP1.
A result the paper reports from its own data — it cites no other source for it, so there is none to check. The quote shows it is in the paper.
In the paper
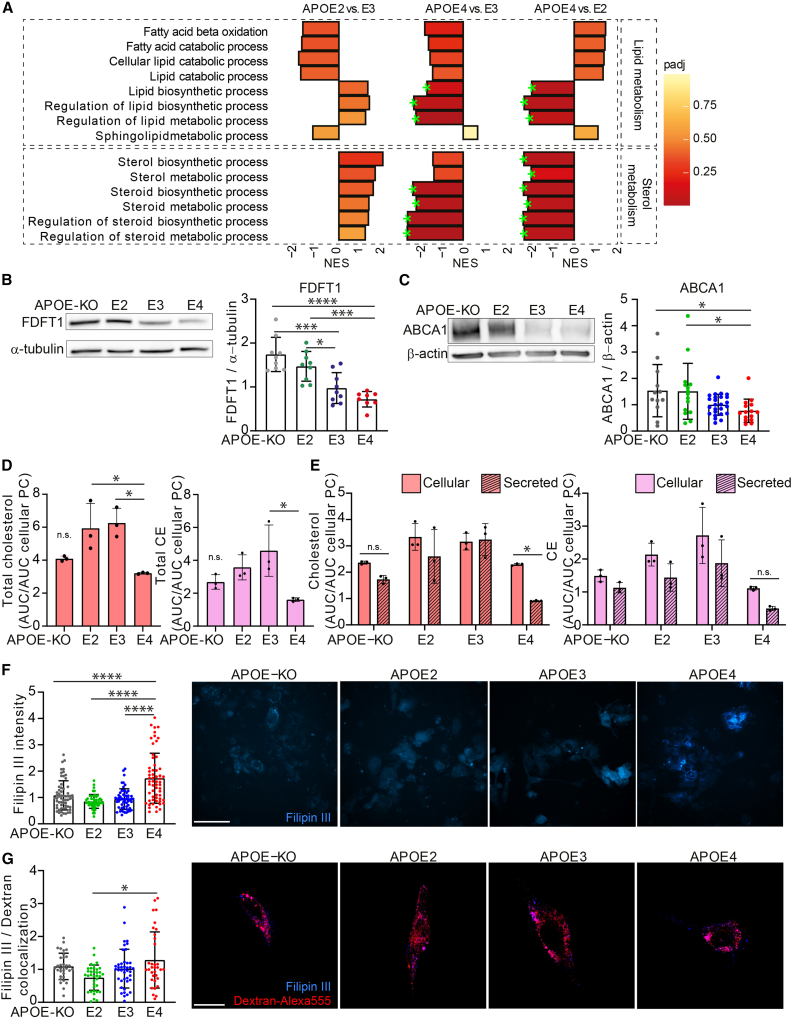
“Cellular PE showed higher levels in E2 and E4”
§ APOE2, E3, and E4 differentially modulate cellular homeostasis, cholesterol metabolism, and inflammatory response in isogenic iPSC-derived astrocytes > Results > Cholesterol and lipid metabolism show APOE allele-dependent regulation
plaincorrelational- Asserted: passes — The authors put it forward as true.
- Checkable: passes — It can be checked against evidence.
- Load-bearing: unclear — It is unclear whether the paper’s conclusions depend on it.
- Based: passes — The paper gives a reason why it holds.
A result the paper reports from its own data — it cites no other source for it, so there is none to check. The quote shows it is in the paper.
In the paper
“whereas cellular CEs were only significantly decreased in APOE4 compared with E3.”
§ APOE2, E3, and E4 differentially modulate cellular homeostasis, cholesterol metabolism, and inflammatory response in isogenic iPSC-derived astrocytes > Results > Cholesterol and lipid metabolism show APOE allele-dependent regulation
plaincorrelational- Asserted: passes — The authors put it forward as true.
- Checkable: passes — It can be checked against evidence.
- Load-bearing: unclear — It is unclear whether the paper’s conclusions depend on it.
- Based: passes — The paper gives a reason why it holds.
A result the paper reports from its own data — it cites no other source for it, so there is none to check. The quote shows it is in the paper.
In the paper
“Interestingly, APOE-KO cells showed the highest Aβ42 uptake capacity.”
§ APOE2, E3, and E4 differentially modulate cellular homeostasis, cholesterol metabolism, and inflammatory response in isogenic iPSC-derived astrocytes > Results > Homeostatic functions show APOE allele-dependent decline in iAstrocytes
plaincorrelational- Asserted: passes — The authors put it forward as true.
- Checkable: passes — It can be checked against evidence.
- Load-bearing: passes — The paper’s conclusions depend on it.
- Based: passes — The paper gives a reason why it holds.
A result the paper reports from its own data — it cites no other source for it, so there is none to check. The quote shows it is in the paper.
In the paper
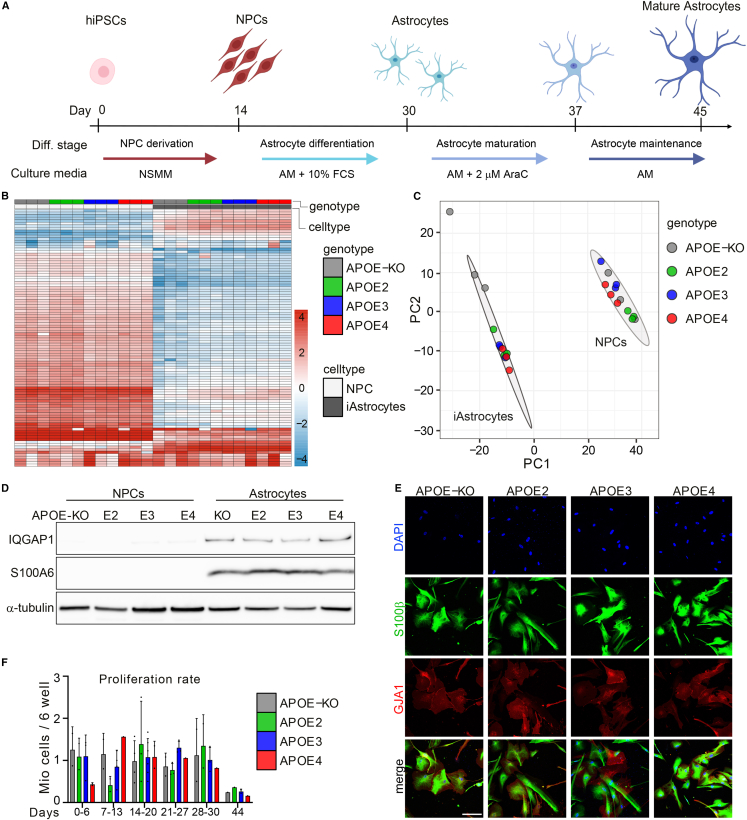
“We have therefore extended this method by withdrawing FCS and adding cytosine arabinoside (AraC) to the medium at day 30, for 7 days, followed by another 7 days of AM without FCS and AraC, taking a total of 44 days and generating mature and quiescent iAstrocytes (Figures 1A and 1F).”
§ APOE2, E3, and E4 differentially modulate cellular homeostasis, cholesterol metabolism, and inflammatory response in isogenic iPSC-derived astrocytes > Results > Robust differentiation of quiescent iAstrocytes from iPSC-derived neural progenitor cells
plaindirect- Asserted: passes — The authors put it forward as true.
- Checkable: passes — It can be checked against evidence.
- Load-bearing: passes — The paper’s conclusions depend on it.
- Based: passes — The paper gives a reason why it holds.
A result the paper reports from its own data — it cites no other source for it, so there is none to check. The quote shows it is in the paper.
In the paper
“Principal component analysis (PCA) showed separate clustering of NPCs and iAstrocytes, indicating all APOE-isogenic lines were successfully differentiated from NPCs to iAstrocytes (Figure 1C).”
§ APOE2, E3, and E4 differentially modulate cellular homeostasis, cholesterol metabolism, and inflammatory response in isogenic iPSC-derived astrocytes > Results > Robust differentiation of quiescent iAstrocytes from iPSC-derived neural progenitor cells
hedgedcorrelational- Asserted: passes — The authors put it forward as true.
- Checkable: passes — It can be checked against evidence.
- Load-bearing: passes — The paper’s conclusions depend on it.
- Based: passes — The paper gives a reason why it holds.
A result the paper reports from its own data — it cites no other source for it, so there is none to check. The quote shows it is in the paper.
In the paper
“Western blot analysis confirmed that these proteins were allele-dependently regulated (KO = E2 > E3 > E4) (Figures 3B and 3C).”
§ APOE2, E3, and E4 differentially modulate cellular homeostasis, cholesterol metabolism, and inflammatory response in isogenic iPSC-derived astrocytes > Results > Cholesterol and lipid metabolism show APOE allele-dependent regulation
boostedcorrelational- Asserted: passes — The authors put it forward as true.
- Checkable: passes — It can be checked against evidence.
- Load-bearing: passes — The paper’s conclusions depend on it.
- Based: passes — The paper gives a reason why it holds.
- Rests on an assumption: ABCA1 is essential for lipid and cholesterol efflux, as well as for APOE lipidation.
A result the paper reports from its own data — it cites no other source for it, so there is none to check. The quote shows it is in the paper.
In the paper
“Interestingly, secreted cholesterol and CE were significantly decreased only in APOE4 iAstrocytes (Figures S2A and S2B).”
§ APOE2, E3, and E4 differentially modulate cellular homeostasis, cholesterol metabolism, and inflammatory response in isogenic iPSC-derived astrocytes > Results > Cholesterol and lipid metabolism show APOE allele-dependent regulation
plaincorrelational- Asserted: passes — The authors put it forward as true.
- Checkable: passes — It can be checked against evidence.
- Load-bearing: passes — The paper’s conclusions depend on it.
- Based: passes — The paper gives a reason why it holds.
- Probably not a substantial claim. 28
- It may state two separate claims as one. 77
The cited sources support only part of this claim — read each source’s verdict below.
In the paper
“APOE is known to affect many functional aspects of astrocytes, including, but not limited to, homeostatic support such as uptake of glutamate as well as uptake and degradation of Aβ, as shown in mouse models (Verghese et al., 2013).”
§ APOE2, E3, and E4 differentially modulate cellular homeostasis, cholesterol metabolism, and inflammatory response in isogenic iPSC-derived astrocytes > Results > Homeostatic functions show APOE allele-dependent decline in iAstrocytes
What the sources say
- Partly supportedcites Verghese et al., 2013 sourceExperimental — accuracy not yet measured
The Significance section (page not provided) states that apoE isoforms affect Aβ uptake and subsequent degradation in astrocytes, and reports Aβ-clearance findings in a mouse model. The cited paper does not address astrocytic glutamate uptake, so it supports only the Aβ portion of the claim. (LLM, conf=0.88)
boosteddirect- Asserted: passes — The authors put it forward as true.
- Checkable: passes — It can be checked against evidence.
- Load-bearing: fails — The paper’s conclusions may not depend on it.
- Based: passes — The paper gives a reason why it holds.
Probably not a substantial claim. The paper’s conclusions may not depend on it.
- Partly supported
The cited sources support only part of this claim — read each source’s verdict below.
In the paper
“The Cys112 residue in APOE2 reduces its receptor binding capacity, congruent with the increased levels of lipoproteins in plasma, leading to hyperlipidemia III (Fernandez et al., 2019).”
§ APOE2, E3, and E4 differentially modulate cellular homeostasis, cholesterol metabolism, and inflammatory response in isogenic iPSC-derived astrocytes > Introduction
What the sources say
- Partly supportedcites Fernandez et al., 2019 sourceExperimental — accuracy not yet measured
In “Overview of APOE Isoforms,” the paper links impaired APOE2 receptor binding to delayed lipoprotein clearance and hyperlipoproteinemia III, characterized by accumulated plasma lipoproteins. But its Figure 1 description attributes deficient receptor binding to Cys158, not Cys112; it says Cys112 is present in both APOE2 and APOE3. (LLM, conf=0.90)
plaindirect- Asserted: passes — The authors put it forward as true.
- Checkable: passes — It can be checked against evidence.
- Load-bearing: fails — The paper’s conclusions may not depend on it.
- Based: passes — The paper gives a reason why it holds.
Probably not a substantial claim. The paper’s conclusions may not depend on it. It may state two separate claims as one.
- Partly supported
Every source the paper cites for this claim was checked and supports it.
In the paper
“APOE mainly exists in three allelic variants, APOE2, E3, and E4, which differ in a single amino acid change at position 112 or 158: APOE2 (Cys112, Cys158), APOE3 (Cys112, Arg158), and APOE4 (Arg112, Arg158) (Liu et al., 2013).”
§ APOE2, E3, and E4 differentially modulate cellular homeostasis, cholesterol metabolism, and inflammatory response in isogenic iPSC-derived astrocytes > Introduction
What the sources say
- Supportedcites Liu et al., 2013 source
The Introduction identifies the three ApoE isoforms and gives exactly the stated cysteine/arginine combinations at positions 112 and 158. It also says the isoforms differ by a single amino acid at these positions. (LLM, conf=0.95)
plain- Asserted: passes — The authors put it forward as true.
- Checkable: passes — It can be checked against evidence.
- Load-bearing: passes — The paper’s conclusions depend on it.
- Based: passes — The paper gives a reason why it holds.
Probably not a substantial claim. It may state two separate claims as one.
- Supported
The cited sources support only part of this claim — read each source’s verdict below.
In the paper
“Isogenic APOE iPSCs were obtained from the European Bank for Induced Pluripotent Stem Cells (EBiSC), and show mono-allelic expression of APOE, or APOE deletion (Schmid et al., 2019, 2020).”
§ APOE2, E3, and E4 differentially modulate cellular homeostasis, cholesterol metabolism, and inflammatory response in isogenic iPSC-derived astrocytes > Results > Robust differentiation of quiescent iAstrocytes from iPSC-derived neural progenitor cells
What the sources say
- Partly supportedcites Schmid et al., 2019 sourceExperimental — accuracy not yet measured
The Resource table identifies the isogenic APOE iPSC lines as EBiSC resources, and Resource details describes homozygous APOE-ε2/ε2, ε3/ε3 and ε4/ε4 lines plus an APOE knock-out line. The characterization passage confirms the knock-out lacks ApoE protein. None of these passages establishes mono-allelic APOE expression; a homozygous genotype does not by itself demonstrate expression from only one allele. (LLM, conf=0.87)
- Not checked — no full text of the sourcecites Schmid et al., 2020 source
plain- Asserted: passes — The authors put it forward as true.
- Checkable: passes — It can be checked against evidence.
- Load-bearing: passes — The paper’s conclusions depend on it.
- Based: passes — The paper gives a reason why it holds.
It may state two separate claims as one.
- Partly supported
Every source the paper cites for this claim was checked and supports it.
In the paper
“In turn, APOE aids in cholesterol and lipid efflux from the cell by associating with lipoprotein particles upon formation (Mahley, 2016).”
§ APOE2, E3, and E4 differentially modulate cellular homeostasis, cholesterol metabolism, and inflammatory response in isogenic iPSC-derived astrocytes > Introduction
What the sources say
- Supportedcites Mahley, 2016 source
The ‘Role of ABCA1 in HDL Formation’ section states that, in the CNS, cholesterol flows out of cells to apoE as HDL-like apoE-containing particles form. The ‘ApoE4 Structure Targets It for Degradation and Decreased Lipid Transport’ section also describes apoE-associated particles and cholesterol and phospholipid release. The provided passages do not give page numbers. (LLM, conf=0.90)
plaindirect- Asserted: passes — The authors put it forward as true.
- Checkable: passes — It can be checked against evidence.
- Load-bearing: fails — The paper’s conclusions may not depend on it.
- Based: passes — The paper gives a reason why it holds.
Probably not a substantial claim. The paper’s conclusions may not depend on it.
- Supported
The cited sources support only part of this claim — read each source’s verdict below.
In the paper
“This protein is vital in facilitating cholesterol efflux and is upregulated in a positive feedback loop via liver X receptor (LXR), or LXR-independent cholesterol efflux, as well as APOE lipidation and production of cholesterol-rich high-density lipoprotein (HDL) particles (Fan et al., 2018).”
§ APOE2, E3, and E4 differentially modulate cellular homeostasis, cholesterol metabolism, and inflammatory response in isogenic iPSC-derived astrocytes > Discussion > Lipid and cholesterol metabolism and the endolysosomal system
What the sources say
- Partly supportedcites Fan et al., 2018 sourceExperimental — accuracy not yet measured
The Introduction (p. 830) describes ABCA1-mediated cholesterol efflux and apoE lipidation, and p. 831 says LXR regulates ABCA1. But the paper does not describe a positive-feedback loop or establish production of cholesterol-rich HDL particles; its Results (p. 834) examine apoE-containing lipoproteins. The Discussion (p. 840) says the tested compounds require LXR activity to induce ABCA1 and apoE, despite not binding LXR directly, so their effects do not establish LXR-independent efflux. (LLM, conf=0.90)
plaindirect- Asserted: passes — The authors put it forward as true.
- Checkable: passes — It can be checked against evidence.
- Load-bearing: fails — The paper’s conclusions may not depend on it.
- Based: passes — The paper gives a reason why it holds.
Probably not a substantial claim. The paper’s conclusions may not depend on it. It may state two separate claims as one.
- Partly supported
Every source the paper cites for this claim was checked and supports it.
In the paper
“Another study showed that APOE4 and ABCA1 co-aggregate, reducing ABCA1 recycling to the membrane (Rawat et al., 2019).”
§ APOE2, E3, and E4 differentially modulate cellular homeostasis, cholesterol metabolism, and inflammatory response in isogenic iPSC-derived astrocytes > Discussion > Lipid and cholesterol metabolism and the endolysosomal system
What the sources say
- Supportedcites Rawat et al., 2019 source
The Discussion reports greater ApoE and ABCA1 coaggregation alongside reduced ABCA1 recycling to the cell membrane in ApoE4 conditions. The Abstract likewise states that aggregated ApoE4 increases ABCA1 aggregation and decreases its membrane recycling. (LLM, conf=0.93)
plaindirect- Asserted: passes — The authors put it forward as true.
- Checkable: passes — It can be checked against evidence.
- Load-bearing: unclear — It is unclear whether the paper’s conclusions depend on it.
- Based: passes — The paper gives a reason why it holds.
It may state two separate claims as one.
- Supported
The cited sources support only part of this claim — read each source’s verdict below.
In the paper
“Previous research on humanized APOE mice showed reduced glutamine levels, and reduced capacity to incorporate glutamate into the brain of APOE 4TR mice, while glutamate transporters were not significantly changed (Dumanis et al., 2013).”
§ APOE2, E3, and E4 differentially modulate cellular homeostasis, cholesterol metabolism, and inflammatory response in isogenic iPSC-derived astrocytes > Discussion > Homeostatic functions: clearance and metabolism
What the sources say
- Partly supportedcites Dumanis et al., 2013 sourceExperimental — accuracy not yet measured
The Results section reports lower glutamate levels and lower incorporation of a glucose-derived 13C label into glutamate in APOE-ε4 TR mice, but it reports significantly higher—not reduced—glutamine levels. The Abstract says glutamate uptake transporters were unchanged; it also reports an increase in the vesicular glutamate transporter VGLUT1, so the claim is too broad about transporters. Page numbers were not provided in our copy. (LLM, conf=0.88)
plaindirect- Asserted: passes — The authors put it forward as true.
- Checkable: passes — It can be checked against evidence.
- Load-bearing: fails — The paper’s conclusions may not depend on it.
- Based: passes — The paper gives a reason why it holds.
Probably not a substantial claim. The paper’s conclusions may not depend on it. It may state two separate claims as one.
- Partly supported
Every source the paper cites for this claim was checked and supports it.
In the paper
“V-ATPase-regulated proton transport into the lysosomal lumen is crucial to maintaining the acidic pH, and defective acidification has been linked to AD or Parkinson disease (Colacurcio et al., 2018).”
§ APOE2, E3, and E4 differentially modulate cellular homeostasis, cholesterol metabolism, and inflammatory response in isogenic iPSC-derived astrocytes > Results > Lysosomal but not endosomal function is affected by APOE genotype
What the sources say
- Supportedcites Colacurcio et al., 2018 source
In “Lysosomal acidification defects in autophagic dysfunction during AD and DS” (page not provided), the paper identifies v-ATPase as the proton pump primarily responsible for lysosomal acidification. The same passage says lysosomal acidification defects have been implicated in Alzheimer’s disease and Parkinson disease. (LLM, conf=0.94)
plaincorrelational- Asserted: passes — The authors put it forward as true.
- Checkable: passes — It can be checked against evidence.
- Load-bearing: fails — The paper’s conclusions may not depend on it.
- Based: passes — The paper gives a reason why it holds.
Probably not a substantial claim. The paper’s conclusions may not depend on it. It may state two separate claims as one.
- Supported
The cited sources support only part of this claim — read each source’s verdict below.
In the paper
“APOE4 also interacts with insulin receptors and other transporters, relocating them to the endosomal compartment: a similar mechanism may also affect excitatory amino acid transporter (EAAT) and glutamate/aspartate transporter (GLAST) surface expression, ultimately decreasing glutamate uptake capacity in the APOE4 iAstrocytes (Yassine and Finch, 2020).”
§ APOE2, E3, and E4 differentially modulate cellular homeostasis, cholesterol metabolism, and inflammatory response in isogenic iPSC-derived astrocytes > Discussion > Homeostatic functions: clearance and metabolism
What the sources say
- Partly supportedcites Yassine and Finch, 2020 sourceExperimental — accuracy not yet measured
Split into 2 atoms — 1 confirmed, 1 partially supported, 0 disputed, 0 misattributed, 0 unverifiable. Expand the claim to see per-atom verdicts.
hedgedconditional- Asserted: passes — The authors put it forward as true.
- Checkable: passes — It can be checked against evidence.
- Load-bearing: fails — The paper’s conclusions may not depend on it.
- Based: passes — The paper gives a reason why it holds.
Probably not a substantial claim. The paper’s conclusions may not depend on it. It may state two separate claims as one.
- Partly supported
The cited sources that could be checked couldn’t confirm or dispute this claim.
In the paper
“Astrocytes play a pivotal homeostatic role in the brain, providing neural cells with cell membrane components such as lipids and cholesterol, taking up excess of neurotransmitters at the tripartite synapse to prevent excitotoxicity, and phagocytosing cellular debris and waste, alongside microglia (Zorec et al., 2017).”
§ APOE2, E3, and E4 differentially modulate cellular homeostasis, cholesterol metabolism, and inflammatory response in isogenic iPSC-derived astrocytes > Discussion > Homeostatic functions: clearance and metabolism
What the sources say
- Could not verifycites Zorec et al., 2017 sourceExperimental — accuracy not yet measured
No passage from our copy matched the claim. Searches for astrocyte homeostasis, cholesterol and lipid supply, glutamate uptake, and phagocytosis returned no passages, so the attributed functions cannot be verified from this copy. (LLM, conf=0.70)
plain- Asserted: passes — The authors put it forward as true.
- Checkable: passes — It can be checked against evidence.
- Load-bearing: fails — The paper’s conclusions may not depend on it.
- Based: passes — The paper gives a reason why it holds.
Probably not a substantial claim. The paper’s conclusions may not depend on it. It may state two separate claims as one.
- Could not verify
The cited sources support only part of this claim — read each source’s verdict below.
In the paper
“iPSC lines were purchased from EBiSC (BIONi010-C-2, -C-3, C-4, and -C-6), harboring a single APOE2, APOE3, or APOE4 allele generated using CRISPR, or an APOE-KO generated by an insertion-deletion mutation in exon 2 (Schmid et al., 2019, 2020).”
§ APOE2, E3, and E4 differentially modulate cellular homeostasis, cholesterol metabolism, and inflammatory response in isogenic iPSC-derived astrocytes > Experimental procedures > Cells
What the sources say
- Partly supportedcites Schmid et al., 2019 sourceExperimental — accuracy not yet measured
The Resource table identifies the four EBiSC lines, and Resource details reports CRISPR-generated APOE-ε2/ε2, ε3/ε3 and ε4/ε4 lines plus an APOE knockout with a frameshift in exon 2. The variant lines are homozygous, not single-copy APOE allele lines. The paper describes deleting part of exon 2 but does not specify an insertion-deletion mutation. (LLM, conf=0.86)
- Not checked — no full text of the sourcecites Schmid et al., 2020 source
plain- Asserted: passes — The authors put it forward as true.
- Checkable: passes — It can be checked against evidence.
- Load-bearing: passes — The paper’s conclusions depend on it.
- Based: passes — The paper gives a reason why it holds.
It may state two separate claims as one.
- Partly supported
The cited sources support only part of this claim — read each source’s verdict below.
In the paper
“in line with a study showing dysfunction in TGF-β signaling in models of early AD and in human AD brain (Tesseur et al., 2006), likely connected to its neuroprotective role.”
§ APOE2, E3, and E4 differentially modulate cellular homeostasis, cholesterol metabolism, and inflammatory response in isogenic iPSC-derived astrocytes > Discussion > Cholesterol metabolism and inflammatory regulation
What the sources say
- Partly supportedcites Tesseur et al., 2006 sourceExperimental — accuracy not yet measured
The Discussion reports reduced TGF-β receptor levels in human AD brain, including mild AD, and links impaired neuronal signaling to neurodegeneration in mouse models. It also proposes that increasing neuronal TGF-β signaling could be protective. The paper does not establish that TGF-β signaling is downregulated specifically in APOE4, so that part of the claim is unsupported. (LLM, conf=0.88)
hedgedconditional- Asserted: passes — The authors put it forward as true.
- Checkable: passes — It can be checked against evidence.
- Load-bearing: fails — The paper’s conclusions may not depend on it.
- Based: passes — The paper gives a reason why it holds.
Probably not a substantial claim. The paper’s conclusions may not depend on it.
- Partly supported
Every source the paper cites for this claim was checked and supports it.
In the paper
“TCW and colleagues have shown activation of astrocytes by treatment with Aβ42 peptide.”
§ APOE2, E3, and E4 differentially modulate cellular homeostasis, cholesterol metabolism, and inflammatory response in isogenic iPSC-derived astrocytes > Discussion
What the sources say
- Supportedcites TCW et al., 2017 source
In Results, under “hiPSC-Astrocytes Secrete Cytokines in Response to Inflammatory Stimuli,” the authors report that Aβ42 treatment increased IL-6 secretion in control hiPSC-derived astrocytes. They also report increased IL-8 secretion after treatment, supporting the claim of an inflammatory astrocyte response to Aβ42. (LLM, conf=0.93)
plaindirect- Asserted: passes — The authors put it forward as true.
- Checkable: passes — It can be checked against evidence.
- Load-bearing: fails — The paper’s conclusions may not depend on it.
- Based: passes — The paper gives a reason why it holds.
Probably not a substantial claim. The paper’s conclusions may not depend on it.
- Supported
The cited sources support only part of this claim — read each source’s verdict below.
In the paper
“It is known that a decrease in LAMP2 levels causes a lack of lysosomal trafficking and decrease in autophagic flux (Cui et al., 2020).”
§ APOE2, E3, and E4 differentially modulate cellular homeostasis, cholesterol metabolism, and inflammatory response in isogenic iPSC-derived astrocytes > Discussion > Lipid and cholesterol metabolism and the endolysosomal system
What the sources say
- Partly supportedcites Cui et al., 2020 sourceExperimental — accuracy not yet measured
The Discussion reports that Lamp2 knockdown blocked autophagic flux, and the Results show that Lamp2 restoration improved trafficking of the lysosomal cathepsins Cat B and Cat D. The paper does not establish that decreased Lamp2 causes a complete lack of lysosomal trafficking generally; its trafficking finding concerns those cathepsins in ischemic cardiomyocytes. (LLM, conf=0.83)
boosteddirect- Asserted: passes — The authors put it forward as true.
- Checkable: passes — It can be checked against evidence.
- Load-bearing: fails — The paper’s conclusions may not depend on it.
- Based: passes — The paper gives a reason why it holds.
Probably not a substantial claim. The paper’s conclusions may not depend on it. It may state two separate claims as one.
- Partly supported
The cited sources support only part of this claim — read each source’s verdict below.
In the paper
“APOE4-bound cholesterol, taken up by the cell, is released from the receptor in the late endosome or lysosome, and aggregation of APOE4 has been shown to cause endosomal congestion and dysfunction (Narayan et al., 2020; Nuriel et al., 2017; Rawat et al., 2019).”
§ APOE2, E3, and E4 differentially modulate cellular homeostasis, cholesterol metabolism, and inflammatory response in isogenic iPSC-derived astrocytes > Discussion > Lipid and cholesterol metabolism and the endolysosomal system
What the sources say
- Partly supportedcites Narayan et al., 2020 sourceExperimental — accuracy not yet measured
The Results section on iPSC-derived astrocytes reports that APOE4 disrupts early endocytosis, supporting the general claim of endocytic dysfunction. It does not describe APOE4-bound cholesterol being released from a receptor in late endosomes or lysosomes. The yeast-model Results section instead reports that APOE4 did not accumulate in protein aggregates and that the observed defects were not a response to aggregation. Page numbers were not available in our copy. (LLM, conf=0.88)
- Partly supportedcites Nuriel et al., 2017 sourceExperimental — accuracy not yet measured
The Discussion reports that APOE4 expression causes endosomal–lysosomal dysregulation and enlarged early endosomes in aged mice. It does not show that APOE4 aggregation causes this dysfunction, or describe receptor release of APOE4-bound cholesterol in late endosomes or lysosomes. The Introduction discusses aggregation of Aβ, not aggregation of APOE4. (LLM, conf=0.87)
- Partly supportedcites Rawat et al., 2019 sourceExperimental — accuracy not yet measured
The Discussion (page unavailable) describes aggregated ApoE4 in acidic endosomes as a possible mechanism for endosomal congestion and reports impaired ApoE4 recycling. It does not establish that aggregation causes endosomal congestion and dysfunction, or describe APOE4-bound cholesterol being released from a receptor in a late endosome or lysosome. (LLM, conf=0.86)
plaindirect- Asserted: passes — The authors put it forward as true.
- Checkable: passes — It can be checked against evidence.
- Load-bearing: passes — The paper’s conclusions depend on it.
- Based: passes — The paper gives a reason why it holds.
It may state two separate claims as one.
- Partly supported
The cited sources support only part of this claim — read each source’s verdict below.
In the paper
“Our iAstrocytes drastically changed morphology from day 30 (with FCS) to day 44 (without FCS), and show an increased membrane incorporation of gap junction protein GJA1, which is an indication of mature, adult astrocytes (Liang et al., 2020).”
§ APOE2, E3, and E4 differentially modulate cellular homeostasis, cholesterol metabolism, and inflammatory response in isogenic iPSC-derived astrocytes > Discussion
What the sources say
- Partly supportedcites Liang et al., 2020 sourceExperimental — accuracy not yet measured
The ‘Structure and Distribution of Cx43’ section identifies Cx43 as a major gap-junction protein in astrocytes and describes its presence on astrocytic membranes in the adult mammalian brain. It does not say that increased membrane incorporation indicates astrocyte maturity. The day-30-to-day-44 observations are the citing authors’ own findings, not findings attributed to Liang et al. (LLM, conf=0.83)
hedgeddirect- Asserted: passes — The authors put it forward as true.
- Checkable: passes — It can be checked against evidence.
- Load-bearing: passes — The paper’s conclusions depend on it.
- Based: passes — The paper gives a reason why it holds.
It may state two separate claims as one.
- Partly supported
A result the paper reports from its own data — it cites no other source for it, so there is none to check. The quote shows it is in the paper.
In the paper
“A flow-cytometry-based Aβ42 uptake assay, using pre-aggregated Hilyte488-tagged Aβ42, showed an allele-dependent trend in uptake capacity (KO > E2 > E3 ≥ E4), although differences between APOE3 and APOE4 did not reach significance (p = 0.054) (Figure 2F).”
§ APOE2, E3, and E4 differentially modulate cellular homeostasis, cholesterol metabolism, and inflammatory response in isogenic iPSC-derived astrocytes > Results > Homeostatic functions show APOE allele-dependent decline in iAstrocytes
plaincorrelational- Asserted: passes — The authors put it forward as true.
- Checkable: passes — It can be checked against evidence.
- Load-bearing: passes — The paper’s conclusions depend on it.
- Based: passes — The paper gives a reason why it holds.
It may state two separate claims as one.
A result the paper reports from its own data — it cites no other source for it, so there is none to check. The quote shows it is in the paper.
In the paper
“To investigate APOE-related phenotypes in isogenic iAstrocytes, proteomic analysis of APOE2, APOE3, and APOE4 iAstrocytes was performed showing most differently regulated proteins (fold change above 1 or below −1) between APOE2 and APOE4 (173), less between APOE2 and APOE3 (130), and least between APOE4 and APOE3 (72) (Figure 2A).”
§ APOE2, E3, and E4 differentially modulate cellular homeostasis, cholesterol metabolism, and inflammatory response in isogenic iPSC-derived astrocytes > Results > Homeostatic functions show APOE allele-dependent decline in iAstrocytes
plaincorrelational- Asserted: passes — The authors put it forward as true.
- Checkable: passes — It can be checked against evidence.
- Load-bearing: passes — The paper’s conclusions depend on it.
- Based: passes — The paper gives a reason why it holds.
It may state two separate claims as one.
A result the paper reports from its own data — it cites no other source for it, so there is none to check. The quote shows it is in the paper.
In the paper
“We analyzed APOE levels in iAstrocytes that were regulated in isoform-dependent manner (E2 > E3 > E4), and absent in APOE-KO iAstrocytes (Figures 2B and 2C).”
§ APOE2, E3, and E4 differentially modulate cellular homeostasis, cholesterol metabolism, and inflammatory response in isogenic iPSC-derived astrocytes > Results > Homeostatic functions show APOE allele-dependent decline in iAstrocytes
plaindirect- Asserted: passes — The authors put it forward as true.
- Checkable: passes — It can be checked against evidence.
- Load-bearing: passes — The paper’s conclusions depend on it.
- Based: passes — The paper gives a reason why it holds.
It may state two separate claims as one.
A result the paper reports from its own data — it cites no other source for it, so there is none to check. The quote shows it is in the paper.
In the paper
“Uptake of glutamate in iAstrocytes demonstrated an allele-dependent effect, with APOE4 iAstrocytes taking up the lowest amount of glutamate while APOE2 and APOE-KO took up the highest amounts (Figure 2D).”
- Also stated in: § Homeostatic functions: clearance and metabolism · plain
“We show that APOE has an allele-dependent effect on glutamate uptake. APOE-KO and APOE2 showed similar uptake capacity, whereas APOE3 and APOE4 iAstrocytes displayed lowest uptake.”
§ APOE2, E3, and E4 differentially modulate cellular homeostasis, cholesterol metabolism, and inflammatory response in isogenic iPSC-derived astrocytes > Results > Homeostatic functions show APOE allele-dependent decline in iAstrocytes
boostedcorrelational- Asserted: passes — The authors put it forward as true.
- Checkable: passes — It can be checked against evidence.
- Load-bearing: passes — The paper’s conclusions depend on it.
- Based: passes — The paper gives a reason why it holds.
It may state two separate claims as one.
- Also stated in: § Homeostatic functions: clearance and metabolism · plain
A result the paper reports from its own data — it cites no other source for it, so there is none to check. The quote shows it is in the paper.
In the paper
“Gene set enrichment analysis (GSEA) of proteomic data showed significant downregulation of pathways involved in lipid biosynthesis/metabolism and sterol biosynthesis/metabolism in APOE4 compared with APOE3 or APOE2 iAstrocytes, while these were upregulated in APOE2 compared with APOE3 (Figure 3A).”
- Also stated in: § Abstract · plain
“Mass-spectrometry-based proteomic analysis showed genotype-dependent reductions of cholesterol and lipid metabolic and biosynthetic pathways (reduction: APOE4 > E3 > E2).”
§ APOE2, E3, and E4 differentially modulate cellular homeostasis, cholesterol metabolism, and inflammatory response in isogenic iPSC-derived astrocytes > Results > Cholesterol and lipid metabolism show APOE allele-dependent regulation
plaincorrelational- Asserted: passes — The authors put it forward as true.
- Checkable: passes — It can be checked against evidence.
- Load-bearing: passes — The paper’s conclusions depend on it.
- Based: passes — The paper gives a reason why it holds.
It may state two separate claims as one.
- Also stated in: § Abstract · plain
A result the paper reports from its own data — it cites no other source for it, so there is none to check. The quote shows it is in the paper.
In the paper
“Among the astrocyte markers significantly upregulated in iAstrocytes were calcium binding protein S100A6 and Rho-ATPase IQGAP1, which were confirmed with western blot showing robust expression in iAstrocytes, and absence in NPCs (Figure 1D).”
§ APOE2, E3, and E4 differentially modulate cellular homeostasis, cholesterol metabolism, and inflammatory response in isogenic iPSC-derived astrocytes > Results > Robust differentiation of quiescent iAstrocytes from iPSC-derived neural progenitor cells
plaincorrelational- Asserted: passes — The authors put it forward as true.
- Checkable: passes — It can be checked against evidence.
- Load-bearing: passes — The paper’s conclusions depend on it.
- Based: passes — The paper gives a reason why it holds.
It may state two separate claims as one.
A result the paper reports from its own data — it cites no other source for it, so there is none to check. The quote shows it is in the paper.
In the paper
“Quantification of LRP1 and VLDLR showed no significant difference, albeit a minor decrease of average LRP1 levels in APOE4 cells (Figures 2G and 2H).”
§ APOE2, E3, and E4 differentially modulate cellular homeostasis, cholesterol metabolism, and inflammatory response in isogenic iPSC-derived astrocytes > Results > Homeostatic functions show APOE allele-dependent decline in iAstrocytes
plain- Asserted: passes — The authors put it forward as true.
- Checkable: passes — It can be checked against evidence.
- Load-bearing: unclear — It is unclear whether the paper’s conclusions depend on it.
- Based: passes — The paper gives a reason why it holds.
It may state two separate claims as one.
A result the paper reports from its own data — it cites no other source for it, so there is none to check. The quote shows it is in the paper.
In the paper
“Unlabeled mass spectrometry (MS)-based proteomic analysis of iAstrocytes and NPCs from four different genotypes (APOE2, APOE3, APOE4, and APOE-KO; Figure S1A) resulted in a total of 3,765 detected proteins, of which the majority, 2,432 proteins, were differentially expressed in iAstrocytes compared with NPCs (false discovery rate [FDR] <0.1)”
§ APOE2, E3, and E4 differentially modulate cellular homeostasis, cholesterol metabolism, and inflammatory response in isogenic iPSC-derived astrocytes > Results > Robust differentiation of quiescent iAstrocytes from iPSC-derived neural progenitor cells
plain- Asserted: passes — The authors put it forward as true.
- Checkable: passes — It can be checked against evidence.
- Load-bearing: passes — The paper’s conclusions depend on it.
- Based: passes — The paper gives a reason why it holds.
It may state two separate claims as one.
A result the paper reports from its own data — it cites no other source for it, so there is none to check. The quote shows it is in the paper.
In the paper
“Immunocytochemical analysis of mature astrocyte markers, calcium binding protein S100β, and gap junction protein GJA1 showed all cells being positive at day 44 (Figure 1E), as well as for intermediate filament protein GFAP (Figure S1B).”
§ APOE2, E3, and E4 differentially modulate cellular homeostasis, cholesterol metabolism, and inflammatory response in isogenic iPSC-derived astrocytes > Results > Robust differentiation of quiescent iAstrocytes from iPSC-derived neural progenitor cells
plain- Asserted: passes — The authors put it forward as true.
- Checkable: passes — It can be checked against evidence.
- Load-bearing: passes — The paper’s conclusions depend on it.
- Based: passes — The paper gives a reason why it holds.
It may state two separate claims as one.
A result the paper reports from its own data — it cites no other source for it, so there is none to check. The quote shows it is in the paper.
In the paper
“It should be noted that the three biological replicates of APOE-KO iAstrocytes are more dispersed in the PCA plot than the other genotypes, indicating higher variation in APOE-KO cells, and that we observed a substantially lower number of peptides and proteins in MS analysis.”
§ APOE2, E3, and E4 differentially modulate cellular homeostasis, cholesterol metabolism, and inflammatory response in isogenic iPSC-derived astrocytes > Results > Robust differentiation of quiescent iAstrocytes from iPSC-derived neural progenitor cells
plaincorrelational- Asserted: passes — The authors put it forward as true.
- Checkable: passes — It can be checked against evidence.
- Load-bearing: passes — The paper’s conclusions depend on it.
- Based: passes — The paper gives a reason why it holds.
It may state two separate claims as one.
A result the paper reports from its own data — it cites no other source for it, so there is none to check. The quote shows it is in the paper.
In the paper
“In line with the proteomic data, total as well as cellular and secreted cholesterol was decreased in APOE4 compared with APOE3 and APOE2 iAstrocytes, while showing similar levels to APOE-KO (E2 = E3 > E4 = KO) (Figures 3D, S2A, and S2B)”
§ APOE2, E3, and E4 differentially modulate cellular homeostasis, cholesterol metabolism, and inflammatory response in isogenic iPSC-derived astrocytes > Results > Cholesterol and lipid metabolism show APOE allele-dependent regulation
plaincorrelational- Asserted: passes — The authors put it forward as true.
- Checkable: passes — It can be checked against evidence.
- Load-bearing: passes — The paper’s conclusions depend on it.
- Based: passes — The paper gives a reason why it holds.
It may state two separate claims as one.
A result the paper reports from its own data — it cites no other source for it, so there is none to check. The quote shows it is in the paper.
In the paper
“We further show an allele-dependent effect on iAstrocyte homeostatic functions (KO = E2 > E3 > E4), where APOE2 closely resembled APOE-KO iAstrocytes.”
§ APOE2, E3, and E4 differentially modulate cellular homeostasis, cholesterol metabolism, and inflammatory response in isogenic iPSC-derived astrocytes > Results > Homeostatic functions show APOE allele-dependent decline in iAstrocytes
plaindirect- Asserted: passes — The authors put it forward as true.
- Checkable: passes — It can be checked against evidence.
- Load-bearing: passes — The paper’s conclusions depend on it.
- Based: passes — The paper gives a reason why it holds.
It may state two separate claims as one.
A result the paper reports from its own data — it cites no other source for it, so there is none to check. The quote shows it is in the paper.
In the paper
“Compared with iAstrocytes at day 44, cells on day 30 displayed a different morphology (Figures S1C and S1D); the latter were smaller and expressed most GJA1 in the cytosol, while GJA1 was prominently expressed on the cell surface on day 44, in addition to the significant increase in cell volume demonstrated in the S100β staining.”
§ APOE2, E3, and E4 differentially modulate cellular homeostasis, cholesterol metabolism, and inflammatory response in isogenic iPSC-derived astrocytes > Results > Robust differentiation of quiescent iAstrocytes from iPSC-derived neural progenitor cells
plaincorrelational- Asserted: passes — The authors put it forward as true.
- Checkable: passes — It can be checked against evidence.
- Load-bearing: unclear — It is unclear whether the paper’s conclusions depend on it.
- Based: passes — The paper gives a reason why it holds.
It may state two separate claims as one.
The paper states this without a source or data behind it here, so there is nothing to check it against. The quote shows it is in the paper.
In the paper
“In line with the extracellular lipoprotein-binding function of APOE, we observed a larger amount of APOE protein in the secreted fraction, where the difference between genotypes was higher than in the lysate.”
§ APOE2, E3, and E4 differentially modulate cellular homeostasis, cholesterol metabolism, and inflammatory response in isogenic iPSC-derived astrocytes > Results > Homeostatic functions show APOE allele-dependent decline in iAstrocytes
plaincorrelational- Asserted: passes — The authors put it forward as true.
- Checkable: passes — It can be checked against evidence.
- Load-bearing: unclear — It is unclear whether the paper’s conclusions depend on it.
- Based: passes — The paper gives a reason why it holds.
It may state two separate claims as one.
A result the paper reports from its own data — it cites no other source for it, so there is none to check. The quote shows it is in the paper.
In the paper
“Cholesterol and CEs showed an allele-dependent decrease in cellular content (E2 = E3 > E4 = KO) and efflux (E2 = E3 = KO > E4), in line with our proteomic findings.”
§ APOE2, E3, and E4 differentially modulate cellular homeostasis, cholesterol metabolism, and inflammatory response in isogenic iPSC-derived astrocytes > Discussion > Lipid and cholesterol metabolism and the endolysosomal system
plaincorrelational- Asserted: passes — The authors put it forward as true.
- Checkable: passes — It can be checked against evidence.
- Load-bearing: passes — The paper’s conclusions depend on it.
- Based: passes — The paper gives a reason why it holds.
It may state two separate claims as one.
A result the paper reports from its own data — it cites no other source for it, so there is none to check. The quote shows it is in the paper.
In the paper
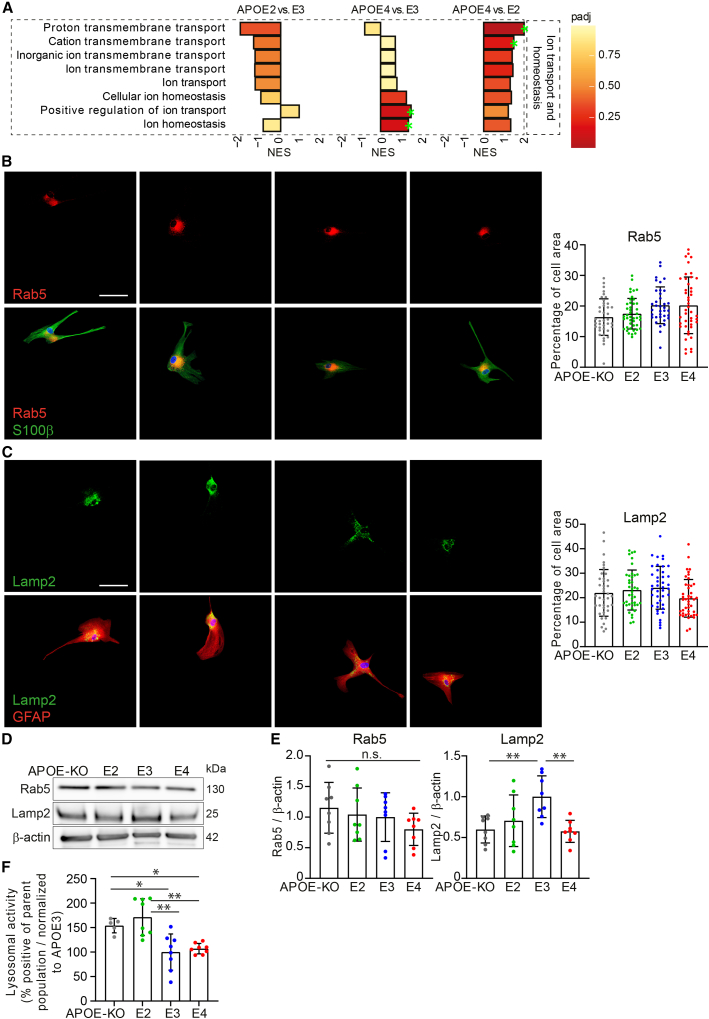
“Thus, no major abnormalities in endosomal and lysosomal compartment morphology were observed, while LAMP2 protein levels and lysosomal activity were affected by APOE genotype.”
§ APOE2, E3, and E4 differentially modulate cellular homeostasis, cholesterol metabolism, and inflammatory response in isogenic iPSC-derived astrocytes > Results > Lysosomal but not endosomal function is affected by APOE genotype
plaindirect- Asserted: passes — The authors put it forward as true.
- Checkable: passes — It can be checked against evidence.
- Load-bearing: passes — The paper’s conclusions depend on it.
- Based: passes — The paper gives a reason why it holds.
It may state two separate claims as one.
A result the paper reports from its own data — it cites no other source for it, so there is none to check. The quote shows it is in the paper.
In the paper
“Endosomal compartments labeled with RAB5 did not show a significant difference in percentage of cell area between genotypes, and neither did RAB5 protein levels (Figures 4B, 4D, and 4E).”
§ APOE2, E3, and E4 differentially modulate cellular homeostasis, cholesterol metabolism, and inflammatory response in isogenic iPSC-derived astrocytes > Results > Lysosomal but not endosomal function is affected by APOE genotype
plain- Asserted: passes — The authors put it forward as true.
- Checkable: passes — It can be checked against evidence.
- Load-bearing: passes — The paper’s conclusions depend on it.
- Based: passes — The paper gives a reason why it holds.
It may state two separate claims as one.
A result the paper reports from its own data — it cites no other source for it, so there is none to check. The quote shows it is in the paper.
In the paper
“Although we did not detect significant changes in RAB5 protein levels or cell area covered”
§ APOE2, E3, and E4 differentially modulate cellular homeostasis, cholesterol metabolism, and inflammatory response in isogenic iPSC-derived astrocytes > Discussion > Lipid and cholesterol metabolism and the endolysosomal system
plain- Asserted: passes — The authors put it forward as true.
- Checkable: passes — It can be checked against evidence.
- Load-bearing: unclear — It is unclear whether the paper’s conclusions depend on it.
- Based: passes — The paper gives a reason why it holds.
It may state two separate claims as one.
A result the paper reports from its own data — it cites no other source for it, so there is none to check. The quote shows it is in the paper.
In the paper
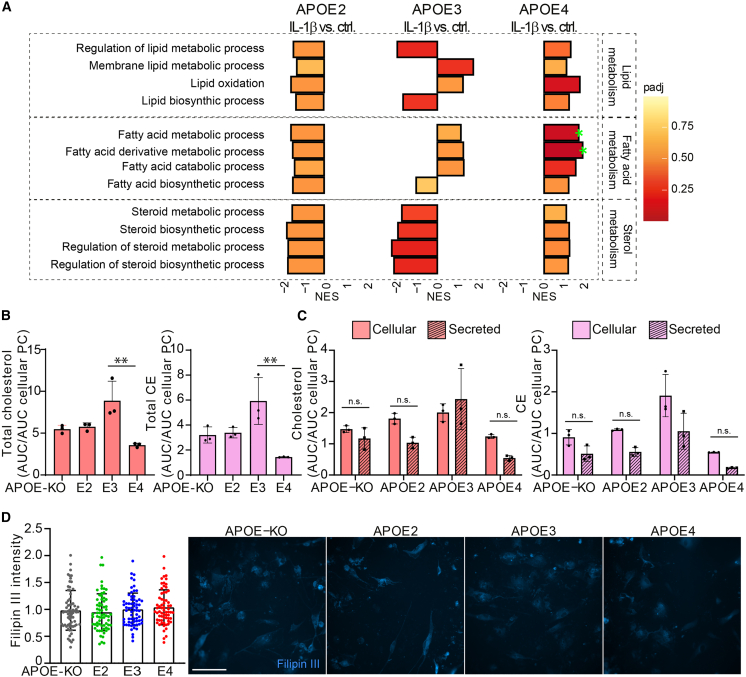
“Total cholesterol and CE were lowest in APOE4 and highest in APOE3 iAstrocytes (Figure 6B).”
§ APOE2, E3, and E4 differentially modulate cellular homeostasis, cholesterol metabolism, and inflammatory response in isogenic iPSC-derived astrocytes > Results > IL-1β treatment affects cholesterol and CE regulation
plaincorrelational- Asserted: passes — The authors put it forward as true.
- Checkable: passes — It can be checked against evidence.
- Load-bearing: passes — The paper’s conclusions depend on it.
- Based: passes — The paper gives a reason why it holds.
It may state two separate claims as one.
A result the paper reports from its own data — it cites no other source for it, so there is none to check. The quote shows it is in the paper.
In the paper
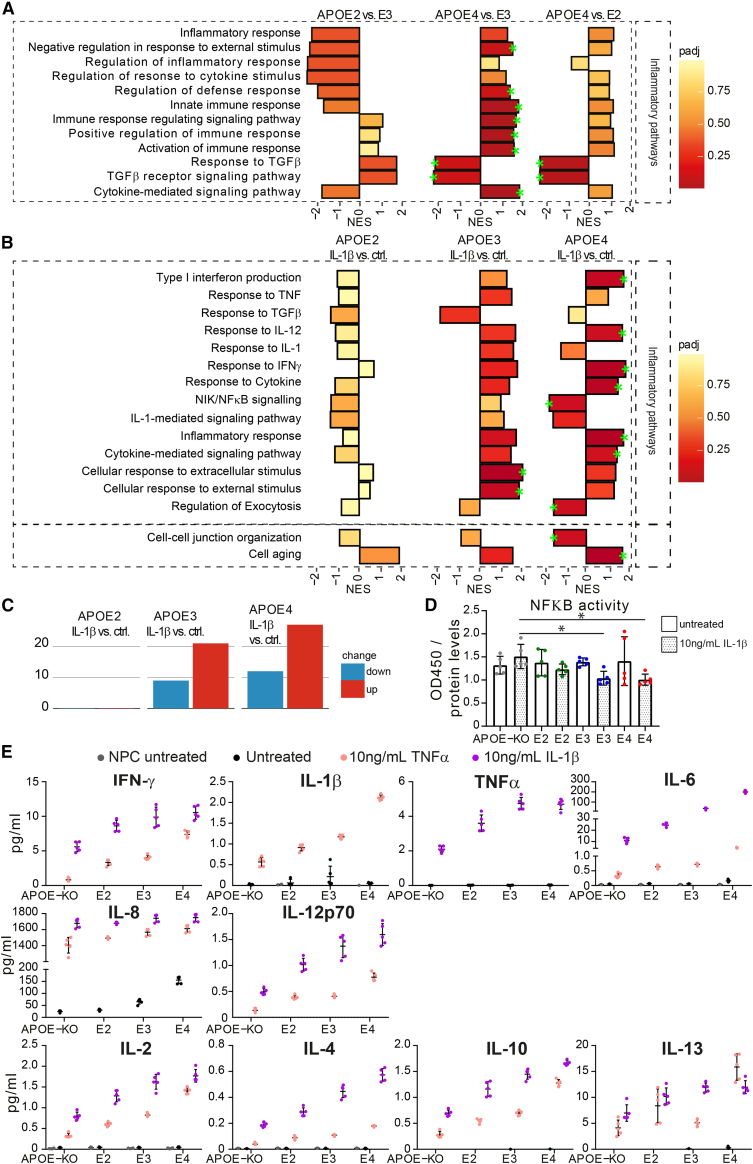
“Interestingly, IL-6 was increased upon stimulation, but also showed detectable levels at baseline in APOE4 iAstrocytes.”
§ APOE2, E3, and E4 differentially modulate cellular homeostasis, cholesterol metabolism, and inflammatory response in isogenic iPSC-derived astrocytes > Results > APOE genotype-dependent upregulation of inflammatory pathways and exacerbated cytokine release in IL-1β-treated iAstrocytes
plaindirect- Asserted: passes — The authors put it forward as true.
- Checkable: passes — It can be checked against evidence.
- Load-bearing: passes — The paper’s conclusions depend on it.
- Based: passes — The paper gives a reason why it holds.
It may state two separate claims as one.
A result the paper reports from its own data — it cites no other source for it, so there is none to check. The quote shows it is in the paper.
In the paper
“In APOE4 and APOE3 iAstrocytes, inflammatory pathways were predominantly upregulated after IL-1β treatment, while the opposite was found in APOE2 cells.”
§ APOE2, E3, and E4 differentially modulate cellular homeostasis, cholesterol metabolism, and inflammatory response in isogenic iPSC-derived astrocytes > Results > APOE genotype-dependent upregulation of inflammatory pathways and exacerbated cytokine release in IL-1β-treated iAstrocytes
plaindirect- Asserted: passes — The authors put it forward as true.
- Checkable: passes — It can be checked against evidence.
- Load-bearing: passes — The paper’s conclusions depend on it.
- Based: passes — The paper gives a reason why it holds.
It may state two separate claims as one.
The paper states this without a source or data behind it here, so there is nothing to check it against. The quote shows it is in the paper.
In the paper
“Further, iAstrocytes showed a reduced proliferation rate, providing evidence for a further progress into a mature, resting state.”
§ APOE2, E3, and E4 differentially modulate cellular homeostasis, cholesterol metabolism, and inflammatory response in isogenic iPSC-derived astrocytes > Discussion
plaincorrelational- Asserted: passes — The authors put it forward as true.
- Checkable: passes — It can be checked against evidence.
- Load-bearing: passes — The paper’s conclusions depend on it.
- Based: passes — The paper gives a reason why it holds.
It may state two separate claims as one.
A result the paper reports from its own data — it cites no other source for it, so there is none to check. The quote shows it is in the paper.
In the paper
“TAGs show a genotype-dependent increase both at baseline and after activation, with lowest cellular TAG levels in APOE-KO and highest in APOE4 iAstrocytes (Figures S2A and S5A).”
§ APOE2, E3, and E4 differentially modulate cellular homeostasis, cholesterol metabolism, and inflammatory response in isogenic iPSC-derived astrocytes > Results > IL-1β treatment affects cholesterol and CE regulation
plaincorrelational- Asserted: passes — The authors put it forward as true.
- Checkable: passes — It can be checked against evidence.
- Load-bearing: unclear — It is unclear whether the paper’s conclusions depend on it.
- Based: passes — The paper gives a reason why it holds.
It may state two separate claims as one.
A result the paper reports from its own data — it cites no other source for it, so there is none to check. The quote shows it is in the paper.
In the paper
“Immune regulatory pathways in iAstrocytes at baseline were negatively enriched in APOE2 versus E3, highly positively enriched in APOE4 versus E3, and moderately enriched in APOE4 versus E2.”
§ APOE2, E3, and E4 differentially modulate cellular homeostasis, cholesterol metabolism, and inflammatory response in isogenic iPSC-derived astrocytes > Discussion > Cholesterol metabolism and inflammatory regulation
plaincorrelational- Asserted: passes — The authors put it forward as true.
- Checkable: passes — It can be checked against evidence.
- Load-bearing: passes — The paper’s conclusions depend on it.
- Based: passes — The paper gives a reason why it holds.
It may state two separate claims as one.
A result the paper reports from its own data — it cites no other source for it, so there is none to check. The quote shows it is in the paper.
In the paper
“APOE3 cells showed a decrease in sterol metabolic pathways upon activation, while lipid and fatty acid metabolism were not regulated uniformly.”
§ APOE2, E3, and E4 differentially modulate cellular homeostasis, cholesterol metabolism, and inflammatory response in isogenic iPSC-derived astrocytes > Discussion > Cholesterol metabolism and inflammatory regulation
plaindirect- Asserted: passes — The authors put it forward as true.
- Checkable: passes — It can be checked against evidence.
- Load-bearing: passes — The paper’s conclusions depend on it.
- Based: passes — The paper gives a reason why it holds.
It may state two separate claims as one.
A result the paper reports from its own data — it cites no other source for it, so there is none to check. The quote shows it is in the paper.
In the paper
“These pathways were mostly downregulated in APOE4 versus APOE2 and APOE3 at baseline (Figure 3A), but after IL-1β stimulation they were enriched in APOE4, and downregulated in APOE2, whereas APOE3 showed differential regulation of these pathways compared with baseline (Figure 6A).”
§ APOE2, E3, and E4 differentially modulate cellular homeostasis, cholesterol metabolism, and inflammatory response in isogenic iPSC-derived astrocytes > Results > IL-1β treatment affects cholesterol and CE regulation
plaindirect- Asserted: passes — The authors put it forward as true.
- Checkable: passes — It can be checked against evidence.
- Load-bearing: passes — The paper’s conclusions depend on it.
- Based: passes — The paper gives a reason why it holds.
It may state two separate claims as one.
A result the paper reports from its own data — it cites no other source for it, so there is none to check. The quote shows it is in the paper.
In the paper
“This cytokine already showed detectable release at baseline, following a similar trend (E4 > E3 > E2 = KO).”
§ APOE2, E3, and E4 differentially modulate cellular homeostasis, cholesterol metabolism, and inflammatory response in isogenic iPSC-derived astrocytes > Results > APOE genotype-dependent upregulation of inflammatory pathways and exacerbated cytokine release in IL-1β-treated iAstrocytes
plaincorrelational- Asserted: passes — The authors put it forward as true.
- Checkable: passes — It can be checked against evidence.
- Load-bearing: unclear — It is unclear whether the paper’s conclusions depend on it.
- Based: passes — The paper gives a reason why it holds.
It may state two separate claims as one.
A result the paper reports from its own data — it cites no other source for it, so there is none to check. The quote shows it is in the paper.
In the paper
“Activation of iAstrocytes also resulted in an increase in pathways classified as lipid, fatty acid, and cholesterol metabolic processes in APOE4 iAstrocytes, while the opposite effect was seen in APOE2 iAstrocytes.”
§ APOE2, E3, and E4 differentially modulate cellular homeostasis, cholesterol metabolism, and inflammatory response in isogenic iPSC-derived astrocytes > Discussion > Cholesterol metabolism and inflammatory regulation
plaindirect- Asserted: passes — The authors put it forward as true.
- Checkable: passes — It can be checked against evidence.
- Load-bearing: passes — The paper’s conclusions depend on it.
- Based: passes — The paper gives a reason why it holds.
It may state two separate claims as one.
A result the paper reports from its own data — it cites no other source for it, so there is none to check. The quote shows it is in the paper.
In the paper
“GSEA of the proteomic dataset revealed downregulation of lipid/sterol metabolism and biosynthesis in APOE4 compared with APOE3 and APOE2 iAstrocytes, whereas lipid catabolic processes show opposite effects.”
§ APOE2, E3, and E4 differentially modulate cellular homeostasis, cholesterol metabolism, and inflammatory response in isogenic iPSC-derived astrocytes > Discussion > Lipid and cholesterol metabolism and the endolysosomal system
plaincorrelational- Asserted: passes — The authors put it forward as true.
- Checkable: passes — It can be checked against evidence.
- Load-bearing: passes — The paper’s conclusions depend on it.
- Based: passes — The paper gives a reason why it holds.
It may state two separate claims as one.
A result the paper reports from its own data — it cites no other source for it, so there is none to check. The quote shows it is in the paper.
In the paper
“The significant difference between intracellular and secreted cholesterol in APOE4 iAstrocytes was abolished after IL-1β treatment but had no effect on CE or PE”
§ APOE2, E3, and E4 differentially modulate cellular homeostasis, cholesterol metabolism, and inflammatory response in isogenic iPSC-derived astrocytes > Discussion > Cholesterol metabolism and inflammatory regulation
plaindirect- Asserted: passes — The authors put it forward as true.
- Checkable: passes — It can be checked against evidence.
- Load-bearing: passes — The paper’s conclusions depend on it.
- Based: passes — The paper gives a reason why it holds.
It may state two separate claims as one.
A result the paper reports from its own data — it cites no other source for it, so there is none to check. The quote shows it is in the paper.
In the paper
“Using a calorimetric NF-κB assay, we showed equal levels of NF-κB at baseline, while NF-κB activity was lower in E4 and E3 iAstrocytes after IL-1β treatment, compared with KO iAstrocytes (Figure 5D).”
§ APOE2, E3, and E4 differentially modulate cellular homeostasis, cholesterol metabolism, and inflammatory response in isogenic iPSC-derived astrocytes > Results > APOE genotype-dependent upregulation of inflammatory pathways and exacerbated cytokine release in IL-1β-treated iAstrocytes
plaindirect- Asserted: passes — The authors put it forward as true.
- Checkable: passes — It can be checked against evidence.
- Load-bearing: passes — The paper’s conclusions depend on it.
- Based: passes — The paper gives a reason why it holds.
It may state two separate claims as one.
A result the paper reports from its own data — it cites no other source for it, so there is none to check. The quote shows it is in the paper.
In the paper
“In addition, positive regulation of ion transport and ion homeostasis pathways were enriched in APOE4 compared with APOE3, and other ion regulatory pathways were not significantly regulated.”
§ APOE2, E3, and E4 differentially modulate cellular homeostasis, cholesterol metabolism, and inflammatory response in isogenic iPSC-derived astrocytes > Results > Lysosomal but not endosomal function is affected by APOE genotype
plaincorrelational- Asserted: passes — The authors put it forward as true.
- Checkable: passes — It can be checked against evidence.
- Load-bearing: unclear — It is unclear whether the paper’s conclusions depend on it.
- Based: passes — The paper gives a reason why it holds.
It may state two separate claims as one.
A result the paper reports from its own data — it cites no other source for it, so there is none to check. The quote shows it is in the paper.
In the paper
“However, IL-1β-treated E3 iAstrocytes also had lower NF-κB activity, while no changes in NF-κB proteomic pathways were observed.”
§ APOE2, E3, and E4 differentially modulate cellular homeostasis, cholesterol metabolism, and inflammatory response in isogenic iPSC-derived astrocytes > Discussion > Cholesterol metabolism and inflammatory regulation
plain- Asserted: passes — The authors put it forward as true.
- Checkable: passes — It can be checked against evidence.
- Load-bearing: unclear — It is unclear whether the paper’s conclusions depend on it.
- Based: passes — The paper gives a reason why it holds.
It may state two separate claims as one.
A result the paper reports from its own data — it cites no other source for it, so there is none to check. The quote shows it is in the paper.
In the paper
“Using MSD analysis, we observed a strong allele-dependent increase in inflammatory cytokine release upon iAstrocyte activation (E4 > E3 > E2 > KO), and even IL-6 and IL-8 release from APOE4 at baseline.”
§ APOE2, E3, and E4 differentially modulate cellular homeostasis, cholesterol metabolism, and inflammatory response in isogenic iPSC-derived astrocytes > Discussion > Cholesterol metabolism and inflammatory regulation
boosteddirect- Asserted: passes — The authors put it forward as true.
- Checkable: passes — It can be checked against evidence.
- Load-bearing: passes — The paper’s conclusions depend on it.
- Based: passes — The paper gives a reason why it holds.
It may state two separate claims as one.
A result the paper reports from its own data — it cites no other source for it, so there is none to check. The quote shows it is in the paper.
In the paper
“Further colocalization of Filipin III with Dextran-Alexa 555 was highest in APOE4 iAstrocytes, indicating higher cholesterol levels in lysosomes of APOE4 iAstrocytes (E4 > E2) (Figure 3G).”
§ APOE2, E3, and E4 differentially modulate cellular homeostasis, cholesterol metabolism, and inflammatory response in isogenic iPSC-derived astrocytes > Results > Cholesterol and lipid metabolism show APOE allele-dependent regulation
hedgedcorrelational- Asserted: passes — The authors put it forward as true.
- Checkable: passes — It can be checked against evidence.
- Load-bearing: passes — The paper’s conclusions depend on it.
- Based: passes — The paper gives a reason why it holds.
It may state two separate claims as one.
A result the paper reports from its own data — it cites no other source for it, so there is none to check. The quote shows it is in the paper.
In the paper
“Proton and cation transmembrane transport were highest in APOE4 iAstrocytes, and lowest in E2 (Figure 4A).”
§ APOE2, E3, and E4 differentially modulate cellular homeostasis, cholesterol metabolism, and inflammatory response in isogenic iPSC-derived astrocytes > Results > Lysosomal but not endosomal function is affected by APOE genotype
plaincorrelational- Asserted: passes — The authors put it forward as true.
- Checkable: passes — It can be checked against evidence.
- Load-bearing: passes — The paper’s conclusions depend on it.
- Based: passes — The paper gives a reason why it holds.
It may state two separate claims as one.
A result the paper reports from its own data — it cites no other source for it, so there is none to check. The quote shows it is in the paper.
In the paper
“Interestingly, APOE4 iAstrocytes showed the most differentially expressed pathways (both up- and downregulated), more than APOE3, and APOE2 iAstrocytes showed almost no significantly regulated pathways, indicating that APOE4 iAstrocytes are most susceptible to pro-inflammatory stimuli (Figure 5C).”
§ APOE2, E3, and E4 differentially modulate cellular homeostasis, cholesterol metabolism, and inflammatory response in isogenic iPSC-derived astrocytes > Results > APOE genotype-dependent upregulation of inflammatory pathways and exacerbated cytokine release in IL-1β-treated iAstrocytes
hedgeddirect- Asserted: passes — The authors put it forward as true.
- Checkable: passes — It can be checked against evidence.
- Load-bearing: passes — The paper’s conclusions depend on it.
- Based: passes — The paper gives a reason why it holds.
It may state two separate claims as one.
The paper states this without a source or data behind it here, so there is nothing to check it against. The quote shows it is in the paper.
In the paper
“In addition, iAstrocytes can be stimulated with low levels of pro-inflammatory cytokine, while being mostly non-reactive at baseline.”
§ APOE2, E3, and E4 differentially modulate cellular homeostasis, cholesterol metabolism, and inflammatory response in isogenic iPSC-derived astrocytes > Discussion
plaindirect- Asserted: passes — The authors put it forward as true.
- Checkable: passes — It can be checked against evidence.
- Load-bearing: passes — The paper’s conclusions depend on it.
- Based: unclear — It is unclear why the paper says it holds.
It may state two separate claims as one.
A result the paper reports from its own data — it cites no other source for it, so there is none to check. The quote shows it is in the paper.
In the paper
“Interestingly, our day 44 iAstrocytes are not susceptible to activation by Aβ42, possibly pointing out that these cells need to be primed in order to be reactive to Aβ.”
§ APOE2, E3, and E4 differentially modulate cellular homeostasis, cholesterol metabolism, and inflammatory response in isogenic iPSC-derived astrocytes > Discussion
hedged- Asserted: passes — The authors put it forward as true.
- Checkable: passes — It can be checked against evidence.
- Load-bearing: unclear — It is unclear whether the paper’s conclusions depend on it.
- Based: passes — The paper gives a reason why it holds.
It may state two separate claims as one.
A result the paper reports from its own data — it cites no other source for it, so there is none to check. The quote shows it is in the paper.
In the paper
“Lastly, cell-cell junction was significantly downregulated in E4 but only slightly in E2 and E3”
§ APOE2, E3, and E4 differentially modulate cellular homeostasis, cholesterol metabolism, and inflammatory response in isogenic iPSC-derived astrocytes > Results > APOE genotype-dependent upregulation of inflammatory pathways and exacerbated cytokine release in IL-1β-treated iAstrocytes
plaindirect- Asserted: passes — The authors put it forward as true.
- Checkable: passes — It can be checked against evidence.
- Load-bearing: passes — The paper’s conclusions depend on it.
- Based: passes — The paper gives a reason why it holds.
It may state two separate claims as one.
A result the paper reports from its own data — it cites no other source for it, so there is none to check. The quote shows it is in the paper.
In the paper
“Interestingly, two of the pathways downregulated in APOE4 iAstrocytes were NIK/NF-κB- and IL-1-mediated signaling, which were not significantly regulated in APOE3 or E2.”
§ APOE2, E3, and E4 differentially modulate cellular homeostasis, cholesterol metabolism, and inflammatory response in isogenic iPSC-derived astrocytes > Discussion > Cholesterol metabolism and inflammatory regulation
plaindirect- Asserted: passes — The authors put it forward as true.
- Checkable: passes — It can be checked against evidence.
- Load-bearing: unclear — It is unclear whether the paper’s conclusions depend on it.
- Based: passes — The paper gives a reason why it holds.
It may state two separate claims as one.
A result the paper reports from its own data — it cites no other source for it, so there is none to check. The quote shows it is in the paper.
In the paper
“Interestingly, the cell aging pathway was significantly upregulated in E4; enriched, but not significantly, in E3; and even less in E2.”
§ APOE2, E3, and E4 differentially modulate cellular homeostasis, cholesterol metabolism, and inflammatory response in isogenic iPSC-derived astrocytes > Results > APOE genotype-dependent upregulation of inflammatory pathways and exacerbated cytokine release in IL-1β-treated iAstrocytes
plaincorrelational- Asserted: passes — The authors put it forward as true.
- Checkable: passes — It can be checked against evidence.
- Load-bearing: passes — The paper’s conclusions depend on it.
- Based: passes — The paper gives a reason why it holds.
It may state two separate claims as one.
In the paper
“One of the proteins significantly regulated was FDFT1 (squalene synthase), the first committed enzyme in the de novo biosynthesis pathway of cholesterol, or mevalonate pathway (Do et al., 2009).”
§ APOE2, E3, and E4 differentially modulate cellular homeostasis, cholesterol metabolism, and inflammatory response in isogenic iPSC-derived astrocytes > Results > Cholesterol and lipid metabolism show APOE allele-dependent regulation
What the sources say
- Not matchedcites Do et al., 2009
Couldn’t be matched to a paper in Crossref, so it can’t be checked.
plain- Asserted: passes — The authors put it forward as true.
- Checkable: passes — It can be checked against evidence.
- Load-bearing: fails — The paper’s conclusions may not depend on it.
- Based: passes — The paper gives a reason why it holds.
Probably not a substantial claim. The paper’s conclusions may not depend on it.
- Not matched
A claim is checked only against the cited paper’s full text, never its abstract, and none is available for its sources.
In the paper
“Early AD pathology is signified by a complex cellular phase, presenting a myriad of dysfunctions such as synapse loss, elevated immune response, defective clearance by the endolysosomal system, ER stress, and an increase in cholesteryl esters, cholesterol, and decreased levels of glycerophospholipids (De Strooper and Karran, 2016; Tackenberg et al., 2009).”
§ APOE2, E3, and E4 differentially modulate cellular homeostasis, cholesterol metabolism, and inflammatory response in isogenic iPSC-derived astrocytes > Introduction
What the sources say
plaincorrelational- Asserted: passes — The authors put it forward as true.
- Checkable: passes — It can be checked against evidence.
- Load-bearing: passes — The paper’s conclusions depend on it.
- Based: passes — The paper gives a reason why it holds.
It may state two separate claims as one.
In the paper
“The accumulation and aggregation of Aβ, caused by reduced clearance mechanisms, plays a significant role in the progression of AD pathogenesis (Winblad et al., 2016).”
§ APOE2, E3, and E4 differentially modulate cellular homeostasis, cholesterol metabolism, and inflammatory response in isogenic iPSC-derived astrocytes > Introduction
What the sources say
- Not checked — no full text of the sourcecites Winblad et al., 2016 source
plaindirect- Asserted: passes — The authors put it forward as true.
- Checkable: passes — It can be checked against evidence.
- Load-bearing: passes — The paper’s conclusions depend on it.
- Based: passes — The paper gives a reason why it holds.
Probably not a substantial claim.
A conclusion the paper draws from its own results — it cites no other source for it, so there is none to check. The quote shows it is in the paper.
In the paper
“Considering that APOE is primarily expressed in astrocytes, a key role is implied for astrocytic APOE in the initial phase of AD pathophysiology.”
§ APOE2, E3, and E4 differentially modulate cellular homeostasis, cholesterol metabolism, and inflammatory response in isogenic iPSC-derived astrocytes > Introduction
hedgedconditional- Asserted: passes — The authors put it forward as true.
- Checkable: passes — It can be checked against evidence.
- Load-bearing: passes — The paper’s conclusions depend on it.
- Based: passes — The paper gives a reason why it holds.
Probably not a substantial claim.
- Rests on an assumption: In the brain, APOE is mainly expressed by astrocytes, and in low levels by microglia.
In the paper
“The APOE2 allele is protective for AD; however, its biological role is heavily understudied and not yet understood (Michaelson, 2014).”
§ APOE2, E3, and E4 differentially modulate cellular homeostasis, cholesterol metabolism, and inflammatory response in isogenic iPSC-derived astrocytes > Introduction
What the sources say
- Not checked — no full text of the sourcecites Michaelson, 2014 source
plain- Asserted: passes — The authors put it forward as true.
- Checkable: passes — It can be checked against evidence.
- Load-bearing: passes — The paper’s conclusions depend on it.
- Based: passes — The paper gives a reason why it holds.
Probably not a substantial claim. It may state two separate claims as one.
A conclusion the paper draws from its own results — it cites no other source for it, so there is none to check. The quote shows it is in the paper.
In the paper
“Reduced glutamate uptake was not caused by the lower APOE levels in APOE4 iAstrocytes, as the APOE-KO iAstrocytes showed similar glutamate uptake capacity to APOE2.”
§ APOE2, E3, and E4 differentially modulate cellular homeostasis, cholesterol metabolism, and inflammatory response in isogenic iPSC-derived astrocytes > Results > Homeostatic functions show APOE allele-dependent decline in iAstrocytes
plaindirect- Asserted: passes — The authors put it forward as true.
- Checkable: passes — It can be checked against evidence.
- Load-bearing: passes — The paper’s conclusions depend on it.
- Based: passes — The paper gives a reason why it holds.
It may state two separate claims as one.
In the paper
“Apolipoprotein E (APOE) is part of a family of lipoprotein chaperones, binding lipoprotein complexes and facilitating their uptake through low-density lipoprotein receptors (LDLRs), or lipoprotein receptor 1 (LRP1), providing lipids and cholesterol to the cell (Kockx et al., 2018).”
§ APOE2, E3, and E4 differentially modulate cellular homeostasis, cholesterol metabolism, and inflammatory response in isogenic iPSC-derived astrocytes > Introduction
What the sources say
- Not checked — no full text of the sourcecites Kockx et al., 2018 source
plaindirect- Asserted: passes — The authors put it forward as true.
- Checkable: passes — It can be checked against evidence.
- Load-bearing: fails — The paper’s conclusions may not depend on it.
- Based: passes — The paper gives a reason why it holds.
Probably not a substantial claim. The paper’s conclusions may not depend on it.
In the paper
“Many of these functions have been found to be altered or dysfunctional in AD, such as a decrease in glutamate uptake (Scott et al., 2011).”
§ APOE2, E3, and E4 differentially modulate cellular homeostasis, cholesterol metabolism, and inflammatory response in isogenic iPSC-derived astrocytes > Discussion > Homeostatic functions: clearance and metabolism
What the sources say
- Not checked — no full text of the sourcecites Scott et al., 2011 source
plaincorrelational- Asserted: passes — The authors put it forward as true.
- Checkable: passes — It can be checked against evidence.
- Load-bearing: fails — The paper’s conclusions may not depend on it.
- Based: passes — The paper gives a reason why it holds.
Probably not a substantial claim. The paper’s conclusions may not depend on it.
A conclusion the paper draws from its own results — it cites no other source for it, so there is none to check. The quote shows it is in the paper.
In the paper
“APOE-dependent Aβ42 uptake may be the primary mode of degradation, even though an APOE-independent route, as seen in APOE-KO iAstrocytes, might be more efficient.”
§ APOE2, E3, and E4 differentially modulate cellular homeostasis, cholesterol metabolism, and inflammatory response in isogenic iPSC-derived astrocytes > Discussion > Homeostatic functions: clearance and metabolism
hedgedconditional- Asserted: passes — The authors put it forward as true.
- Checkable: passes — It can be checked against evidence.
- Load-bearing: passes — The paper’s conclusions depend on it.
- Based: passes — The paper gives a reason why it holds.
It may state two separate claims as one.
A conclusion the paper draws from its own results — it cites no other source for it, so there is none to check. The quote shows it is in the paper.
In the paper
“The increase in non-membrane-bound cholesterol is in line with the decrease in cholesterol efflux in APOE4 cells; membrane-bound cholesterol can bind to HDL particles and be secreted, and APOE-mediated efflux may be ineffective in APOE4 due to the lack of ABCA1.”
§ APOE2, E3, and E4 differentially modulate cellular homeostasis, cholesterol metabolism, and inflammatory response in isogenic iPSC-derived astrocytes > Discussion > Lipid and cholesterol metabolism and the endolysosomal system
hedgedconditional- Asserted: passes — The authors put it forward as true.
- Checkable: passes — It can be checked against evidence.
- Load-bearing: passes — The paper’s conclusions depend on it.
- Based: passes — The paper gives a reason why it holds.
It may state two separate claims as one.
A conclusion the paper draws from its own results — it cites no other source for it, so there is none to check. The quote shows it is in the paper.
In the paper
“This may lead to an imbalance in lipid metabolism/biosynthesis and catabolism, which are counter-regulated in APOE2 and APOE4 iAstrocytes.”
§ APOE2, E3, and E4 differentially modulate cellular homeostasis, cholesterol metabolism, and inflammatory response in isogenic iPSC-derived astrocytes > Discussion > Lipid and cholesterol metabolism and the endolysosomal system
hedgedconditional- Asserted: passes — The authors put it forward as true.
- Checkable: passes — It can be checked against evidence.
- Load-bearing: passes — The paper’s conclusions depend on it.
- Based: passes — The paper gives a reason why it holds.
It may state two separate claims as one.
In the paper
“which is likely facilitated by APOE-bound Aβ42 clearance; a complex formation that is genotype dependent (E2 > E3 > E4) (Aleshkov et al., 1997).”
§ APOE2, E3, and E4 differentially modulate cellular homeostasis, cholesterol metabolism, and inflammatory response in isogenic iPSC-derived astrocytes > Discussion > Homeostatic functions: clearance and metabolism
What the sources say
- Not checked — no full text of the sourcecites Aleshkov et al., 1997 source
hedgedconditional- Asserted: passes — The authors put it forward as true.
- Checkable: passes — It can be checked against evidence.
- Load-bearing: passes — The paper’s conclusions depend on it.
- Based: passes — The paper gives a reason why it holds.
It may state two separate claims as one.
The paper states this without a source or data behind it here, so there is nothing to check it against. The quote shows it is in the paper.
In the paper
“The LXR/RXR complex is in turn linked to transcription factor peroxisome proliferator-activated receptor gamma (PPARγ), which can also induce ABCA1 and APOE expression.”
§ APOE2, E3, and E4 differentially modulate cellular homeostasis, cholesterol metabolism, and inflammatory response in isogenic iPSC-derived astrocytes > Discussion > Cholesterol metabolism and inflammatory regulation
plaincorrelational- Asserted: passes — The authors put it forward as true.
- Checkable: passes — It can be checked against evidence.
- Load-bearing: passes — The paper’s conclusions depend on it.
- Based: passes — The paper gives a reason why it holds.
Probably not a substantial claim. It may state two separate claims as one.
In the paper
“It has been shown that cytokine stimulation can regulate cholesterol synthesis by activating SREBP1 (Gierens et al., 2000).”
§ APOE2, E3, and E4 differentially modulate cellular homeostasis, cholesterol metabolism, and inflammatory response in isogenic iPSC-derived astrocytes > Discussion > Cholesterol metabolism and inflammatory regulation
What the sources say
- Not checked — no full text of the sourcecites Gierens et al., 2000 source
plaindirect- Asserted: passes — The authors put it forward as true.
- Checkable: passes — It can be checked against evidence.
- Load-bearing: fails — The paper’s conclusions may not depend on it.
- Based: passes — The paper gives a reason why it holds.
Probably not a substantial claim. The paper’s conclusions may not depend on it.
In the paper
“This transcription factor in turn induces de novo biosynthesis of cholesterol and increases the expression of LRP1 or VLDLR to increase cholesterol uptake.”
§ APOE2, E3, and E4 differentially modulate cellular homeostasis, cholesterol metabolism, and inflammatory response in isogenic iPSC-derived astrocytes > Discussion > Cholesterol metabolism and inflammatory regulation
What the sources say
- Not checked — no full text of the sourcecites Gierens et al., 2000 source
plaindirect- Asserted: passes — The authors put it forward as true.
- Checkable: passes — It can be checked against evidence.
- Load-bearing: fails — The paper’s conclusions may not depend on it.
- Based: passes — The paper gives a reason why it holds.
Probably not a substantial claim. The paper’s conclusions may not depend on it. It may state two separate claims as one.
A conclusion the paper draws from its own results — it cites no other source for it, so there is none to check. The quote shows it is in the paper.
In the paper
“Together, we show that APOE2, E3, E4, and KO iAstrocytes show distinct phenotypes in homeostatic functions, cholesterol and lipid metabolism, lysosomal function, and inflammatory regulation.”
§ APOE2, E3, and E4 differentially modulate cellular homeostasis, cholesterol metabolism, and inflammatory response in isogenic iPSC-derived astrocytes > Discussion > Cholesterol metabolism and inflammatory regulation
boostedcorrelational- Asserted: passes — The authors put it forward as true.
- Checkable: passes — It can be checked against evidence.
- Load-bearing: passes — The paper’s conclusions depend on it.
- Based: passes — The paper gives a reason why it holds.
It may state two separate claims as one.
- Rests on an assumption: The four isogenic iPSC lines differ only in APOE genotype and not in other genetic or epigenetic factors that affect the measured phenotypes.
- Rests on an assumption: The in vitro iPSC-derived iAstrocyte model recapitulates relevant aspects of human astrocyte biology and APOE-related AD mechanisms.
A conclusion the paper draws from its own results — it cites no other source for it, so there is none to check. The quote shows it is in the paper.
In the paper
“we conclude that the effect of IL-1β seen is due to an increase of total cholesterol in the APOE2 and E3 iAstrocytes, but not in APOE4.”
§ APOE2, E3, and E4 differentially modulate cellular homeostasis, cholesterol metabolism, and inflammatory response in isogenic iPSC-derived astrocytes > Discussion > Cholesterol metabolism and inflammatory regulation
plaindirect- Asserted: passes — The authors put it forward as true.
- Checkable: passes — It can be checked against evidence.
- Load-bearing: passes — The paper’s conclusions depend on it.
- Based: passes — The paper gives a reason why it holds.
It may state two separate claims as one.
- Rests on an assumption: The four isogenic iPSC lines differ only in APOE genotype and not in other genetic or epigenetic factors that affect the measured phenotypes.
A conclusion the paper draws from its own results — it cites no other source for it, so there is none to check. The quote shows it is in the paper.
In the paper
“the interplay between cholesterol metabolism and immune regulation indicates that it is not a mere decrease of function in APOE4 cells: APOE2, APOE3, and APOE4 iAstrocytes may utilize different mechanisms altogether.”
§ APOE2, E3, and E4 differentially modulate cellular homeostasis, cholesterol metabolism, and inflammatory response in isogenic iPSC-derived astrocytes > Discussion > Cholesterol metabolism and inflammatory regulation
hedgedconditional- Asserted: passes — The authors put it forward as true.
- Checkable: passes — It can be checked against evidence.
- Load-bearing: passes — The paper’s conclusions depend on it.
- Based: passes — The paper gives a reason why it holds.
It may state two separate claims as one.
- Rests on an assumption: The four isogenic iPSC lines differ only in APOE genotype and not in other genetic or epigenetic factors that affect the measured phenotypes.
- Rests on an assumption: The in vitro iPSC-derived iAstrocyte model recapitulates relevant aspects of human astrocyte biology and APOE-related AD mechanisms.
None of the sources cited for this claim have been checked yet.
In the paper
“This is in line with research showing that chronic inflammation is associated with an earlier onset of AD in APOE4 carriers.”
§ APOE2, E3, and E4 differentially modulate cellular homeostasis, cholesterol metabolism, and inflammatory response in isogenic iPSC-derived astrocytes > Discussion > Cholesterol metabolism and inflammatory regulation
plaincorrelational- Asserted: passes — The authors put it forward as true.
- Checkable: passes — It can be checked against evidence.
- Load-bearing: fails — The paper’s conclusions may not depend on it.
- Based: passes — The paper gives a reason why it holds.
Probably not a substantial claim. The paper’s conclusions may not depend on it.
A conclusion the paper draws from its own results — it cites no other source for it, so there is none to check. The quote shows it is in the paper.
In the paper
“it does not exclude the presence of functional changes in endosomes or it may require prior activation of the astrocytes to detect endosomal deficits, which would thus not be present in our cells at baseline.”
§ APOE2, E3, and E4 differentially modulate cellular homeostasis, cholesterol metabolism, and inflammatory response in isogenic iPSC-derived astrocytes > Discussion > Lipid and cholesterol metabolism and the endolysosomal system
hedgedconditional- Asserted: passes — The authors put it forward as true.
- Checkable: passes — It can be checked against evidence.
- Load-bearing: fails — The paper’s conclusions may not depend on it.
- Based: passes — The paper gives a reason why it holds.
Probably not a substantial claim. The paper’s conclusions may not depend on it. It may state two separate claims as one.
In the paper
“Cholesterol biosynthesis and lipid efflux machinery are regulated via LXR and retinoid X receptor (RXR) complex activation; when intracellular cholesterol is increased, LXR/RXR increases ABCA1 expression to induce lipid efflux, APOE expression, and inhibition of SREBP activation (Shimano and Sato, 2017).”
§ APOE2, E3, and E4 differentially modulate cellular homeostasis, cholesterol metabolism, and inflammatory response in isogenic iPSC-derived astrocytes > Discussion > Cholesterol metabolism and inflammatory regulation
What the sources say
- Not checked — no full text of the sourcecites Shimano and Sato, 2017 source
plaindirect- Asserted: passes — The authors put it forward as true.
- Checkable: passes — It can be checked against evidence.
- Load-bearing: fails — The paper’s conclusions may not depend on it.
- Based: passes — The paper gives a reason why it holds.
Probably not a substantial claim. The paper’s conclusions may not depend on it. It may state two separate claims as one.
A conclusion the paper draws from its own results — it cites no other source for it, so there is none to check. The quote shows it is in the paper.
In the paper
“The APOE allele-dependent effect on glutamate uptake and LRP1-dependent Aβ42 uptake can provide a mechanism explaining the biological role of APOE in homeostatic functions such as regulation of glutamate levels, but also pathological events such as extracellular Aβ42 buildup.”
§ APOE2, E3, and E4 differentially modulate cellular homeostasis, cholesterol metabolism, and inflammatory response in isogenic iPSC-derived astrocytes > Discussion > Homeostatic functions: clearance and metabolism
plainconditional- Asserted: passes — The authors put it forward as true.
- Checkable: passes — It can be checked against evidence.
- Load-bearing: passes — The paper’s conclusions depend on it.
- Based: passes — The paper gives a reason why it holds.
It may state two separate claims as one.
- Rests on an assumption: The in vitro iPSC-derived iAstrocyte model recapitulates relevant aspects of human astrocyte biology and APOE-related AD mechanisms.
A conclusion the paper draws from its own results — it cites no other source for it, so there is none to check. The quote shows it is in the paper.
In the paper
“This indicates APOE4 iAstrocytes already have an increased inflammatory phenotype, which is exacerbated in reactive iAstrocytes.”
§ APOE2, E3, and E4 differentially modulate cellular homeostasis, cholesterol metabolism, and inflammatory response in isogenic iPSC-derived astrocytes > Discussion > Cholesterol metabolism and inflammatory regulation
hedgeddirect- Asserted: passes — The authors put it forward as true.
- Checkable: passes — It can be checked against evidence.
- Load-bearing: passes — The paper’s conclusions depend on it.
- Based: passes — The paper gives a reason why it holds.
It may state two separate claims as one.
- Rests on an assumption: The four isogenic iPSC lines differ only in APOE genotype and not in other genetic or epigenetic factors that affect the measured phenotypes.
A conclusion the paper draws from its own results — it cites no other source for it, so there is none to check. The quote shows it is in the paper.
In the paper
“Altogether, these data indicate a role of the inflammatory microenvironment on cholesterol regulation, with APOE2 cells being unaffected, APOE3 cells increasing their cholesterol content, and APOE4 cells showing altered cholesterol regulation upon IL-1β treatment.”
§ APOE2, E3, and E4 differentially modulate cellular homeostasis, cholesterol metabolism, and inflammatory response in isogenic iPSC-derived astrocytes > Results > IL-1β treatment affects cholesterol and CE regulation
hedgeddirect- Asserted: passes — The authors put it forward as true.
- Checkable: passes — It can be checked against evidence.
- Load-bearing: passes — The paper’s conclusions depend on it.
- Based: passes — The paper gives a reason why it holds.
It may state two separate claims as one.
In the paper
“In line with our results, PPARγ signaling was decreased in APOE4 transgenic mouse brain, and increased in APOE2 (Wu et al., 2018).”
§ APOE2, E3, and E4 differentially modulate cellular homeostasis, cholesterol metabolism, and inflammatory response in isogenic iPSC-derived astrocytes > Discussion > Cholesterol metabolism and inflammatory regulation
What the sources say
- Not matchedcites Wu et al., 2018
Couldn’t be matched to a paper in Crossref, so it can’t be checked.
plaindirect- Asserted: passes — The authors put it forward as true.
- Checkable: passes — It can be checked against evidence.
- Load-bearing: unclear — It is unclear whether the paper’s conclusions depend on it.
- Based: passes — The paper gives a reason why it holds.
It may state two separate claims as one.
- Not matched
In the paper
“Furthermore, genetic variability of LXR may contribute to the risk for AD, in addition to the ability of LXR agonists to attenuate Aβ pathology (Kang and Rivest, 2012).”
§ APOE2, E3, and E4 differentially modulate cellular homeostasis, cholesterol metabolism, and inflammatory response in isogenic iPSC-derived astrocytes > Discussion > Cholesterol metabolism and inflammatory regulation
What the sources say
- Not checked — no full text of the sourcecites Kang and Rivest, 2012 source
hedgedconditional- Asserted: passes — The authors put it forward as true.
- Checkable: passes — It can be checked against evidence.
- Load-bearing: fails — The paper’s conclusions may not depend on it.
- Based: passes — The paper gives a reason why it holds.
Probably not a substantial claim. The paper’s conclusions may not depend on it. It may state two separate claims as one.
A conclusion the paper draws from its own results — it cites no other source for it, so there is none to check. The quote shows it is in the paper.
In the paper
“However, LXR/RXR are likely not entirely dysfunctional as cellular/secreted cholesterol is not significantly different after IL-1β treatment in contrast to baseline, suggesting residual LXR activity allowing for the relative increase in efflux of cholesterol.”
§ APOE2, E3, and E4 differentially modulate cellular homeostasis, cholesterol metabolism, and inflammatory response in isogenic iPSC-derived astrocytes > Discussion > Cholesterol metabolism and inflammatory regulation
hedgedconditional- Asserted: passes — The authors put it forward as true.
- Checkable: passes — It can be checked against evidence.
- Load-bearing: passes — The paper’s conclusions depend on it.
- Based: passes — The paper gives a reason why it holds.
It may state two separate claims as one.
- Rests on an assumption: The four isogenic iPSC lines differ only in APOE genotype and not in other genetic or epigenetic factors that affect the measured phenotypes.
A conclusion the paper draws from its own results — it cites no other source for it, so there is none to check. The quote shows it is in the paper.
In the paper
“An increase in proton and cation transmembrane transport might indicate a compensatory mechanism for underlying dysfunction.”
§ APOE2, E3, and E4 differentially modulate cellular homeostasis, cholesterol metabolism, and inflammatory response in isogenic iPSC-derived astrocytes > Results > Lysosomal but not endosomal function is affected by APOE genotype
hedgedconditional- Asserted: passes — The authors put it forward as true.
- Checkable: fails — It may be too vague to check against evidence.
- Load-bearing: fails — The paper’s conclusions may not depend on it.
- Based: passes — The paper gives a reason why it holds.
Probably not a substantial claim. It may be too vague to check against evidence. The paper’s conclusions may not depend on it.
None of the sources cited for this claim have been checked yet.
In the paper
“Many studies show an increase in NF-κB in the AD brain (Liddelow and Barres, 2017).”
§ APOE2, E3, and E4 differentially modulate cellular homeostasis, cholesterol metabolism, and inflammatory response in isogenic iPSC-derived astrocytes > Discussion > Cholesterol metabolism and inflammatory regulation
What the sources say
- Not checked yetcites Liddelow and Barres, 2017 source
Checked before — its earlier verdict is held back until a new check runs.
plaincorrelational- Asserted: passes — The authors put it forward as true.
- Checkable: passes — It can be checked against evidence.
- Load-bearing: fails — The paper’s conclusions may not depend on it.
- Based: passes — The paper gives a reason why it holds.
Probably not a substantial claim. The paper’s conclusions may not depend on it.
- Not checked yet
A conclusion the paper draws from its own results — it cites no other source for it, so there is none to check. The quote shows it is in the paper.
In the paper
“Taken together, APOE4 iAstrocytes reveal a disease-relevant phenotype, causing dysregulated cholesterol/lipid homeostasis, increased inflammatory signaling, and reduced β-amyloid uptake, while APOE2 iAstrocytes show opposing effects.”
§ APOE2, E3, and E4 differentially modulate cellular homeostasis, cholesterol metabolism, and inflammatory response in isogenic iPSC-derived astrocytes > Abstract
plaindirect- Asserted: passes — The authors put it forward as true.
- Checkable: passes — It can be checked against evidence.
- Load-bearing: passes — The paper’s conclusions depend on it.
- Based: passes — The paper gives a reason why it holds.
It may state two separate claims as one.
A conclusion the paper draws from its own results — it cites no other source for it, so there is none to check. The quote shows it is in the paper.
In the paper
“These data suggest that APOE4 iAstrocytes have an inflammatory phenotype already at baseline, which is exacerbated upon activation, while APOE2 cells display a rather anti-inflammatory or neutral phenotype, and APOE3 represents an intermediate state.”
§ APOE2, E3, and E4 differentially modulate cellular homeostasis, cholesterol metabolism, and inflammatory response in isogenic iPSC-derived astrocytes > Results > APOE genotype-dependent upregulation of inflammatory pathways and exacerbated cytokine release in IL-1β-treated iAstrocytes
hedgedcorrelational- Asserted: passes — The authors put it forward as true.
- Checkable: passes — It can be checked against evidence.
- Load-bearing: passes — The paper’s conclusions depend on it.
- Based: passes — The paper gives a reason why it holds.
It may state two separate claims as one.
What the paper did — it cites no source for this, so there is none to check. The quote shows it is in the paper.
In the paper
“Experiments were performed at least in triplicate”
§ APOE2, E3, and E4 differentially modulate cellular homeostasis, cholesterol metabolism, and inflammatory response in isogenic iPSC-derived astrocytes > Experimental procedures > Statistical analysis
plain- Asserted: passes — The authors put it forward as true.
- Checkable: passes — It can be checked against evidence.
- Load-bearing: fails — The paper’s conclusions may not depend on it.
- Based: passes — The paper gives a reason why it holds.
Probably not a substantial claim. The paper’s conclusions may not depend on it.
The paper relies on this without support.
APOE4 is the strongest genetic risk factor for AD, with one allele conferring about a 3-fold increase and two alleles about a 12-fold increase in risk.
“Carrying the APOE4 allele is the major genetic risk factor for developing sporadic Alzheimer disease (AD), where one allele confers a 3-fold increase and two alleles a 12-fold increase in risk.”
The paper relies on this without support.
The APOE2 allele is protective for AD.
“The APOE2 allele is protective for AD; however, its biological role is heavily understudied and not yet understood (Michaelson, 2014).”
The paper relies on this without support.
In the brain, APOE is mainly expressed by astrocytes, and in low levels by microglia.
“In the brain, APOE is one of the most abundant lipoprotein chaperones, mainly expressed by astrocytes, and in low levels by microglia.”
The paper relies on this without support.
Arg158 in APOE4 causes an ionic interaction between Arg61 and Cys255 on the lipid binding domain, leading to altered lipid binding and decreased capacity to load cholesterol.
“Arg158 in APOE4 causes an ionic interaction between Arg61 and Cys255 on the lipid binding domain, inferring a structural change, leading to altered lipid binding and decreased capacity to load cholesterol.”
The paper relies on this without support.
Aβ42 is mostly taken up through receptor-dependent endocytosis, such as LRP1.
“Aβ42 is mostly taken up through receptor-dependent endocytosis, such as LRP1.”
The paper relies on this without support.
ABCA1 is essential for lipid and cholesterol efflux, as well as for APOE lipidation.
“A second protein of interest was ATP-ase binding cassette 1 (ABCA1), essential for lipid and cholesterol efflux, as well as for APOE lipidation.”
The paper relies on this without support.
The four isogenic iPSC lines differ only in APOE genotype and not in other genetic or epigenetic factors that affect the measured phenotypes.
“iPSC lines were purchased from EBiSC (BIONi010-C-2, -C-3, C-4, and -C-6), harboring a single APOE2, APOE3, or APOE4 allele generated using CRISPR, or an APOE-KO generated by an insertion-deletion mutation in exon 2 (Schmid et al., 2019, 2020).”
The paper relies on this without support.
The in vitro iPSC-derived iAstrocyte model recapitulates relevant aspects of human astrocyte biology and APOE-related AD mechanisms.
“Our human isogenic mature iAstrocyte cell model represents a powerful tool to further address these open questions.”
The paper relies on this without support.
The APOE-KO iAstrocytes completely lack APOE protein and function.
“or an APOE-KO generated by an insertion-deletion mutation in exon 2 (Schmid et al., 2019, 2020).”
Claims other papers make about this one
Each is checked against this paper’s own text: does it say what the citing paper says it does?
The cited source doesn’t support the claim as written.
In the citing paper
“In our cell systems (HepG2, CCF-STTG1, and APO-KO iPSC-derived astrocytes), ApoE polymorphism does not significantly affect cholesterol efflux via ABCA1, possibly because these cells have high levels or activities of ABCA1 (de Leeuw et al., 2022).”
From Isoform- and cell-state-specific lipidation of ApoE in astrocytes (2022) · cites this paper as de Leeuw et al., 2022
Checked by a reasoning model — may be wrong.
Experimental — accuracy not yet measuredThe cited source doesn’t support the claim as written.
In the citing paper
“Data showed that ApoE4 astrocytes contain significantly lower levels of all three receptors (Figure 5), although conflicting data regarding some of them have been obtained in primary and hiPSC-derived ApoE4 astrocytes [15,24,73].”
From ApoE3 vs. ApoE4 Astrocytes: A Detailed Analysis Provides New Insights into Differences in Cholesterol Homeostasis (2022) · cites this paper as [24]
Checked by a reasoning model — may be wrong.
Experimental — accuracy not yet measuredThe source backs part of the claim, not all of it — or backs it for a different population, condition or comparison.
In the citing paper
“This was also observed in astrocytes from the same iPSC lines, where APOE-KO astrocytes showed a similar response in glutamate and Aβ uptake, cholesterol, and lipid metabolism, as well as an inflammatory response to APOE2 but not to APOE4 astrocytes [13].”
From APOE4 Increases Energy Metabolism in APOE-Isogenic iPSC-Derived Neurons (2024) · cites this paper as [13]
Experimental — accuracy not yet measuredThe source backs part of the claim, not all of it — or backs it for a different population, condition or comparison.
In the citing paper
“Multiple transcriptomic studies of APOE4-expressing iPSC-derived astrocytes and microglia demonstrate alterations in the expression of lipid metabolic genes as well as defects in cholesterol trafficking and metabolism (Lin et al., 2018; de Leeuw et al., 2022; Tcw et al., 2022).”
From APOE traffics to astrocyte lipid droplets and modulates triglyceride saturation and droplet size (2024) · cites this paper as de Leeuw et al., 2022
Experimental — accuracy not yet measuredThe source backs part of the claim, not all of it — or backs it for a different population, condition or comparison.
In the citing paper
“Both the APOE-isogenic iPSCs and iAstrocytes had already been characterized and functionally validated in previous studies (de Leeuw et al., 2022; Budny et al., 2024).”
From APOE genotype-dependent differences in human astrocytic energy metabolism (2025) · cites this paper as de Leeuw et al., 2022
Experimental — accuracy not yet measured
The source backs part of the claim, not all of it — or backs it for a different population, condition or comparison.
In the citing paper
“Human isogenic iPSC-derived astrocytes expressing APOE4 displayed a pro-inflammatory phenotype, reduced beta-amyloid uptake capacity and altered lipid metabolism compared to astrocytes expressing APOE3 or APOE2 (de Leeuw et al., 2022).”
From APOE genotype-dependent differences in human astrocytic energy metabolism (2025) · cites this paper as de Leeuw et al., 2022
Experimental — accuracy not yet measuredThe source backs part of the claim, not all of it — or backs it for a different population, condition or comparison.
In the citing paper
“Recently, it has been shown that cholesterol homeostasis is also impaired in ApoE4 astrocytes, although controversial data concerning intracellular and secreted cholesterol levels are present in literature depending on the different experimental model employed [15,16,24].”
From ApoE3 vs. ApoE4 Astrocytes: A Detailed Analysis Provides New Insights into Differences in Cholesterol Homeostasis (2022) · cites this paper as [24]
Experimental — accuracy not yet measuredThe source backs part of the claim, not all of it — or backs it for a different population, condition or comparison.
In the citing paper
“However, LDLR, LRP1 and ApoER2 receptors are also present in astrocytes [15,24,63] and have been also shown to be involved in the Aβ clearance mediated by astrocytes [50,64].”
From ApoE3 vs. ApoE4 Astrocytes: A Detailed Analysis Provides New Insights into Differences in Cholesterol Homeostasis (2022) · cites this paper as [24]
Experimental — accuracy not yet measuredThe cited source says what the claim attributes to it.
In the citing paper
“The functional diversity of APOE isoforms profoundly impacts astrocyte biology.”
From Protective mechanisms against Alzheimer's disease in APOE3‐Christchurch homozygous astrocytes (2025) · cites this paper as [3]
The cited source says what the claim attributes to it.
In the citing paper
“Human isogenic iPSC-derived astrocytes expressing APOE4 displayed a pro-inflammatory phenotype, reduced beta-amyloid uptake capacity and altered lipid metabolism compared to astrocytes expressing APOE3 or APOE2 (de Leeuw et al., 2022).”
From APOE genotype-dependent differences in human astrocytic energy metabolism (2025) · cites this paper as de Leeuw et al., 2022
The cited source says what the claim attributes to it.
In the citing paper
“Human isogenic iPSC-derived astrocytes expressing APOE4 displayed a pro-inflammatory phenotype, reduced beta-amyloid uptake capacity and altered lipid metabolism compared to astrocytes expressing APOE3 or APOE2 (de Leeuw et al., 2022).”
From APOE genotype-dependent differences in human astrocytic energy metabolism (2025) · cites this paper as de Leeuw et al., 2022
The cited source says what the claim attributes to it.
In the citing paper
“In agreement with our data, significantly reduced ApoE levels were also observed in hiPSC-derived ApoE4 astrocytes [15,16,24], as well as in brain homogenates from mouse models expressing the human ApoE4 isoform [43,44].”
From ApoE3 vs. ApoE4 Astrocytes: A Detailed Analysis Provides New Insights into Differences in Cholesterol Homeostasis (2022) · cites this paper as [24]
The check wasn’t confident either way, so it gives no verdict — never disputed.
In the citing paper
“Gene set enrichment analysis (GSEA) of proteomic data showed strong upregulation of pathways involved in OXPHOS as well as mitochondrial structure and function in APOE4 compared to APOE2 and a tendency to downregulation in APOE2 compared to APOE3 (Figures 4A,B; Supplementary Table S1).”
From APOE genotype-dependent differences in human astrocytic energy metabolism (2025) · cites this paper as de Leeuw et al., 2022
Experimental — accuracy not yet measuredThe check wasn’t confident either way, so it gives no verdict — never disputed.
In the citing paper
“Gene set enrichment analysis (GSEA) of proteomic data showed strong upregulation of pathways involved in OXPHOS as well as mitochondrial structure and function in APOE4 compared to APOE2 and a tendency to downregulation in APOE2 compared to APOE3 (Figures 4A,B; Supplementary Table S1).”
From APOE genotype-dependent differences in human astrocytic energy metabolism (2025) · cites this paper as de Leeuw et al., 2022
Experimental — accuracy not yet measuredIn the citing paper
“Alterations of ApoE synthesis and release have been shown to characterize hiPSCs-derived ApoE4 astrocytes [15,16,24].”
From ApoE3 vs. ApoE4 Astrocytes: A Detailed Analysis Provides New Insights into Differences in Cholesterol Homeostasis (2022) · cites this paper as [24]
Self-check
Percentages, sums and reported differences re-computed from the paper’s own numbers.
Each contradiction between two passages listed here was confirmed by an independent check.
Rated minor: it would not touch a result — a value no result rests on, a p-value that stays on the same side of the significance level, or a conflict that is clerical, resolved elsewhere in the paper, or outside its own findings.
In the paper
§ APOE2, E3, and E4 differentially modulate cellular homeostasis, cholesterol metabolism, and inflammatory response in isogenic iPSC-derived astrocytes > Results > APOE genotype-dependent upregulation of inflammatory pathways and exacerbated cytokine release in IL-1β-treated iAstrocytes
“(A) GSEA NESs of protein lists ranked according to the t-statistic obtained for the contrast APOE2 versus APOE4, APOE4 versus APOE3, and APOE4 versus APOE2 iAstrocytes respectively.”
§ APOE2, E3, and E4 differentially modulate cellular homeostasis, cholesterol metabolism, and inflammatory response in isogenic iPSC-derived astrocytes > Results > APOE genotype-dependent upregulation of inflammatory pathways and exacerbated cytokine release in IL-1β-treated iAstrocytes
“At baseline, pathways involved in inflammatory regulation were highest in APOE4 compared with E3 and E2 and lower in E2 compared with E3 (E4 > E3 > E2) (Figure 5A).”
Rated minor: it would not touch a result — a value no result rests on, a p-value that stays on the same side of the significance level, or a conflict that is clerical, resolved elsewhere in the paper, or outside its own findings.
In the paper
§ APOE2, E3, and E4 differentially modulate cellular homeostasis, cholesterol metabolism, and inflammatory response in isogenic iPSC-derived astrocytes > Results > Cholesterol and lipid metabolism show APOE allele-dependent regulation
“total as well as cellular and secreted cholesterol was decreased in APOE4 compared with APOE3 and APOE2 iAstrocytes, while showing similar levels to APOE-KO (E2 = E3 > E4 = KO)”
§ APOE2, E3, and E4 differentially modulate cellular homeostasis, cholesterol metabolism, and inflammatory response in isogenic iPSC-derived astrocytes > Discussion > Cholesterol metabolism and inflammatory regulation
“Our results show an allele-dependent regulation of cellular cholesterol (E4 = KO > E3 < E2)”
Citations
Cites
Robinson, M. D., McCarthy, D. J., & Smyth, G. K. (2010) · Bioinformatics · doi:10.1093/bioinformatics/btp616 · Cited by 41,364
Apolipoprotein E and Alzheimer disease: risk, mechanisms and therapy
Liu, C.-C., Kanekiyo, T., Xu, H., & Bu, G. (2013) · Nature Reviews Neurology · doi:10.1038/nrneurol.2012.263 · Cited by 3,459
Reactive Astrocytes: Production, Function, and Therapeutic Potential
Liddelow, S. A., & Barres, B. A. (2017) · Immunity · doi:10.1016/j.immuni.2017.06.006 · Cited by 2,336
Zhang, Y., Sloan, S. A., Clarke, L. E., Caneda, C., Plaza, C. A., Blumenthal, P. D., Vogel, H., Steinberg, G. K., Edwards, M. S. B., Li, G., et al. (2016) · Neuron · doi:10.1016/j.neuron.2015.11.013 · Cited by 2,295
The Cellular Phase of Alzheimer’s Disease
De Strooper, B., & Karran, E. (2016) · Cell · doi:10.1016/j.cell.2015.12.056 · Cited by 1,990
Defeating Alzheimer's disease and other dementias: a priority for European science and society
Winblad, B., Amouyel, P., Andrieu, S., Ballard, C., Brayne, C., Brodaty, H., Cedazo-Minguez, A., Dubois, B., Edvardsson, D., Feldman, H., et al. (2016) · The Lancet Neurology · doi:10.1016/s1474-4422(16)00062-4 · Cited by 1,676
SREBP-regulated lipid metabolism: convergent physiology - divergent pathophysiology
Shimano, H., & Sato, R. (2017) · Nature Reviews Endocrinology · doi:10.1038/nrendo.2017.91 · Cited by 1,174
Lin, Y.-T., Seo, J., Gao, F., Feldman, H. M., Wen, H.-L., Penney, J., Cam, H. P., Gjoneska, E., Raja, W. K., Cheng, J., et al. (2018) · Neuron · doi:10.1016/j.neuron.2018.05.008 · Cited by 1,125
Verghese, P. B., Castellano, J. M., Garai, K., Wang, Y., Jiang, H., Shah, A., Bu, G., Frieden, C., & Holtzman, D. M. (2013) · Proceedings of the National Academy of Sciences · doi:10.1073/pnas.1220484110 · Cited by 556
Central Nervous System Lipoproteins: ApoE and Regulation of Cholesterol Metabolism
Mahley, R. W. (2016) · Arteriosclerosis, Thrombosis, and Vascular Biology · doi:10.1161/atvbaha.116.307023 · Cited by 516
Cited by
Sorted by citations
Apolipoprotein E in lipid metabolism and neurodegenerative disease
Yang, L. G., March, Z. M., Stephenson, R. A., & Narayan, P. S. (2023) · Trends in Endocrinology & Metabolism · doi:10.1016/j.tem.2023.05.002 · Cited by 286
The Glutamate/ GABA ‐Glutamine Cycle: Insights, Updates, and Advances
Andersen, J. V. (2025) · Journal of Neurochemistry · doi:10.1111/jnc.70029 · Cited by 170
Amyloid Precursor Protein and Alzheimer’s Disease
Orobets, K. S., & Karamyshev, A. L. (2023) · International Journal of Molecular Sciences · doi:10.3390/ijms241914794 · Cited by 141
Chen, Y., He, Y., Han, J., Wei, W., & Chen, F. (2023) · Frontiers in Aging Neuroscience · doi:10.3389/fnagi.2023.1258640 · Cited by 116
The cell biology of APOE in the brain
Windham, I. A., & Cohen, S. (2024) · Trends in Cell Biology · doi:10.1016/j.tcb.2023.09.004 · Cited by 103
The blood–brain barrier: a help and a hindrance
Rust, R., Yin, H. R., Buil, B. A., Sagare, A. P., & Kisler, K. (2025) · Brain · doi:10.1093/brain/awaf068 · Cited by 109
Self-citationAPOE traffics to astrocyte lipid droplets and modulates triglyceride saturation and droplet size
Windham, I. A., Powers, A. E., Ragusa, J. V., Wallace, E. D., Zanellati, M. C., Williams, V. H., Wagner, C. H., White, K. K., & Cohen, S. (2024) · Journal of Cell Biology · doi:10.1083/jcb.202305003 · Cited by 96
Cholesterol as a key player in amyloid β-mediated toxicity in Alzheimer’s disease
Rudajev, V., & Novotny, J. (2022) · Frontiers in Molecular Neuroscience · doi:10.3389/fnmol.2022.937056 · Cited by 94
prolfqua : A Comprehensive R -Package for Proteomics Differential Expression Analysis
Wolski, W., Nanni, P., Grossmann, J., d’Errico, M., Schlapbach, R., & Panse, C. (2023) · Journal of Proteome Research · doi:10.1021/acs.jproteome.2c00441 · Cited by 94
Self-citationIsoform- and cell-state-specific lipidation of ApoE in astrocytes
Lindner, K., Beckenbauer, K., van Ek, L. C., Titeca, K., de Leeuw, S. M., Awwad, K., Hanke, F., Korepanova, A. V., Rybin, V., van der Kam, E. L., et al. (2022) · Cell Reports · doi:10.1016/j.celrep.2022.110435 · Cited by 84
Self-citationThree major effects of APOEε4 on Aβ immunotherapy induced ARIA
Foley, K. E., & Wilcock, D. M. (2024) · Frontiers in Aging Neuroscience · doi:10.3389/fnagi.2024.1412006 · Cited by 79
Statins and cognition: Modifying factors and possible underlying mechanisms
Jamshidnejad-Tosaramandani, T., Kashanian, S., Al-Sabri, M. H., Kročianová, D., Clemensson, L. E., Gentreau, M., & Schiöth, H. B. (2022) · Frontiers in Aging Neuroscience · doi:10.3389/fnagi.2022.968039 · Cited by 60
The role of ATP-binding cassette subfamily A in the etiology of Alzheimer’s disease
Bossaerts, L., Cacace, R., & Broeckhoven, C. V. (2022) · Molecular Neurodegeneration · doi:10.1186/s13024-022-00536-w · Cited by 56
Metabolic perspective of astrocyte dysfunction in Alzheimer's disease and type 2 diabetes brains
Shen, Z., Li, Z., Yu, M., Tan, K.-L., & Chen, S. X. (2023) · Biomedicine & Pharmacotherapy · doi:10.1016/j.biopha.2022.114206 · Cited by 53
Early- and Late-Onset Alzheimer’s Disease: Two Sides of the Same Coin?
Valdez-Gaxiola, C. A., Rosales-Leycegui, F., Gaxiola-Rubio, A., Moreno-Ortíz, J. M., & Figuera, L. E. (2024) · Diseases · doi:10.3390/diseases12060110 · Cited by 55
A multi‐hit hypothesis for an APOE4 ‐dependent pathophysiological state
Steele, O. G., Stuart, A. C., Minkley, L., Shaw, K., Bonnar, O., Anderle, S., Penn, A. C., Rusted, J., Serpell, L., Hall, C., et al. (2022) · European Journal of Neuroscience · doi:10.1111/ejn.15685 · Cited by 44
Rudajev, V., & Novotný, J. (2023) · Cell & Bioscience · doi:10.1186/s13578-023-01127-y · Cited by 52
Labib, D., Wang, Z., Prakash, P. S., Zimmer, M., Smith, M. D., Frazel, P. W., Barbar, L., Sapar, M. L., Calabresi, P. A., Peng, J., et al. (2022) · Frontiers in Molecular Neuroscience · doi:10.3389/fnmol.2022.870085 · Cited by 45
Application of curcumin nanoformulations in Alzheimer’s disease: prevention, diagnosis and treatment
Lv, H., Wang, Y., Yang, X., Ling, G., & Zhang, P. (2022) · Nutritional Neuroscience · doi:10.1080/1028415x.2022.2084550 · Cited by 44
From Lab Bench to Hope: Emerging Gene Therapies in Clinical Trials for Alzheimer’s Disease
Ortega, A., Chernicki, B. P., Ou, G., & Parmar, M. S. (2024) · Molecular Neurobiology · doi:10.1007/s12035-024-04285-3 · Cited by 41
Astrocytes in Neurodegeneration: Inspiration From Genetics
Huang, J., Li, C., & Shang, H. (2022) · Frontiers in Neuroscience · doi:10.3389/fnins.2022.882316 · Cited by 40
The Neurolipid Atlas: a lipidomics resource for neurodegenerative diseases
Feringa, F. M., Koppes-den Hertog, S. J., Wang, L. Y., Derks, R. J. E., Kruijff, I., Erlebach, L., Heijneman, J., Miramontes, R., Pömpner, N., Blomberg, N., et al. (2025) · Nature Metabolism · doi:10.1038/s42255-025-01365-z · Cited by 56
ApoE4 expression disrupts tau uptake, trafficking, and clearance in astrocytes
Eisenbaum, M., Pearson, A., Ortiz, C., Mullan, M., Crawford, F., Ojo, J., & Bachmeier, C. (2024) · Glia · doi:10.1002/glia.24469 · Cited by 25
Zhao, J., Ikezu, T. C., Lu, W., Macyczko, J. R., Li, Y., Lewis-Tuffin, L. J., Martens, Y. A., Ren, Y., Zhu, Y., Asmann, Y. W., et al. (2023) · Stem Cell Research & Therapy · doi:10.1186/s13287-023-03444-y · Cited by 25
Chen, J., Zhao, S., Zhou, Y., Wang, L., Chen, Q., & Zheng, K. (2025) · BioScience Trends · doi:10.5582/bst.2025.01148 · Cited by 29
Staurenghi, E., Leoni, V., Lo Iacono, M., Sottero, B., Testa, G., Giannelli, S., Leonarduzzi, G., & Gamba, P. (2022) · Antioxidants · doi:10.3390/antiox11112168 · Cited by 24
Physical Exercise Counteracts Aging-Associated White Matter Demyelination Causing Cognitive Decline
Butt, T. H., Tobiume, M., Ré, D. B., & Kariya, S. (2024) · Aging and Disease · doi:10.14336/ad.2024.0216 · Cited by 25
Cell type-specific functions of Alzheimer's disease endocytic risk genes
Maninger, J.-K., Nowak, K., Goberdhan, S., O'Donoghue, R., & Connor-Robson, N. (2024) · Philosophical Transactions of the Royal Society B: Biological Sciences · doi:10.1098/rstb.2022.0378 · Cited by 22
Ding, Y., Palecek, S. P., & Shusta, E. V. (2024) · Fluids and Barriers of the CNS · doi:10.1186/s12987-024-00580-2 · Cited by 22
Budny, V., Ruminot, I., Wybitul, M., Treyer, V., Barros, L. F., & Tackenberg, C. (2025) · Translational Psychiatry · doi:10.1038/s41398-025-03550-w · Cited by 25
Self-citationApolipoprotein E ε4 modulates astrocyte neuronal support functions in the presence of amyloid‐β
Fleeman, R. M., Kuhn, M. K., Chan, D. C., & Proctor, E. A. (2023) · Journal of Neurochemistry · doi:10.1111/jnc.15781 · Cited by 20
Chlamydia pneumoniae in Alzheimer's disease pathology
Subedi, L., Gaire, B. P., Koronyo, Y., Koronyo‐Hamaoui, M., & Crother, T. R. (2024) · Frontiers in Neuroscience · doi:10.3389/fnins.2024.1393293 · Cited by 24
Feringa, F. M., Hertog, S. K.-D., Wang, L. Y., Derks, R. J. E., Kruijff, I. D., Erlebach, L., Heijneman, J., Miramontes, R., Pömpner, N., Blomberg, N., et al. (2024) · bioRxiv (Cold Spring Harbor Laboratory) · doi:10.1101/2024.07.01.601474 · Cited by 21
Hu, H., Wan, S., Hu, Y., Wang, Q., Li, H., & Zhang, N. (2025) · Annals of Medicine · doi:10.1080/07853890.2024.2445194 · Cited by 20
COVID‐19 and the impact on Alzheimer's disease pathology
Furman, S., Green, K. N., & Lane, T. E. (2023) · Journal of Neurochemistry · doi:10.1111/jnc.15985 · Cited by 18
Retinal dysfunction in APOE4 knock‐in mouse model of Alzheimer's disease
Abhyankar, S. D., Luo, Q., Hartman, G. D., Mahajan, N. S., Corson, T. W., Oblak, A. L., Lamb, B. T., & Bhatwadekar, A. D. (2025) · Alzheimer s & Dementia · doi:10.1002/alz.14433 · Cited by 16
The role of ADAM10 in astrocytes: Implications for Alzheimer’s disease
Elsworthy, R. J., Hill, E. J., Dunleavy, C., & Aldred, S. (2022) · Frontiers in Aging Neuroscience · doi:10.3389/fnagi.2022.1056507 · Cited by 17
Lou, T.-W., Tao, B., & Chen, M. (2023) · Neuroscience · doi:10.1016/j.neuroscience.2023.01.032 · Cited by 17
APOE4 Increases Energy Metabolism in APOE-Isogenic iPSC-Derived Neurons
Budny, V., Knöpfli, Y., Meier, D., Zürcher, K., Bodenmann, C., Peter, S. L., Müller, T., Tardy, M., Cortijo, C., & Tackenberg, C. (2024) · Cells · doi:10.3390/cells13141207 · Cited by 15
Self-citationIsoform- and cell-state-specific APOE homeostasis and function
Lindner, K., & Gavin, A.-C. (2024) · Neural Regeneration Research · doi:10.4103/nrr.nrr-d-23-01470 · Cited by 13
Self-citationCohen, B. M., & Sonntag, K. (2024) · EBioMedicine · doi:10.1016/j.ebiom.2024.105238 · Cited by 13
Bhattarai, P., Yılmaz, E., Cakir, E. Ö., Yüceer, H., Lee, A., Ma, Y., Çelikkaya, H., Coşacak, M. İ., Haage, V. C., Wang, X., et al. (2025) · bioRxiv (Cold Spring Harbor Laboratory) · doi:10.1101/2025.01.24.634732 · Cited by 12
Yang, X., Yao, K., Zhang, M., Zhang, W., & Zu, H. (2025) · Brain Research Bulletin · doi:10.1016/j.brainresbull.2025.111321 · Cited by 12
Alzheimer's disease phenotype based upon the carrier status of the apolipoprotein E ɛ4 allele
Ji, X., Peng, X., Tang, H., Pan, H., Wang, W. D., Wu, J., Chen, J., & Wei, N. (2023) · Brain Pathology · doi:10.1111/bpa.13208 · Cited by 9
Jacob, R. S., Dema, A., Chérot, H., Dumesnil, C., Cohen, S., Shalom, H. S., Rimon, N., Sibony-Nevo, O., Beck, G., Ainbinder, E., et al. (2024) · bioRxiv (Cold Spring Harbor Laboratory) · doi:10.1101/2024.06.19.599670 · Cited by 11
Murakami, R., Watanabe, H., Hashimoto, H., Kashiwagi-Hakozaki, M., Hashimoto, T., Karch, C. M., the Dominantly Inherited Alzheimer Network (DIAN), Iwatsubo, T., & Okano, H. (2024) · The Journal of Neuroscience · doi:10.1523/jneurosci.1709-23.2024 · Cited by 9
Building in vitro models of the brain to understand the role ofAPOEin Alzheimer’s disease
Pinals, R. L., & Tsai, L. (2022) · Life Science Alliance · doi:10.26508/lsa.202201542 · Cited by 10
Nepomuceno, M., Monllor, P., Cardells, M. J., Ftara, A., Magallón, M., Dası́, F., Badía, M.-C., Viña, J., & Lloret, A. (2024) · Free Radical Biology and Medicine · doi:10.1016/j.freeradbiomed.2024.02.021 · Cited by 9
Haferkamp, U., Hartmann, C., Abid, C. L., Brachner, A., Höchner, A., Gerhartl, A., Harwardt, B., Leckzik, S., Leu, J., Metzger, M., et al. (2023) · Fluids and Barriers of the CNS · doi:10.1186/s12987-023-00471-y · Cited by 12
Protective mechanisms against Alzheimer's disease in APOE3‐Christchurch homozygous astrocytes
Tian, X., Rivera, E. K., Hwang, I., Nikitina, A. A., Smith, J. A., Cho, Y. J., Sala‐Jarque, J., DuBose, A., Andriola, C., Gollan‐Myers, T., et al. (2025) · Alzheimer's & Dementia · doi:10.1002/alz.70589 · Cited by 7
Asiamah, E. A., Feng, B., Guo, R., Yaxing, X., Du, X., Liu, X., Zhang, J., Cui, H., & Ma, J. (2024) · Journal of Alzheimer s Disease · doi:10.3233/jad-230658 · Cited by 8
Neuroglia in neurodegeneration: Alzheimer, Parkinson, and Huntington disease
Lim, D., Matute, C., Cavaliere, F., & Verkhratsky, A. (2025) · Handbook of Clinical Neurology · doi:10.1016/b978-0-443-19102-2.00012-0 · Cited by 8
Michalski, C., & Wen, Z. (2023) · Frontiers in Psychiatry · doi:10.3389/fpsyt.2023.1291115 · Cited by 7
Zuniga, N. R., Earls, N. E., Denos, A. E. A., Elison, J. M., Jones, B. S., Smith, E. G., Moran, N. G., Broce, K. L., Romero, G. M., Hyer, C. D., et al. (2024) · PLoS Computational Biology · doi:10.1371/journal.pcbi.1012407 · Cited by 9
APOE genotype-dependent differences in human astrocytic energy metabolism
Budny, V., Bodenmann, C., Zürcher, K. J., Krüger, M., de Leeuw, S. M., Weber, R. Z., Rust, R., Ravotto, L., Ruminot, I., Barros, L. F., et al. (2025) · Frontiers in Cellular Neuroscience · doi:10.3389/fncel.2025.1603657 · Cited by 6
Self-citationAPOE3 astrocytes can rescue lipid abnormalities and dystrophic neurites of APOE4 human neurons
Halim, D. O., Biase, E. D., Rajon, A., Jordi, L., Hallett, P. J., & Ole Isacson, A. (2026) · PNAS Nexus · doi:10.1093/pnasnexus/pgag053 · Cited by 7
Connolly, K. J., Margaria, J., Biase, E. D., Cooper, O., Hallett, P. J., & Ole Isacson, A. (2023) · Cells · doi:10.3390/cells12212564 · Cited by 6
Akahane, S., Matsuura, H., Kaido, T., Usami, Y., Ishimine, N., Uehara, T., & Yamauchi, K. (2024) · Biological Chemistry · doi:10.1515/hsz-2024-0018 · Cited by 5
Emerging roles of astrocytes in hippocampal circuitry and behavior
Squires, A., & Park, J. (2025) · Frontiers in Cellular Neuroscience · doi:10.3389/fncel.2025.1694643 · Cited by 5
Wang, Y., Anchipolovsky, S., Bhuiyan, P., Sato, L., Liang, G., Chuang, D., & Wei, H. (2026) · Neurotherapeutics · doi:10.1016/j.neurot.2026.e00860 · Cited by 4
Lipid trajectories improve risk models for Alzheimer’s disease and mild cognitive impairment
Chase, B. A., Frigerio, R., Yucus, C. J., Patel, S. V., Maraganore, D. M., Sanders, A. R., Duan, J., & Markopoulou, K. (2024) · Journal of Lipid Research · doi:10.1016/j.jlr.2024.100714 · Cited by 5
Altered metabolic function induced by Aβ‐oligomers and PSEN1 mutations in iPSC ‐derived astrocytes
Elsworthy, R. J., Finelli, M. J., Aqattan, S., Dunleavy, C., King, M. C., Ludlam, A., Tarczyluk, M. A., Allen, S., Prosser, S., Chen, R., et al. (2024) · Journal of Neurochemistry · doi:10.1111/jnc.16267 · Cited by 7
Can cognitive reserve offset APOE-related Alzheimer’s risk? A systematic review
da Silva, S. P., Lampraki, C., Rêgo, T. S., Ghisletta, P., Kliegel, M., Maurer, J., Studer, M., Gouveia, É. R., Nascimento, M. D. M., & Ihle, A. (2025) · Ageing Research Reviews · doi:10.1016/j.arr.2025.102809 · Cited by 4
Impact of 7-ketocholesterol on the function and stability of the LAT1 transporter
Scanga, R., Scalise, M., Xiu, F., Galluccio, M., Console, L., Visentin, M., & Indiveri, C. (2025) · Biochemical Pharmacology · doi:10.1016/j.bcp.2025.117075 · Cited by 4
Tapella, L., Dematteis, G., Genazzani, A. A., Paola, M. D., & Lim, D. (2022) · Neural Regeneration Research · doi:10.4103/1673-5374.363192 · Cited by 4
Mesentier-Louro, L. A., Goldman, C., Gaese, S., Buonfiglioli, A., Kyriakis, D., Harlock, A., Ndayisaba, A., Sartori, E. R., Uchitelev, A., Fullard, J. F., et al. (2025) · bioRxiv (Cold Spring Harbor Laboratory) · doi:10.1101/2025.02.09.637107 · Cited by 4
Fueling Alzheimer’s Disease: Where Does Immunometabolism Stand?
Correia, S. C., Perry, G. L., & Moreira, P. I. (2024) · Journal of Alzheimer s Disease · doi:10.3233/jad-240787 · Cited by 3
Richards, S. E. V., Yang, M., Deik, A. A., & Ricq, E. L. (2025) · Neurochemical Research · doi:10.1007/s11064-025-04463-2 · Cited by 3
Expanding our understanding of synucleinopathies: proteinopathy, proteinopenia, and lipidopathy
Flores‐León, M., & Outeiro, T. F. (2025) · FEBS Journal · doi:10.1111/febs.70011 · Cited by 3
Targeting and eradicating latent CNS reservoirs of HIV-1: Original strategies and new models
Saeb, S., Wallet, C., Rohr, O., Schwartz, C., & Loustau, T. (2023) · Biochemical Pharmacology · doi:10.1016/j.bcp.2023.115679 · Cited by 6
Efficient derivation of functional astrocytes from human induced pluripotent stem cells (hiPSCs)
Széky, B., Juráková, V., Fouskova, E., Fehér, A., Zana, M., Karl, V. R., Farkas, J., Bódi-Jakus, M., Zapletalová, M., Pandey, S., et al. (2024) · PLoS ONE · doi:10.1371/journal.pone.0313514 · Cited by 2
Yılmaz, E., Chen, K. W., Cakir, E. Ö., Bhattarai, P., Liu, M., Ciener, B., Qiao, M., Lantigua, R., Medrano, M. Z., Rivera, D., et al. (2025) · medRxiv · doi:10.1101/2025.05.21.25328040 · Cited by 4
Schuldt, B. R., Haworth-Staines, D., Arévalo, A. P., Broekaart, D. W. M., Harlock, A., Wang, L., Bright, A., Gallagher, G., Rabinowitz, G., Goate, A., et al. (2025) · bioRxiv (Cold Spring Harbor Laboratory) · doi:10.1101/2025.09.04.674192 · Cited by 2
Qiang, Y., Yang, W., & Yang, B. X. (2024) · Actas Españolas de Psiquiatría · doi:10.62641/aep.v52i2.1555 · Cited by 1
Marizzoni, M., Tournier, B. B., Chevalier, C., Saleri, S., Lathuilière, A., Ceyzériat, K., Paquis, A., Park, R., Troesch, E., Cattaneo, A., et al. (2025) · Frontiers in Aging Neuroscience · doi:10.3389/fnagi.2025.1539067 · Cited by 1
Plasmalogen deficiency and the Alzheimer’s disease risk of apolipoprotein E4
Hällqvist, J., Taanman, J., Göteson, A., Heywood, W., Schott, J. M., Hardy, J., Landén, M., Zetterberg, H., Mills, K. A., & Ginsberg, L. (2026) · Brain Communications · doi:10.1093/braincomms/fcag040 · Cited by 1
Cell-type-specific APOE4 cascade across the Alzheimer’s disease continuum
Shostak, D. M., Liang, Z., & Huang, Y. (2026) · Neuron · doi:10.1016/j.neuron.2026.04.024 · Cited by 1
Murphy, K. B., Hu, D., Wolfs, L., Mancuso, R., Strooper, B. D., & Marzi, S. J. (2024) · bioRxiv (Cold Spring Harbor Laboratory) · doi:10.1101/2024.07.03.601874 · Cited by 1
ApoE lipidation, not isoform, is the key modulator of Aβ interaction, uptake, and cytotoxicityPreprint
Nurmakova, K., Gomes, G.-N. W., & Levine, Z. A. (2025) · bioRxiv (Cold Spring Harbor Laboratory) · doi:10.1101/2025.11.19.685371 · Cited by 1
APOE4 disrupts the central dogma by arresting neuronal proteome dynamicsPreprint
Krogsaeter, E., McKetney, J., Li, L., Liu, I., Richards, A., Subramanyam, V., Yin, K., Gordon, M., Mairal, P. B., Stevenson, E. J., et al. (2026) · bioRxiv (Cold Spring Harbor Laboratory) · doi:10.64898/2026.07.15.738801 · Cited by 1
APOE4-drives brain bioenergetic shifts independent of Alzheimer’s disease pathology
Lysaker, C. R., Johnson, C. N., Csikos, V., Franczak, E., Benson, M., Gilmore, C. A., Birky, C. J., Davis, X., McCoin, C. S., Smith, K. P., et al. (2026) · npj Dementia · doi:10.1038/s44400-026-00105-8 · Cited by 1
Roberts, A. P., Dec, K., McAllister, B., Tyrrell, V. J., O’Donnell, V. B., Harwood, A. J., & Williams, J. H. (2023) · bioRxiv (Cold Spring Harbor Laboratory) · doi:10.1101/2023.04.19.537428
Glial Cells in Alzheimer’s Disease
Verkerke, M. L. (2023) · Utrecht University Repository (Utrecht University) · doi:10.33540/1838
ApoE and Brain Synaptic Dynamics
Huang, Z. (2025) · Springer eBooks · doi:10.1007/978-3-031-52641-1_68-1
Chen, H., Fan, S., Chen, K., Wang, F., Lu, M., Wu, Y., Lu, H., & Li, J. (2025) · Neurotherapeutics · doi:10.1016/j.neurot.2025.e00740 · Cited by 1
Lei, C., Zhang, B., Yamaguchi, J., Tamura, R., Zhong, W., Cao, X., Liu, Y., Seki, M., Suzuki, Y., Suzuki, K., et al. (2025) · Journal of Neuroinflammation · doi:10.1186/s12974-025-03564-7
de Leeuw, S. M., & Nuriel, T. (2025) · bioRxiv (Cold Spring Harbor Laboratory) · doi:10.1101/2025.11.11.687891
Zhao, J., Ikezu, T. C., Lü, W., Macyczko, J. R., Li, Y., Lewis‐Tuffin, L. J., Martens, Y. A., Ren, Y., Zhu, Y., Asmann, Y. W., et al. (2023) · Figshare · doi:10.6084/m9.figshare.24002714
Fredriksen, K., Joshi, S. S., Chang, A., & Li, L. (2025) · bioRxiv (Cold Spring Harbor Laboratory) · doi:10.64898/2025.12.16.694774
APOE Gene Editing as a Therapeutic Target Toward Precision Medicine in AD
Teter, B., Campagna, J. J., Spilman, P. R., & John, V. (2025) · Springer eBooks · doi:10.1007/978-3-031-52641-1_73-1 · Cited by 1
Cortical Oscillations as an Endophenotype Mediating ApoE-ε2 Effects on Poststroke Functional Status
Delcamp, C., Schwarz, A., Ngo, K. J., Wong, D. Y., Fogel, B. L., Srinivasan, R., & Cramer, S. C. (2026) · Stroke · doi:10.1161/strokeaha.125.054238
APOE and Proteomics in Chronic Inflammation
Shvetcov, A., & Finney, C. A. (2026) · Springer eBooks · doi:10.1007/978-3-031-52641-1_82-1
ApoE and Bioenergetic Signaling
Raffaı̈, R. L. (2026) · Springer eBooks · doi:10.1007/978-3-031-52641-1_70-1
The Impact of Ethnic Differences on the Lipid-Lowering Efficacy of Statins
费, 华. (2026) · Advances in Clinical Medicine · doi:10.12677/acm.2026.1631020
Shimizu, R., Akahane, S., Suzuki, H., Matsuura, H., Uematsu, Y., Iimura, W., Ishimine, N., & Yamauchi, K. (2026) · Biochemistry and Biophysics Reports · doi:10.1016/j.bbrep.2026.102634
APOE Gene Editing as a Therapeutic Target Toward Precision Medicine in AD
Teter, B., Campagna, J. J., Spilman, P., & John, V. (2026) · Springer eBooks · doi:10.1007/978-3-031-96089-5_73
APOE and Proteomics in Chronic Inflammation
Shvetcov, A., & Finney, C. A. (2026) · Springer eBooks · doi:10.1007/978-3-031-96089-5_82
ApoE and Bioenergetic Signaling
Raffaı̈, R. L. (2026) · Springer eBooks · doi:10.1007/978-3-031-96089-5_70
The physiological effects of APOE genotype in healthy young/middle‐aged individuals
de Leeuw, S. M., Emrani, S., Putter, J., & Nuriel, T. (2026) · Biological reviews/Biological reviews of the Cambridge Philosophical Society · doi:10.1002/brv.70187
Zuo, N., Liu, S. J., Pan, S., Ou-Yang, X.-P., Yao, J., Zhou, Y., Zhou, Y., Ling-dong, K., & Pan, Y. (2026) · Molecular Psychiatry · doi:10.1038/s41380-026-03682-5
Metadata
- Authors
- de Leeuw, S. M., Kirschner, A. W. T., Lindner, K., Rust, R., Budny, V., Wolski, W. E., Gavin, A.-C., Nitsch, R. M., & Tackenberg, C.
- Affiliations
- University of Zurich (CH)
- University of Geneva (CH)
- Corresponding author
- Tackenberg, Christian
- Venue
- Stem Cell Reports
- Publisher
- Elsevier BV
- Published
- 2022-01
- Volume
- 17
- Issue
- 1
- Pages
- 110-126
- ISSN
- 2213-6711 (ISSN-L)
- PMC
- PMC8758949
- OpenAlex
- W4220926198
- Cited by
- 105
- References
- 42
- Citations by year
- 2026: 20 · 2025: 28 · 2024: 25 · 2023: 20 · 2022: 12
- FWCI
- 8.95
- Type
- journal article
- Language
- en
- Update notices
- erratum (2022-05-10)
- Open access
- gold
- doi.org
- Licence
- Locations
- Stem Cell Reports (publishedVersion, cc-by)
- PubMed Central (publishedVersion, cc-by)
- PubMed (publishedVersion)
- Funders
- Universität Zürich
- Neuroscience Center Zurich, University of Zurich
- Louis-Jeantet Foundation
- Topics
- Life Sciences › Neuroscience › Cellular and Molecular Neuroscience › Alzheimer's disease research and treatments
- Life Sciences › Neuroscience › Neurology › Neuroinflammation and Neurodegeneration Mechanisms
- Life Sciences › Biochemistry, Genetics and Molecular Biology › Biochemistry › Cholesterol and Lipid Metabolism
- Keywords
- apolipoprotein E, APOE ε4, APOE2, APOE3, apolipoprotein E deficiency, astrocytes, induced pluripotent stem cell-derived astrocytes, isogenic iPSC lines, cholesterol metabolism, lipid metabolism, lysosomal cholesterol, cytokine production, neuroinflammation, Alzheimer's disease risk, proteomic profiling
- MeSH terms
- Alleles, Astrocytes, Cell Cycle, Cell Differentiation, Cholesterol, Genotype, Homeostasis, Humans, Immunohistochemistry, Inflammation, Lipid Metabolism, Apolipoprotein E3, Apolipoprotein E4, Apolipoprotein E2, Induced Pluripotent Stem Cells, Neural Stem Cells
About these checks
Registry, retraction, Cites and statistics results are computed, not judged, with one exception: a printed reference that no index lists is read once by a model before it counts as a citation error. Claims are extracted by a model and kept only when their quote appears verbatim in the text; each cited source is then checked, with a model’s help, for whether it says what the claim relies on. Those verdicts can be wrong — read the claim’s quote and the cited source before relying on one.
A language model drew the claims from the paper on 2026-10-31, under version 3 of the claim definition (model deepseek-v4.1-flash, prompt extract-v3).
A second model labelled each claim on 2026-10-31 (model jev-1.13-20260917, definition revision gold-guideline-v0.2).
Cited sources are checked with a language model’s help (gpt-6-sol).
Statistics and arithmetic are recomputed, not judged.
Confidence bands are shown only for fields calibrated on our annotated test set. None is calibrated yet, so no band is shown.
What counts as a claim ›How we measure confidence ›How we check this ›
Are you an author, or do you see a problem with this page? Request a review
