

The DOI matches its Crossref record; 15 of the 15 references it cites were found in a registry or an index.
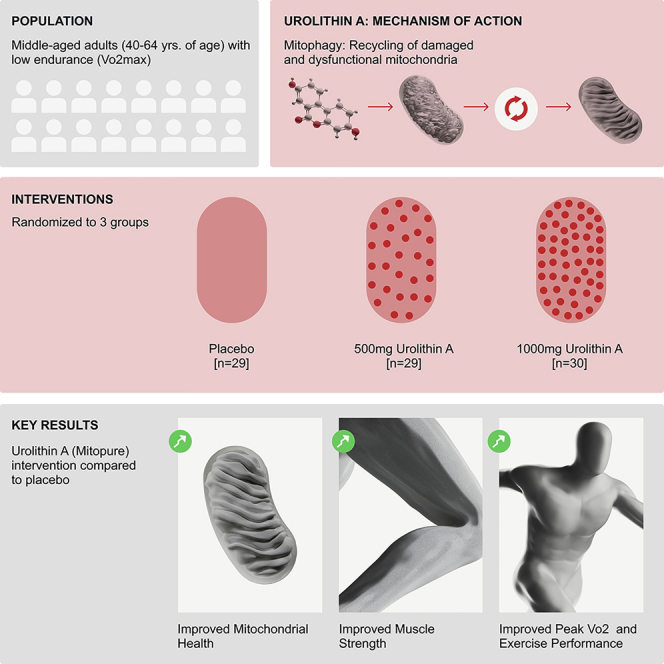
Urolithin A improves muscle strength, exercise performance, and biomarkers of mitochondrial health in a randomized trial in middle-aged adults
Overview
The claims and statistics of this paper haven’t been checked yet.
Run the check — free, no account needed. It reads the open-access text and checks the sources it cites.
Integrity signals
Registry
Cites
Statistics
Figures

Verification
Claims the paper makes
The claims and statistics of this paper haven’t been checked yet.
Run the check — free, no account needed. It reads the open-access text and checks the sources it cites.
Claims other papers make about this one
Each is checked against this paper’s own text: does it say what the citing paper says it does?
The source backs part of the claim, not all of it — or backs it for a different population, condition or comparison.
In the citing paper
“Moreover, a Phase 3 trial has revealed the capacity of urolithin A to improve muscle strength and to reduce C-reactive protein 129 .”
From Hallmarks of aging: An expanding universe (2023) · cites this paper as [129]
Experimental — accuracy not yet measuredThe source backs part of the claim, not all of it — or backs it for a different population, condition or comparison.
In the citing paper
“| | Human | Urolithin A to middle-aged adults (randomized Phase 2) | Improved aerobic endurance and physical performance; reduced plasma CRP | 129 |”
From Hallmarks of aging: An expanding universe (2023) · cites this paper as [129]
Experimental — accuracy not yet measuredThe source backs part of the claim, not all of it — or backs it for a different population, condition or comparison.
In the citing paper
“Urolithin A, which is converted from ellagitannins by gut bacteria and improves muscle strength and mass and was found to work in people between the ages of 65 and 90 years of age.”
From Three Tiers to biological escape velocity: The quest to outwit aging (2022) · cites this paper as [16]
Experimental — accuracy not yet measuredThe source backs part of the claim, not all of it — or backs it for a different population, condition or comparison.
In the citing paper
“Urolithin A has shown a capacity for mitophagy and mitogenesis”
From Three Tiers to biological escape velocity: The quest to outwit aging (2022) · cites this paper as [16]
Experimental — accuracy not yet measuredThe cited source says what the claim attributes to it.
In the citing paper
“Mitochondrial dysfunction has been associated with many forms of age‐related decline including muscle loss”
From Three Tiers to biological escape velocity: The quest to outwit aging (2022) · cites this paper as [16]
Self-check
Percentages, sums and reported differences re-computed from the paper’s own numbers.
The self-check needs the paper’s full text.
Citations
Cites
López-Otín, C., Blasco, M. A., Partridge, L., Serrano, M., & Kroemer, G. (2013) · Cell · doi:10.1016/j.cell.2013.05.039 · Cited by 14,982
Goodpaster, B. H., Park, S. W., Harris, T. B., Kritchevsky, S. B., Nevitt, M., Schwartz, A. V., Simonsick, E. M., Tylavsky, F. A., Visser, M., Newman, A. B., et al. (2006) · The Journals of Gerontology Series A: Biological Sciences and Medical Sciences · doi:10.1093/gerona/61.10.1059 · Cited by 3,083
Fang, E. F., Hou, Y., Palikaras, K., Adriaanse, B. A., Kerr, J. S., Yang, B., Lautrup, S., Hasan-Olive, M. M., Caponio, D., Dan, X., et al. (2019) · Nature Neuroscience · doi:10.1038/s41593-018-0332-9 · Cited by 1,740
The mitochondrial basis of aging
Sun, N., Youle, R. J., & Finkel, T. (2016) · Molecular Cell · doi:10.1016/j.molcel.2016.01.028 · Cited by 1,441
Kitzman, D. W., Brubaker, P., Morgan, T., Haykowsky, M., Hundley, G., Kraus, W. E., Eggebeen, J., & Nicklas, B. J. (2016) · JAMA · doi:10.1001/jama.2015.17346 · Cited by 921
Bohannon, R. W., & Crouch, R. (2017) · Journal of Evaluation in Clinical Practice · doi:10.1111/jep.12629 · Cited by 715 · cited 3×
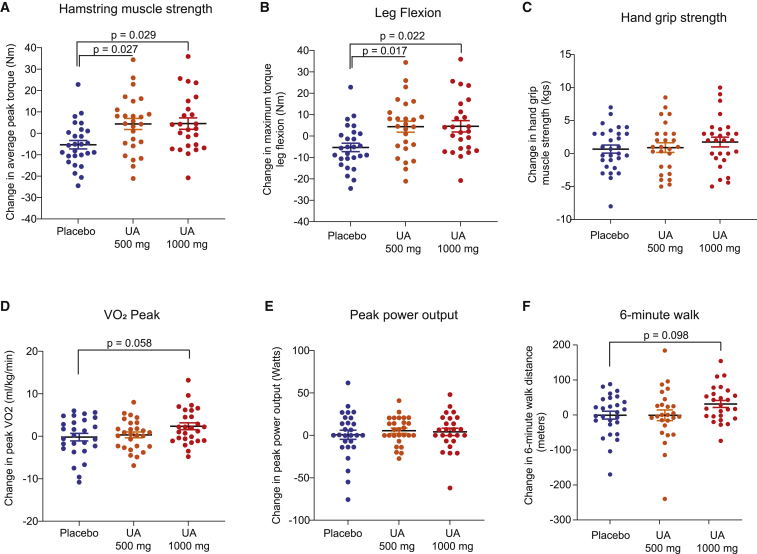
“It is particularly noteworthy that the group administered the high dose of UA (1,000 mg) increased their walking distance by >30 m during the 6MWT, as this reflects a clinically meaningful difference in mobility.(32) The fact that UA treatment improved the outcomes related to physical performance in the absence of any…”
BackgroundMethodInfluentialLópez-Otín, C., & Kroemer, G. (2021) · Cell · doi:10.1016/j.cell.2020.11.034 · Cited by 499
Elhassan, Y. S., Kluckova, K., Fletcher, R. S., Schmidt, M. S., Garten, A., Doig, C. L., Cartwright, D. M., Oakey, L., Burley, C. V., Jenkinson, N., et al. (2019) · Cell Reports · doi:10.1016/j.celrep.2019.07.043 · Cited by 448
Interleukin-6 and C-reactive protein, successful aging, and mortality: the PolSenior study
Puzianowska-Kuźnicka, M., Owczarz, M., Wieczorowska-Tobis, K., Nadrowski, P., Chudek, J., Slusarczyk, P., Skalska, A., Jonas, M., Franek, E., & Mossakowska, M. (2016) · Immunity & Ageing · doi:10.1186/s12979-016-0076-x · Cited by 445
Migliavacca, E., Tay, S. K. H., Patel, H. P., Sonntag, T., Civiletto, G., McFarlane, C., Forrester, T., Barton, S. J., Leow, M. K., Antoun, E., et al. (2019) · Nature Communications · doi:10.1038/s41467-019-13694-1 · Cited by 365
Meex, R. C. R., Schrauwen-Hinderling, V. B., Moonen-Kornips, E., Schaart, G., Mensink, M., Phielix, E., van de Weijer, T., Sels, J.-P., Schrauwen, P., & Hesselink, M. K. C. (2010) · Diabetes · doi:10.2337/db09-1322 · Cited by 355
Coen, P. M., Jubrias, S. A., Distefano, G., Amati, F., Mackey, D. C., Glynn, N. W., Manini, T. M., Wohlgemuth, S. E., Leeuwenburgh, C., Cummings, S. R., et al. (2013) · The Journals of Gerontology: Series A · doi:10.1093/gerona/gls196 · Cited by 323
Resistance exercise training alters mitochondrial function in human skeletal muscle
PORTER, C., REIDY, P. T., BHATTARAI, N., SIDOSSIS, L. S., & RASMUSSEN, B. B. (2015) · Medicine & Science in Sports & Exercise · doi:10.1249/mss.0000000000000605 · Cited by 288
Dollerup, O. L., Chubanava, S., Agerholm, M., Søndergård, S. D., Altıntaş, A., Møller, A. B., Høyer, K. F., Ringgaard, S., Stødkilde‐Jørgensen, H., Lavery, G. G., et al. (2020) · The Journal of Physiology · doi:10.1113/jp278752 · Cited by 145
Santanasto, A. J., Coen, P. M., Glynn, N. W., Conley, K. E., Jubrias, S. A., Amati, F., Strotmeyer, E. S., Boudreau, R. M., Goodpaster, B. H., & Newman, A. B. (2016) · Experimental Gerontology · doi:10.1016/j.exger.2016.04.002 · Cited by 47
Research works printed but not linked: 54
- Denison, 2015, Prevention and optimal management of sarcopenia: a review of combined exercise and nutrition interventions to improve muscle outcomes in older people, Clin. Interventions Aging, 10, 859
- Kwak, 2019, Pharmacological interventions for treatment of sarcopenia: current status of drug development for sarcopenia, Ann. Geriatr. Med. Res., 23, 98, 10.4235/agmr.19.0028 · DOI · Paper page
- Siparsky, 2014, Muscle changes in aging, Sports Health, 6, 36, 10.1177/1941738113502296 · DOI
- Di Lorito, 2021, Exercise interventions for older adults: a systematic review of meta-analyses, J. Sport Health Sci., 10, 29, 10.1016/j.jshs.2020.06.003 · DOI
- Kell, 2019, Increasing exercise frequency is associated with health and quality-of-life benefits for older adults, Qual. Life Res., 28, 3267, 10.1007/s11136-019-02264-z · DOI
- Jacobs, 2013, Improvements in exercise performance with high-intensity interval training coincide with an increase in skeletal muscle mitochondrial content and function, J. Appl. Physiol., 115, 785, 10.1152/japplphysiol.00445.2013 · DOI
- Balan, 2019, Regular endurance exercise promotes fission, mitophagy, and oxidative phosphorylation in human skeletal muscle independently of age, Front. Physiol., 10, 1088, 10.3389/fphys.2019.01088 · DOI · Paper page
- Lo Verso, 2014, Autophagy is not required to sustain exercise and PRKAA1/AMPK activity but is important to prevent mitochondrial damage during physical activity, Autophagy, 10, 1883, 10.4161/auto.32154 · DOI · Paper page
- Tomás-Barberán, 2017, Urolithins, the rescue of “old” metabolites to understand a “new” concept: metabotypes as a nexus among phenolic metabolism, microbiota dysbiosis, and host health status, Mol. Nutr. Food Res., 61, 1500901, 10.1002/mnfr.201500901 · DOI · Paper page
- Espín, 2013, Biological significance of Urolithins, the gut microbial ellagic acid-derived metabolites: the evidence so far, Evidence-Based Complement. Altern. Med., 2013, e270418, 10.1155/2013/270418 · DOI · Paper page
- D’Amico, 2021, Impact of the natural compound urolithin A on health, disease, and aging, Trends Mol. Med., 27, 687, 10.1016/j.molmed.2021.04.009 · DOI · Paper page
- Ryu, 2016, Urolithin A induces mitophagy and prolongs lifespan in C. elegans and increases muscle function in rodents, Nat. Med., 22, 879, 10.1038/nm.4132 · DOI · Paper page
- Xia, 2020, Urolithin A exerts antiobesity effects through enhancing adipose tissue thermogenesis in mice, PLOS Biol., 18, e3000688, 10.1371/journal.pbio.3000688 · DOI
- Luan, 2021, Urolithin A improves muscle function by inducing mitophagy in muscular dystrophy, Sci. Transl. Med., 13, eabb0319, 10.1126/scitranslmed.abb0319 · DOI
- Savi, 2017, In vivo administration of urolithin A and B prevents the occurrence of cardiac dysfunction in streptozotocin-induced diabetic rats, Cardiovasc. Diabetol., 16, 80, 10.1186/s12933-017-0561-3 · DOI
- Tang, 2017, Urolithin A alleviates myocardial ischemia/reperfusion injury via PI3K/Akt pathway, Biochem. Biophys. Res. Commun., 486, 774, 10.1016/j.bbrc.2017.03.119 · DOI
- Fu, 2019, Urolithin A targets the PI3K/Akt/NF-κB pathways and prevents IL-1β-induced inflammatory response in human osteoarthritis: in vitro and in vivo studies, Food Funct., 10, 6135, 10.1039/C9FO01332F · DOI
- Singh, 2019, Enhancement of the gut barrier integrity by a microbial metabolite through the Nrf2 pathway, Nat. Commun., 10, 89, 10.1038/s41467-018-07859-7 · DOI · Paper page
- Guada, 2017, Urolithin A mitigates cisplatin-induced nephrotoxicity by inhibiting renal inflammation and apoptosis in an experimental rat model, J. Pharmacol. Exp. Ther., 363, 58, 10.1124/jpet.117.242420 · DOI
- Zou, 2019, Oral delivery of nanoparticle urolithin A normalizes cellular stress and improves survival in mouse model of cisplatin-induced AKI, Am. J. Physiol. Renal Physiol., 317, F1255, 10.1152/ajprenal.00346.2019 · DOI
- Jing, 2019, Protective effect of urolithin a on cisplatin-induced nephrotoxicity in mice via modulation of inflammation and oxidative stress, Food Chem. Toxicol., 129, 108, 10.1016/j.fct.2019.04.031 · DOI
- Andreux, 2019, The mitophagy activator urolithin A is safe and induces a molecular signature of improved mitochondrial and cellular health in humans, Nat. Metab., 1, 595, 10.1038/s42255-019-0073-4 · DOI · Paper page
- Liu, 2022, Effect of urolithin A supplementation on muscle endurance and mitochondrial health in older adults: a randomized clinical trial, JAMA Netw. Open, 5, e2144279, 10.1001/jamanetworkopen.2021.44279 · DOI · Paper page
- Reginster, 2021, Update on the ESCEO recommendation for the conduct of clinical trials for drugs aiming at the treatment of sarcopenia in older adults, Aging Clin. Exp. Res., 33, 3, 10.1007/s40520-020-01663-4 · DOI
- Perera, 2006, Meaningful change and responsiveness in common physical performance measures in older adults, J. Am. Geriatr. Soc., 54, 743, 10.1111/j.1532-5415.2006.00701.x · DOI · Paper page
- Schooneman, 2013, Acylcarnitines, Diabetes, 62, 1, 10.2337/db12-0466 · DOI · Paper page
- Lassale, 2019, Association of 10-year C-reactive protein trajectories with markers of healthy aging: findings from the English longitudinal study of aging, J. Gerontol. A. Biol. Sci. Med. Sci., 74, 195, 10.1093/gerona/gly028 · DOI
- Visser, 1999, Elevated C-reactive protein levels in overweight and obese adults, JAMA, 282, 2131, 10.1001/jama.282.22.2131 · DOI · Paper page
- Robinson, 2017, Enhanced protein translation underlies improved metabolic and physical adaptations to different exercise training modes in young and old humans, Cell Metab., 25, 581, 10.1016/j.cmet.2017.02.009 · DOI · Paper page
- Ubaida-Mohien, 2019, Discovery proteomics in aging human skeletal muscle finds change in spliceosome, immunity, proteostasis and mitochondria, eLife, 8, e49874, 10.7554/eLife.49874 · DOI
- Miller, 2016, The rigorous study of exercise adaptations: why mRNA might not be enough, J. Appl. Physiol., 121, 594, 10.1152/japplphysiol.00137.2016 · DOI
- Murgia, 2017, Single muscle fiber proteomics reveals fiber-type-specific features of human muscle aging, Cell Rep., 19, 2396, 10.1016/j.celrep.2017.05.054 · DOI · Paper page
- Geisler, 2014, The ubiquitin-conjugating enzymes UBE2N, UBE2L3 and UBE2D2/3 are essential for Parkin-dependent mitophagy, J. Cell Sci, 127, 3280
- Scott, 2020, A dual druggable genome-wide siRNA and compound library screening approach identifies modulators of parkin recruitment to mitochondria, J. Biol. Chem., 295, 3285, 10.1074/jbc.RA119.009699 · DOI
- Schiaffino, 2011, Fiber types in mammalian skeletal muscles, Physiol. Rev., 91, 1447, 10.1152/physrev.00031.2010 · DOI · Paper page
- Bournat, 2010, Mitochondrial dysfunction in obesity, Curr. Opin. Endocrinol. Diabetes Obes., 17, 446, 10.1097/MED.0b013e32833c3026 · DOI
- Geirsdottir, 2015, Muscular strength and physical function in elderly adults 6–18 months after a 12-week resistance exercise program, Scand. J. Public Health, 43, 76, 10.1177/1403494814560842 · DOI
- Mueller, 2021, Effect of high-intensity interval training, moderate continuous training, or guideline-based physical activity advice on peak oxygen consumption in patients with heart failure with preserved ejection fraction: a randomized clinical trial, JAMA, 325, 542, 10.1001/jama.2020.26812 · DOI · Paper page
- Palikaras, 2018, Mechanisms of mitophagy in cellular homeostasis, physiology and pathology, Nat. Cell Biol., 20, 1013, 10.1038/s41556-018-0176-2 · DOI
- Hussey, 2013, Effect of exercise on the skeletal muscle proteome in patients with type 2 diabetes, Med. Sci. Sports Exerc., 45, 1069, 10.1249/MSS.0b013e3182814917 · DOI
- McCann, 2021, L-carnitine and acylcarnitines: mitochondrial biomarkers for precision medicine, Metabolites, 11, 51, 10.3390/metabo11010051 · DOI
- Darst, 2019, Longitudinal plasma metabolomics of aging and sex, Aging (Albany NY), 11, 1262, 10.18632/aging.101837 · DOI
- Thompson Legault, 2015, A metabolic signature of mitochondrial dysfunction revealed through a monogenic form of leigh syndrome, Cell Rep., 13, 981, 10.1016/j.celrep.2015.09.054 · DOI
- Felder, 2017, Specific circulating phospholipids, acylcarnitines, amino acids and biogenic amines are aerobic exercise markers, J. Sci. Med. Sport, 20, 700, 10.1016/j.jsams.2016.11.011 · DOI
- Zampino, 2020, Poor mitochondrial health and systemic inflammation? Test of a classic hypothesis in the Baltimore Longitudinal Study of Aging, GeroScience, 42, 1175, 10.1007/s11357-020-00208-x · DOI · Paper page
- Franceschi, 2018, Inflammaging: a new immune–metabolic viewpoint for age-related diseases, Nat. Rev. Endocrinol., 14, 576, 10.1038/s41574-018-0059-4 · DOI · Paper page
- Reid, 2021, The interplay of mitophagy and inflammation in Duchenne muscular dystrophy, Life, 11, 648, 10.3390/life11070648 · DOI
- Remels, 2013, Regulation of skeletal muscle oxidative phenotype by classical NF-κB signalling, Biochim. Biophys. Acta (Bba) - Mol. Basis Dis., 1832, 1313, 10.1016/j.bbadis.2013.03.018 · DOI
- Tharakan, 2021, Ribosome profiling analysis of human skeletal muscle identifies reduced translation of mitochondrial proteins with age, RNA Biol., 18, 1555, 10.1080/15476286.2021.1875647 · DOI
- Milburn, 2013, Application of metabolomics to diagnosis of insulin resistance, Annu. Rev. Med., 64, 291, 10.1146/annurev-med-061511-134747 · DOI
- Love, 2014, Moderated estimation of fold change and dispersion for RNA-seq data with DESeq2, Genome Biol., 15, 550, 10.1186/s13059-014-0550-8 · DOI · Paper page
- Yu, 2012, clusterProfiler: an R Package for comparing biological themes among gene clusters, OMICS: A J. Integr. Biol., 16, 284, 10.1089/omi.2011.0118 · DOI · Paper page
- Kelstrup, 2018, Performance evaluation of the Q exactive HF-X for shotgun proteomics, J. Proteome Res., 17, 727, 10.1021/acs.jproteome.7b00602 · DOI
- Bruderer, 2017, Optimization of experimental parameters in data-independent mass spectrometry significantly increases depth and reproducibility of results, Mol. Cell Proteomics, 16, 2296, 10.1074/mcp.RA117.000314 · DOI
Cited by
Sorted by citations
Hallmarks of aging: An expanding universe
López-Otín, C., Blasco, M. A., Partridge, L., Serrano, M., & Kroemer, G. (2023) · Cell · doi:10.1016/j.cell.2022.11.001 · Cited by 6,549
Mitophagy in human health, ageing and disease
Picca, A., Faitg, J., Auwerx, J., Ferrucci, L., & D’Amico, D. (2023) · Nature Metabolism · doi:10.1038/s42255-023-00930-8 · Cited by 635
Self-citationPostbiotics as potential new therapeutic agents for sepsis
Lou, X., Xue, J., Shao, R., Mo, C., Wang, F., & Chen, G. (2023) · Burns & Trauma · doi:10.1093/burnst/tkad022 · Cited by 38
Three Tiers to biological escape velocity: The quest to outwit aging
Palmer, R. D. (2022) · AGING MEDICINE · doi:10.1002/agm2.12231 · Cited by 2
Metadata
- Authors
- Singh, A., D’Amico, D., Andreux, P. A., Fouassier, A. M., Blanco-Bose, W., Evans, M., Aebischer, P., Auwerx, J., & Rinsch, C.
- ORCID
- Singh, Anurag
- Venue
- Cell Reports Medicine
- Publisher
- Elsevier BV
- Published
- 2022-05
- Volume
- 3
- Issue
- 5
- Pages
- 100633
- ISSN
- 2666-3791
- PMC
- PMC9133463
- Cited by
- 256
- References
- 15
- Language
- en
About these checks
Registry, retraction, Cites and statistics results are computed, not judged, with one exception: a printed reference that no index lists is read once by a model before it counts as a citation error. Claims are extracted by a model and kept only when their quote appears verbatim in the text; each cited source is then checked, with a model’s help, for whether it says what the claim relies on. Those verdicts can be wrong — read the claim’s quote and the cited source before relying on one.
Statistics and arithmetic are recomputed, not judged.
Confidence bands are shown only for fields calibrated on our annotated test set. None is calibrated yet, so no band is shown.
What counts as a claim ›How we measure confidence ›How we check this ›
Are you an author, or do you see a problem with this page? Request a review
