Cited by 42

The DOI matches its Crossref record; 5 of the 5 references it cites were found in a registry or an index.

Systemic delivery of antagomirs during blood-brain barrier disruption is disease-modifying in experimental epilepsy

Reschke, Cristina R., Silva, Luiz F.A., Vangoor, Vamshidhar R., Rosso, Massimo, David, Bastian, Cavanagh, Brenton L., Connolly, Niamh M.C., Brennan, Gary P., Sanz-Rodriguez, Amaya, Mooney, Catherine, Batool, Aasia, Greene, Chris, Brennan, Marian, Conroy, Ronan M., Rüber, Theodor, Prehn, Jochen H.M., Campbell, Matthew, Pasterkamp, R. Jeroen, Henshall, David C.·2021·Molecular Therapy

Overview

The claims and statistics of this paper haven’t been checked yet.

Run the check — free, no account needed. It reads the open-access text and checks the sources it cites.

A few free checks a day · papers already verified open instantly · results are public

Integrity signals

Registry

Crossref · 10.1016/j.ymthe.2021.02.021

Cites

5 of 5 references verified0 citation errors · 0 not checkable

Statistics

Figures

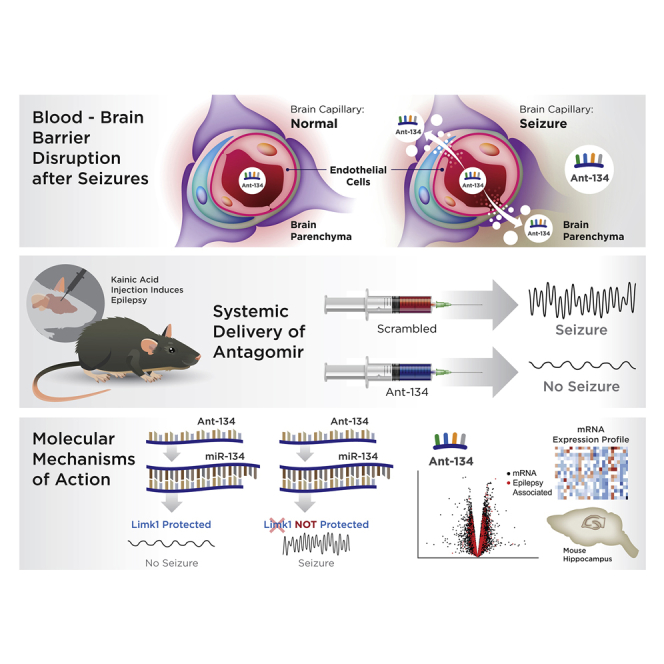
Graphical abstract
Graphical abstract CC BY-NC-ND · PubMed Central
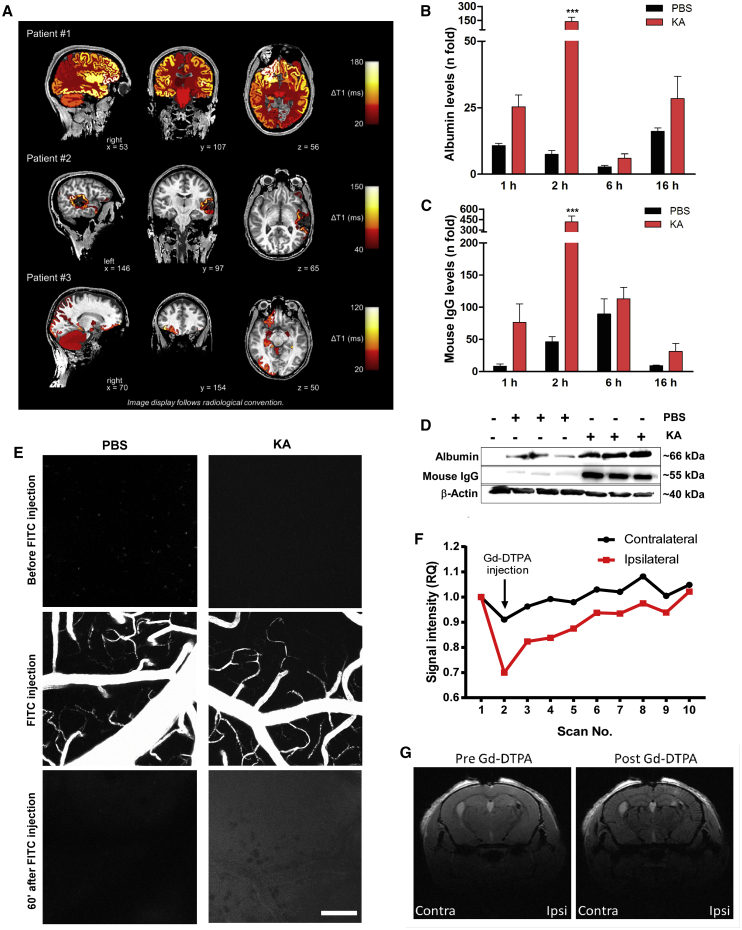
Figure 1 Blood-brain barrier (BBB) disruption in epilepsy patients and after KA-induced SE in mice (A) BBB dysfunction after seizures in three epilepsy patients undergoing inpatient monitoring as part of their presurgical evaluation (#1, male, 24 years old; #2, male, 34 years old; #3: female, 34 years old). ΔT1 indicates postictal enhancement of gadolinium-based contrast agent. ΔT1 was computed by subtracting postictal quantitative T1 relaxation time maps (qT1) from interictal qT1. Higher ΔT1 values therefore reflect a greater postictal enhancement of contrast agent. ΔT1 values were color-coded and colored labels were superimposed on the anatomical brain volume. Patient #1 showed secondarily generalized tonic-clonic seizure, non-lesional MRI, and ictal EEG onset: right frontal; presumed seizure onset zone: right frontal. Patient #2 showed a focal seizure, MRI: resected cavernoma in left temporal lobe and post-operative epileptic seizures; ictal EEG onset: left temporal; presumed seizure onset zone: left temporal lesion. Patient #3 showed a focal seizure, MRI: focal lesion in right olfactory sulcus; ictal EEG onset: right frontal; presumed seizure onset zone: right olfactory sulcus. (B–G) BBB disruption after KA-induced SE in mice. (B–D) Graphs (data are mean ± SEM) and representative immunoblots (D) show levels (relative to ipsilateral hippocampi of naive mice) of albumin (B) or IgG (C) in the brain after KA or PBS injection. Two-way ANOVA: ∗∗∗p < 0.001. (E) Two-photon images taken 5 min before and 60 min after systemic injection of a 10-kDa FITC-dextran. Note increased intensity 1 h after FITC-dextran injection in SE mice. The z stack images were acquired every 60 s using an upright Carl Zeiss LSM 710 NLO and Zen 2008. A Coherent Chameleon Vision II laser operating at 780 nm with 40.0% laser power (64 MW at sample) and a 500- to 550-nm emission band-pass filter was used for excitation and detection. Scale bar, 100 μm. (F and G) Contrast-enhanced MRI analysis of clearance rates of Gd-DTPA (742 Da) in hippocampal regions after tail vein injection of the contrast agent, 2 h after SE. (F) Graph showing changes in Gd-DTPA clearance between contralateral (contra) and ipsilateral (ipsi) hemispheres (n = 10 for scan replications before and after injection in the same mouse). (G) Representative MRI images depicting ipsilateral and contralateral brain hemispheres before and after Gd-DTPA injection. Data are mean ± SEM.
Figure 1 Blood-brain barrier (BBB) disruption in epilepsy patients and after KA-induced SE in mice (A) BBB dysfunction after seizures in three epilepsy patients undergoing inpatient monitoring as part of their presurgical evaluation (#1, male, 24 years old; #2, male, 34 years old; #3: female, 34 years old). ΔT1 indicates postictal enhancement of gadolinium-based contrast agent. ΔT1 was computed by subtracting postictal quantitative T1 relaxation time maps (qT1) from interictal qT1. Higher ΔT1 values therefore reflect a greater postictal enhancement of contrast agent. ΔT1 values were color-coded and colored labels were superimposed on the anatomical brain volume. Patient #1 showed secondarily generalized tonic-clonic seizure, non-lesional MRI, and ictal EEG onset: right frontal; presumed seizure onset zone: right frontal. Patient #2 showed a focal seizure, MRI: resected cavernoma in left temporal lobe and post-operative epileptic seizures; ictal EEG onset: left temporal; presumed seizure onset zone: left temporal lesion. Patient #3 showed a focal seizure, MRI: focal lesion in right olfactory sulcus; ictal EEG onset: right frontal; presumed seizure onset zone: right olfactory sulcus. (B–G) BBB disruption after KA-induced SE in mice. (B–D) Graphs (data are mean ± SEM) and representative immunoblots (D) show levels (relative to ipsilateral hippocampi of naive mice) of albumin (B) or IgG (C) in the brain after KA or PBS injection. Two-way ANOVA: ∗∗∗p < 0.001. (E) Two-photon images taken 5 min before and 60 min after systemic injection of a 10-kDa FITC-dextran. Note increased intensity 1 h after FITC-dextran injection in SE mice. The z stack images were acquired every 60 s using an upright Carl Zeiss LSM 710 NLO and Zen 2008. A Coherent Chameleon Vision II laser operating at 780 nm with 40.0% laser power (64 MW at sample) and a 500- to 550-nm emission band-pass filter was used for excitation and detection. Scale bar, 100 μm. (F and G) Contrast-enhanced MRI analysis of clearance rates of Gd-DTPA (742 Da) in hippocampal regions after tail vein injection of the contrast agent, 2 h after SE. (F) Graph showing changes in Gd-DTPA clearance between contralateral (contra) and ipsilateral (ipsi) hemispheres (n = 10 for scan replications before and after injection in the same mouse). (G) Representative MRI images depicting ipsilateral and contralateral brain hemispheres before and after Gd-DTPA injection. Data are mean ± SEM.CC BY-NC-ND · PubMed Central
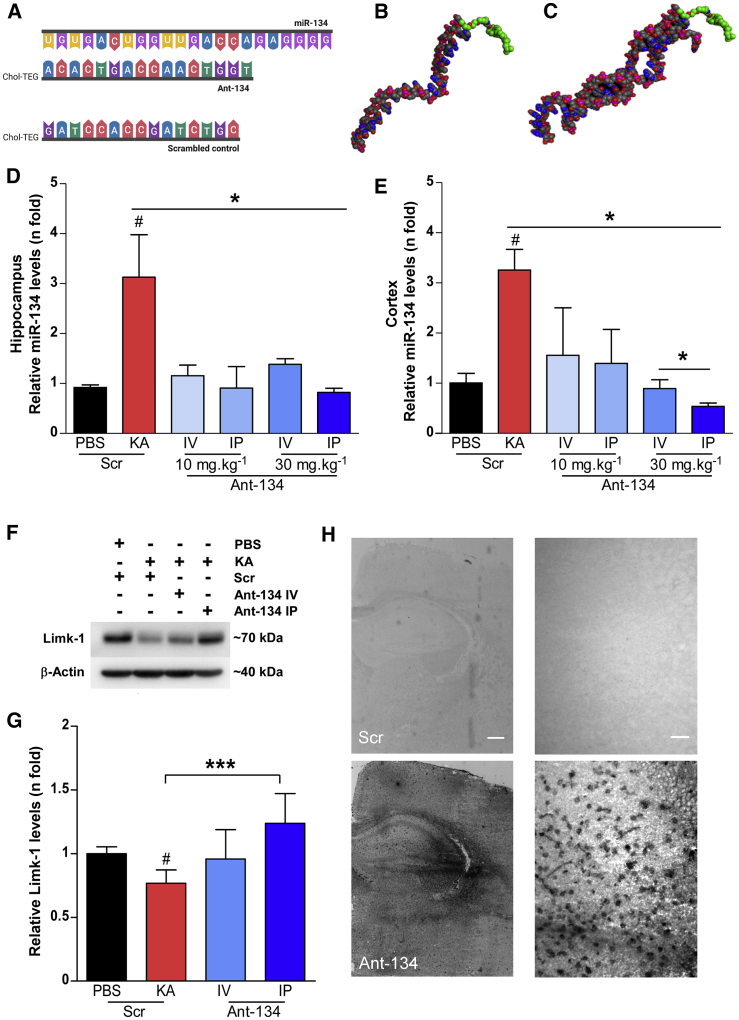
Figure 2 Seizure-facilitated entry of Ant-134 into the mouse brain after systemic injection (A) Schematic of the ASO sequences of miR-134, Ant-134, and Scr (from top to bottom). (B and C) Predicted models of Ant-134 (B) and the dimer of Ant-134 with miR-134 (C) generated using Molecular Operating Environment, CCG Montreal. Carbon atoms are depicted in gray, oxygen in red, nitrogen atoms in blue, and phosphorous atoms in pink. The carbons in the Chol-TEG (cholesterol moiety via a tetraethylene glycol) tag are colored green. (D and E) Levels of miR-134 in the ipsilateral hippocampus (D) and cortex (E) of mice that were systemically injected with Ant-134 or Scr (10 or 30 mg/kg; i.p. or i.v.) at 2 h after KA-induced SE compared to PBS-Scr control mice. ANOVA: ∗p < 0.05 (n = 3–6/group). (F and G) Representative immunoblot and graph show Ant-134 (30 mg/kg) systemically administered by i.p. injection prevented the expected reduction of Limk-1 protein levels by KA-induced SE. Data were normalized to β-actin. ANOVA: #p < 0.05 compared to PBS, ∗∗∗p < 0.001. (H) Representative images depict the presence of Ant-134 in the mouse brain 24 h after i.p. injection (30 mg/kg; bottom panel). Scr inhibitor probe was used as a negative control. Scale bars represent 400 and 25 μm for original magnifications ×2.5 (left) and ×40 (right), respectively. See also Figures S1A–S1C. Data are mean ± SEM.
Figure 2 Seizure-facilitated entry of Ant-134 into the mouse brain after systemic injection (A) Schematic of the ASO sequences of miR-134, Ant-134, and Scr (from top to bottom). (B and C) Predicted models of Ant-134 (B) and the dimer of Ant-134 with miR-134 (C) generated using Molecular Operating Environment, CCG Montreal. Carbon atoms are depicted in gray, oxygen in red, nitrogen atoms in blue, and phosphorous atoms in pink. The carbons in the Chol-TEG (cholesterol moiety via a tetraethylene glycol) tag are colored green. (D and E) Levels of miR-134 in the ipsilateral hippocampus (D) and cortex (E) of mice that were systemically injected with Ant-134 or Scr (10 or 30 mg/kg; i.p. or i.v.) at 2 h after KA-induced SE compared to PBS-Scr control mice. ANOVA: ∗p < 0.05 (n = 3–6/group). (F and G) Representative immunoblot and graph show Ant-134 (30 mg/kg) systemically administered by i.p. injection prevented the expected reduction of Limk-1 protein levels by KA-induced SE. Data were normalized to β-actin. ANOVA: #p < 0.05 compared to PBS, ∗∗∗p < 0.001. (H) Representative images depict the presence of Ant-134 in the mouse brain 24 h after i.p. injection (30 mg/kg; bottom panel). Scr inhibitor probe was used as a negative control. Scale bars represent 400 and 25 μm for original magnifications ×2.5 (left) and ×40 (right), respectively. See also Figures S1A–S1C. Data are mean ± SEM.CC BY-NC-ND · PubMed Central
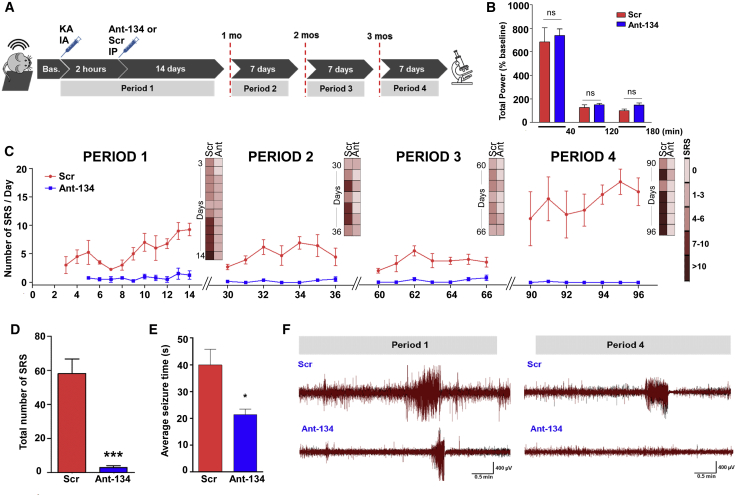
Figure 3 Potent and long-lasting anti-seizure effects of systemic Ant-134 in mice (A) Experimental design for long-term epilepsy monitoring studies in mice using a telemetric EEG system. After baseline (Bas.) EEG recording, SE was triggered by an intraamygdala (IA) injection of KA and followed by an injection of lorazepam after 40 min. Two hours later, mice were injected with Ant-134 or Scr control (i.p., 30 mg/kg, 10 mL/kg). Continuous EEG data were then collected for 14 consecutive days (sampling epoch called period 1) and again for 7 days at exactly 1 month (period 2), 2 months (period 3), and 3 months (period 4) after SE. (B) No differences (ns, non-significant) were observed in the severity of the KA-induced SE prior to and soon after Ant-134 or Scr injection. The x axis plots time (in minutes) after SE between KA and lorazepam injections; between lorazepam and Ant-134/Scr injection; and up to 1 h after Ant-134 or Scr i.p. injection. (C) Graph shows the number of spontaneous recurrent seizures (SRSs) per day per treatment group over time (periods 1–4), depicting the total number of seizures per group per EEG activation period. (D and E) Graphs show (D) the overall reduction of SRSs (t test; ***p < 0.001) and (E) the average duration of SRSs in Ant-134 compared to Scr mice (t test; *p = 0.042) covering the entire monitoring period. (F) Representative EEG traces depict SRSs at the last day of recording for period 1 (left) and period 4 (right) for Scr- (top) or Ant-134-treated mice (bottom). Note that the Ant-134 (period 4) EEG trace is similar to Bas. recordings. Data are from n = 5 (Scr) and 6 (Ant-134) (period 1), with the final period data from n = 4 (Scr) and 5 (Ant-134). See also Figures S2A and S2B. Data are mean ± SEM.
Figure 3 Potent and long-lasting anti-seizure effects of systemic Ant-134 in mice (A) Experimental design for long-term epilepsy monitoring studies in mice using a telemetric EEG system. After baseline (Bas.) EEG recording, SE was triggered by an intraamygdala (IA) injection of KA and followed by an injection of lorazepam after 40 min. Two hours later, mice were injected with Ant-134 or Scr control (i.p., 30 mg/kg, 10 mL/kg). Continuous EEG data were then collected for 14 consecutive days (sampling epoch called period 1) and again for 7 days at exactly 1 month (period 2), 2 months (period 3), and 3 months (period 4) after SE. (B) No differences (ns, non-significant) were observed in the severity of the KA-induced SE prior to and soon after Ant-134 or Scr injection. The x axis plots time (in minutes) after SE between KA and lorazepam injections; between lorazepam and Ant-134/Scr injection; and up to 1 h after Ant-134 or Scr i.p. injection. (C) Graph shows the number of spontaneous recurrent seizures (SRSs) per day per treatment group over time (periods 1–4), depicting the total number of seizures per group per EEG activation period. (D and E) Graphs show (D) the overall reduction of SRSs (t test; ***p < 0.001) and (E) the average duration of SRSs in Ant-134 compared to Scr mice (t test; *p = 0.042) covering the entire monitoring period. (F) Representative EEG traces depict SRSs at the last day of recording for period 1 (left) and period 4 (right) for Scr- (top) or Ant-134-treated mice (bottom). Note that the Ant-134 (period 4) EEG trace is similar to Bas. recordings. Data are from n = 5 (Scr) and 6 (Ant-134) (period 1), with the final period data from n = 4 (Scr) and 5 (Ant-134). See also Figures S2A and S2B. Data are mean ± SEM.CC BY-NC-ND · PubMed Central
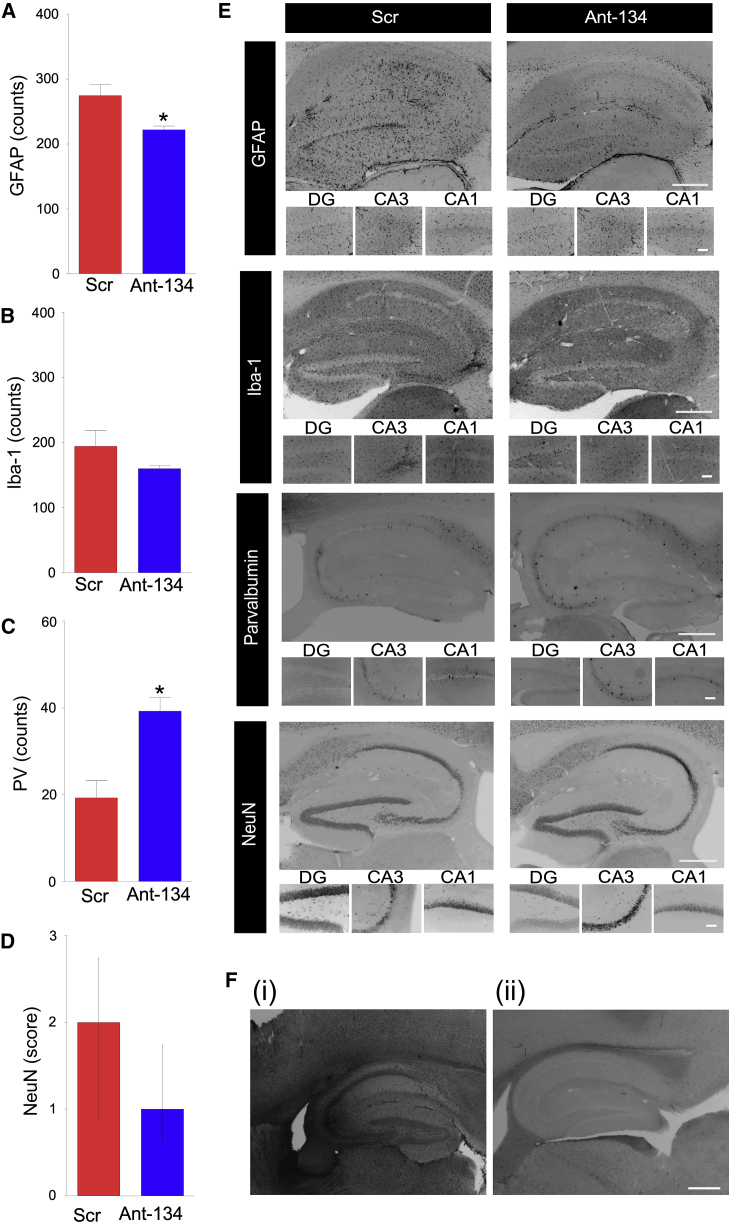
Figure 4 Histological findings in Ant-134-treated mice (A–E) Graphs (A–D) and representative images (E) of brains obtained at the end of long-term epilepsy monitoring stained for (A) GFAP (astrocytic marker), (B) Iba-1 (microglia), (C) parvalbumin (PV; a marker for GABAergic interneurons), and (D) NeuN (broad neuronal marker). Positive cells were quantified per hippocampal subfield and were the average of two adjacent sections by an observer blinded to the experimental treatment. n = 4 (Scr), n = 5 (Ant-134). ∗p < 0.05 compared to Scr. Neuronal damage (NeuN) was assessed based on a graded 5-point system under ×40 magnification: level 0, no damage; level 1, 0%–25%; level 2, 25%–50%; level 3, 50%–75%; level 5, 75% or more cell loss. (E) Representative images of each cellular marker show the whole ipsilateral hippocampus (original magnification, ×5; top) and hippocampal sub-regions (DG, CA3, and CA1; original magnification, ×20; bottom). (F) Representative ISH images depict (i) Ant-134 signal in the brain at 24 h after SE in a mouse injected with Ant-134, and (ii) the lack of Ant-134 signal in the brain of an Ant-134-injected SE mouse at the end of epilepsy monitoring. Scale bar represents 400 μm for original magnifications of ×2.5. Data are mean ± SEM except in (D), which are median and interquartile range.
Figure 4 Histological findings in Ant-134-treated mice (A–E) Graphs (A–D) and representative images (E) of brains obtained at the end of long-term epilepsy monitoring stained for (A) GFAP (astrocytic marker), (B) Iba-1 (microglia), (C) parvalbumin (PV; a marker for GABAergic interneurons), and (D) NeuN (broad neuronal marker). Positive cells were quantified per hippocampal subfield and were the average of two adjacent sections by an observer blinded to the experimental treatment. n = 4 (Scr), n = 5 (Ant-134). ∗p < 0.05 compared to Scr. Neuronal damage (NeuN) was assessed based on a graded 5-point system under ×40 magnification: level 0, no damage; level 1, 0%–25%; level 2, 25%–50%; level 3, 50%–75%; level 5, 75% or more cell loss. (E) Representative images of each cellular marker show the whole ipsilateral hippocampus (original magnification, ×5; top) and hippocampal sub-regions (DG, CA3, and CA1; original magnification, ×20; bottom). (F) Representative ISH images depict (i) Ant-134 signal in the brain at 24 h after SE in a mouse injected with Ant-134, and (ii) the lack of Ant-134 signal in the brain of an Ant-134-injected SE mouse at the end of epilepsy monitoring. Scale bar represents 400 μm for original magnifications of ×2.5. Data are mean ± SEM except in (D), which are median and interquartile range.CC BY-NC-ND · PubMed Central
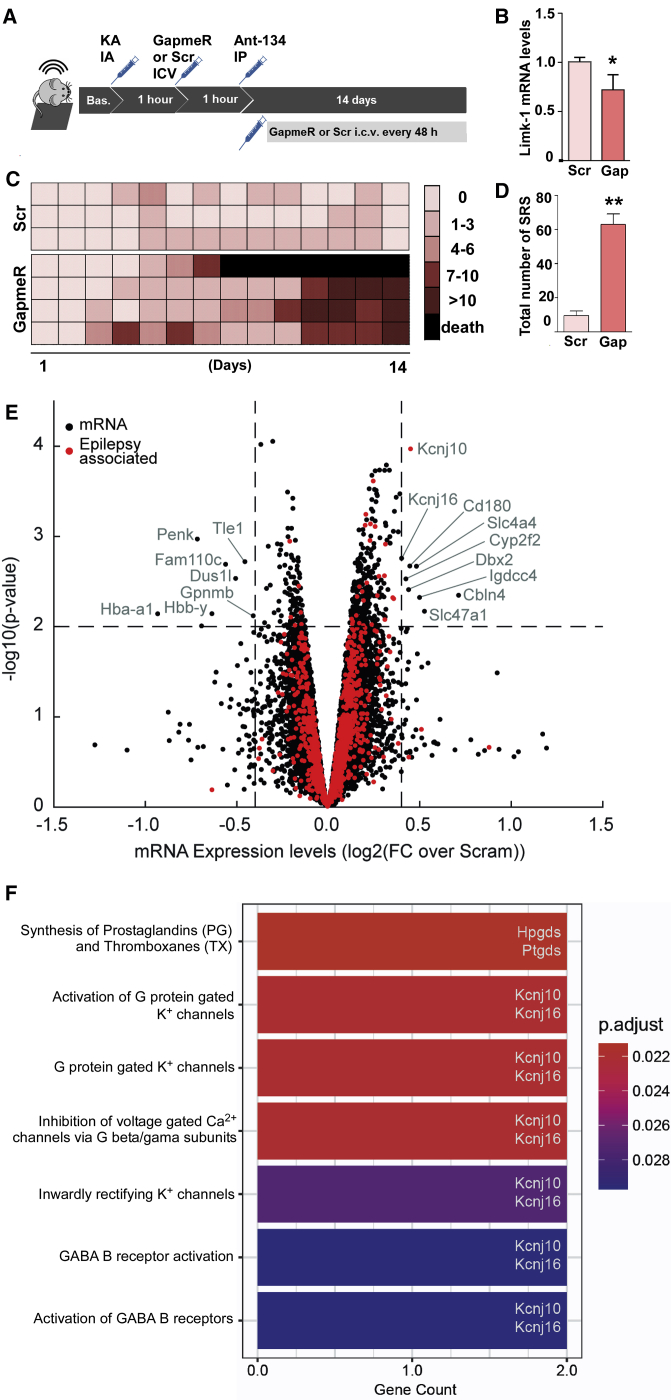
Figure 5 Molecular effects and mechanism of Ant-134 (A) Mice were equipped with telemetry devices, underwent intra-amygdala KA-induced SE, and 1 h later were intracerebroventricularly (i.c.v.) injected with the first dose of an ASO gapmer to silence Limk-1 mRNA (called Gap; n = 4; 0.01 nmol/2 μL) or its scramble negative control (called Scr; n = 3; 0.01 nmol/2 μL). One more hour after (2 h after SE), all mice were systemically injected with Ant-134 (30 mg/kg, i.p.). Long-term EEG was continued for 2 weeks, and mice received i.c.v. doses of gapmer or Scr every 48 h for the overall recording time (total of seven administrations on experimental days 1, 3, 5, 7, 9, 11, and 13). (B) Reduction of Limk-1 mRNA in the mouse hippocampus 24 h after a single gapmer injection in comparison with Scr control (n = 3/group; t test; ∗p < 0.05). (C) Individual SRS counts per day for Ant-134 mice that received either gapmer or Scr. Each line represents data from the same mouse over time, and each row represents the seizure counts for the respective day of EEG recording. (D) Total number of SRSs over 2 weeks of EEG recordings comparing Ant-134 + Scr mice to Ant-134 + gapmer mice (n = 3/group; the mouse that died was excluded for statistical purposes; t test; ∗∗p = 0.013). (E) Microarray analysis showing gene expression changes 24 h after KA-induced SE in a separate group of mice treated i.p. with Ant-134 or Scr (n = 3/group). Note the selected differential expression induced by Ant-134. Dashed lines are drawn at log2FC (fold change) of 0.4 and −0.4 (equivalent to ± 1.3-FC) and –log10(p value) of 1.3 (equivalent to FDR p value of 0.05). mRNA with –log10(p value) >2.0 and log2FC >0.4 or less than −0.4 are labeled, and those identified as associated with epilepsy are marked in red. For mRNA with multiple isoforms, we selected the maximal p value and associated FC. Three mRNA (Hba-a2, Hbb-b1, Hbb-b2) with log2FC less than −1.5 were removed from the plotted results for clarity. (F) Significantly enriched Reactome pathways for the mRNAs labeled in (E) (adjusted p value [p.adjust] < 0.05). Each enriched pathway contains two mRNAs from the input list, as highlighted on the right of the bars. Data are mean ± SEM.
Figure 5 Molecular effects and mechanism of Ant-134 (A) Mice were equipped with telemetry devices, underwent intra-amygdala KA-induced SE, and 1 h later were intracerebroventricularly (i.c.v.) injected with the first dose of an ASO gapmer to silence Limk-1 mRNA (called Gap; n = 4; 0.01 nmol/2 μL) or its scramble negative control (called Scr; n = 3; 0.01 nmol/2 μL). One more hour after (2 h after SE), all mice were systemically injected with Ant-134 (30 mg/kg, i.p.). Long-term EEG was continued for 2 weeks, and mice received i.c.v. doses of gapmer or Scr every 48 h for the overall recording time (total of seven administrations on experimental days 1, 3, 5, 7, 9, 11, and 13). (B) Reduction of Limk-1 mRNA in the mouse hippocampus 24 h after a single gapmer injection in comparison with Scr control (n = 3/group; t test; ∗p < 0.05). (C) Individual SRS counts per day for Ant-134 mice that received either gapmer or Scr. Each line represents data from the same mouse over time, and each row represents the seizure counts for the respective day of EEG recording. (D) Total number of SRSs over 2 weeks of EEG recordings comparing Ant-134 + Scr mice to Ant-134 + gapmer mice (n = 3/group; the mouse that died was excluded for statistical purposes; t test; ∗∗p = 0.013). (E) Microarray analysis showing gene expression changes 24 h after KA-induced SE in a separate group of mice treated i.p. with Ant-134 or Scr (n = 3/group). Note the selected differential expression induced by Ant-134. Dashed lines are drawn at log2FC (fold change) of 0.4 and −0.4 (equivalent to ± 1.3-FC) and –log10(p value) of 1.3 (equivalent to FDR p value of 0.05). mRNA with –log10(p value) >2.0 and log2FC >0.4 or less than −0.4 are labeled, and those identified as associated with epilepsy are marked in red. For mRNA with multiple isoforms, we selected the maximal p value and associated FC. Three mRNA (Hba-a2, Hbb-b1, Hbb-b2) with log2FC less than −1.5 were removed from the plotted results for clarity. (F) Significantly enriched Reactome pathways for the mRNAs labeled in (E) (adjusted p value [p.adjust] < 0.05). Each enriched pathway contains two mRNAs from the input list, as highlighted on the right of the bars. Data are mean ± SEM.CC BY-NC-ND · PubMed Central

Verification

Claims the paper makes

The claims and statistics of this paper haven’t been checked yet.

Run the check — free, no account needed. It reads the open-access text and checks the sources it cites.

A few free checks a day · papers already verified open instantly · results are public

Claims other papers make about this one

Each is checked against this paper’s own text: does it say what the citing paper says it does?

Self-check

Percentages, sums and reported differences re-computed from the paper’s own numbers.

The self-check needs the paper’s full text.

Citations

Cites

Research works printed but not linked: 42

  1. Levin, 2019, Treating disease at the RNA level with oligonucleotides, N. Engl. J. Med., 380, 57, 10.1056/NEJMra1705346 · DOI · Paper page
  2. Devinsky, 2018, Epilepsy, Nat. Rev. Dis. Primers, 4, 18024, 10.1038/nrdp.2018.24 · DOI
  3. Löscher, 2020, The holy grail of epilepsy prevention: preclinical approaches to antiepileptogenic treatments, Neuropharmacology, 167, 107605, 10.1016/j.neuropharm.2019.04.011 · DOI
  4. Henshall, 2016, MicroRNAs in epilepsy: pathophysiology and clinical utility, Lancet Neurol., 15, 1368, 10.1016/S1474-4422(16)30246-0 · DOI
  5. McNeill, 2012, MicroRNAs shape the neuronal landscape, Neuron, 75, 363, 10.1016/j.neuron.2012.07.005 · DOI · Paper page
  6. McKiernan, 2012, Reduced mature microRNA levels in association with dicer loss in human temporal lobe epilepsy with hippocampal sclerosis, PLoS ONE, 7, e35921, 10.1371/journal.pone.0035921 · DOI · Paper page
  7. Hébert, 2010, Genetic ablation of Dicer in adult forebrain neurons results in abnormal tau hyperphosphorylation and neurodegeneration, Hum. Mol. Genet., 19, 3959, 10.1093/hmg/ddq311 · DOI
  8. Tan, 2013, MicroRNA-128 governs neuronal excitability and motor behavior in mice, Science, 342, 1254, 10.1126/science.1244193 · DOI · Paper page
  9. Jimenez-Mateos, 2012, Silencing microRNA-134 produces neuroprotective and prolonged seizure-suppressive effects, Nat. Med., 18, 1087, 10.1038/nm.2834 · DOI
  10. Reschke, 2017, Potent anti-seizure effects of locked nucleic acid antagomirs targeting miR-134 in multiple mouse and rat models of epilepsy, Mol. Ther. Nucleic Acids, 6, 45, 10.1016/j.omtn.2016.11.002 · DOI
  11. Gao, 2019, Silencing microRNA-134 alleviates hippocampal damage and occurrence of spontaneous seizures after intraventricular kainic acid-induced status epilepticus in rats, Front. Cell. Neurosci., 13, 145, 10.3389/fncel.2019.00145 · DOI
  12. Gaughwin, 2011, Stage-specific modulation of cortical neuronal development by Mmu-miR-134, Cereb. Cortex, 21, 1857, 10.1093/cercor/bhq262 · DOI
  13. Elmén, 2008, LNA-mediated microRNA silencing in non-human primates, Nature, 452, 896, 10.1038/nature06783 · DOI · Paper page
  14. Jimenez-Mateos, 2015, Antagomirs targeting microRNA-134 increase hippocampal pyramidal neuron spine volume in vivo and protect against pilocarpine-induced status epilepticus, Brain Struct. Funct., 220, 2387, 10.1007/s00429-014-0798-5 · DOI
  15. Straarup, 2010, Short locked nucleic acid antisense oligonucleotides potently reduce apolipoprotein B mRNA and serum cholesterol in mice and non-human primates, Nucleic Acids Res., 38, 7100, 10.1093/nar/gkq457 · DOI
  16. van Vliet, 2007, Blood-brain barrier leakage may lead to progression of temporal lobe epilepsy, Brain, 130, 521, 10.1093/brain/awl318 · DOI · Paper page
  17. Shlosberg, 2010, Blood-brain barrier breakdown as a therapeutic target in traumatic brain injury, Nat. Rev. Neurol., 6, 393, 10.1038/nrneurol.2010.74 · DOI · Paper page
  18. Lublinsky, 2019, Early blood-brain barrier dysfunction predicts neurological outcome following aneurysmal subarachnoid hemorrhage, EBioMedicine, 43, 460, 10.1016/j.ebiom.2019.04.054 · DOI
  19. Rüber, 2018, Evidence for peri-ictal blood-brain barrier dysfunction in patients with epilepsy, Brain, 141, 2952, 10.1093/brain/awy242 · DOI
  20. Jimenez-Mateos, 2015, microRNA targeting of the P2X7 purinoceptor opposes a contralateral epileptogenic focus in the hippocampus, Sci. Rep., 5, 17486, 10.1038/srep17486 · DOI · Paper page
  21. Michalak, 2013, Spatio-temporally restricted blood-brain barrier disruption after intra-amygdala kainic acid-induced status epilepticus in mice, Epilepsy Res., 103, 167, 10.1016/j.eplepsyres.2012.10.006 · DOI · Paper page
  22. Keaney, 2015, Autoregulated paracellular clearance of amyloid-β across the blood-brain barrier, Sci. Adv., 1, e1500472, 10.1126/sciadv.1500472 · DOI
  23. Li, 2008, Adenosine kinase is a target for the prediction and prevention of epileptogenesis in mice, J. Clin. Invest., 118, 571
  24. Jiang, 2016, Involvement of cortical fast-spiking parvalbumin-positive basket cells in epilepsy, Prog. Brain Res., 226, 81, 10.1016/bs.pbr.2016.04.012 · DOI
  25. Buono, 2004, Association between variation in the human KCNJ10 potassium ion channel gene and seizure susceptibility, Epilepsy Res., 58, 175, 10.1016/j.eplepsyres.2004.02.003 · DOI
  26. Akarsu, 1998, Inhibition of pentylenetetrazol-induced seizures in rats by prostaglandin D2, Epilepsy Res., 30, 63, 10.1016/S0920-1211(97)00092-2 · DOI
  27. Iwasa, 2017, Excitotoxicity-induced prostaglandin D2 production induces sustained microglial activation and delayed neuronal death, J. Lipid Res., 58, 649, 10.1194/jlr.M070532 · DOI
  28. Liang, 2005, Prostaglandin D2 mediates neuronal protection via the DP1 receptor, J. Neurochem., 92, 477, 10.1111/j.1471-4159.2004.02870.x · DOI
  29. Gross, 2016, MicroRNA-mediated downregulation of the potassium channel Kv4.2 contributes to seizure onset, Cell Rep., 17, 37, 10.1016/j.celrep.2016.08.074 · DOI
  30. Morris, 2018, Spared CA1 pyramidal neuron function and hippocampal performance following antisense knockdown of microRNA-134, Epilepsia, 59, 1518, 10.1111/epi.14475 · DOI
  31. Sambandan, 2017, Activity-dependent spatially localized miRNA maturation in neuronal dendrites, Science, 355, 634, 10.1126/science.aaf8995 · DOI
  32. Wetherington, 2008, Astrocytes in the epileptic brain, Neuron, 58, 168, 10.1016/j.neuron.2008.04.002 · DOI
  33. Janssen, 2013, Treatment of HCV infection by targeting microRNA, N. Engl. J. Med., 368, 1685, 10.1056/NEJMoa1209026 · DOI
  34. Wang, 2017, MicroRNA-134 plasma levels before and after treatment with valproic acid for epilepsy patients, Oncotarget, 8, 72748, 10.18632/oncotarget.20292 · DOI
  35. McArdle, 2017, “TORNADO” – Theranostic One-Step RNA Detector; microfluidic disc for the direct detection of microRNA-134 in plasma and cerebrospinal fluid, Sci. Rep., 7, 1750, 10.1038/s41598-017-01947-2 · DOI
  36. Kullmann, 2014, Gene therapy in epilepsy—is it time for clinical trials?, Nat. Rev. Neurol., 10, 300, 10.1038/nrneurol.2014.43 · DOI
  37. Schindelin, 2012, Fiji: an open-source platform for biological-image analysis, Nat. Methods, 9, 676, 10.1038/nmeth.2019 · DOI · Paper page
  38. Jassal, 2020, The reactome pathway knowledgebase, Nucleic Acids Res., 48, D498
  39. Yu, 2016, ReactomePA: an R/Bioconductor package for reactome pathway analysis and visualization, Mol. Biosyst., 12, 477, 10.1039/C5MB00663E · DOI
  40. Yu, 2012, clusterProfiler: an R package for comparing biological themes among gene clusters, OMICS, 16, 284, 10.1089/omi.2011.0118 · DOI · Paper page
  41. Vuokila, 2020, Chronic regulation of miR-124-3p in the perilesional cortex after experimental and human TBI, Int. J. Mol. Sci., 21, 2418, 10.3390/ijms21072418 · DOI
  42. Almeida Silva, 2020, Genetic deletion of microRNA-22 blunts the inflammatory transcriptional response to status epilepticus and exacerbates epilepsy in mice, Mol. Brain, 13, 114, 10.1186/s13041-020-00653-x · DOI

Cited by

Sorted by citations

See all 42

Metadata

Authors
Reschke, C. R., Silva, L. F. A., Vangoor, V. R., Rosso, M., David, B., Cavanagh, B. L., Connolly, N. M. C., Brennan, G. P., Sanz-Rodriguez, A., Mooney, C., Batool, A., Greene, C., Brennan, M., Conroy, R. M., Rüber, T., Prehn, J. H. M., Campbell, M., Pasterkamp, R. J., & Henshall, D. C.
Venue
Molecular Therapy
Publisher
Elsevier BV
Published
2021-06
Volume
29
Issue
6
Pages
2041-2052
ISSN
1525-0016
Cited by
42
References
5
Language
en
Funders
  • Science Foundation Ireland (13/IA/1891, 11/TIDA/B1988, SFI/14/ADV/RC2721, 17/TIDA/5002, 16/RC/3948)
  • Seventh Framework Programme
  • Irish Research Council
  • European Regional Development Fund
  • Health Research Board
  • Conselho Nacional de Desenvolvimento Científico e Tecnológico
  • European Commission Seventh Framework Programme for Research and Technological Development Health (602130)

About these checks

Registry, retraction, Cites and statistics results are computed, not judged, with one exception: a printed reference that no index lists is read once by a model before it counts as a citation error. Claims are extracted by a model and kept only when their quote appears verbatim in the text; each cited source is then checked, with a model’s help, for whether it says what the claim relies on. Those verdicts can be wrong — read the claim’s quote and the cited source before relying on one.

Statistics and arithmetic are recomputed, not judged.

Confidence bands are shown only for fields calibrated on our annotated test set. None is calibrated yet, so no band is shown.

What counts as a claim ›How we measure confidence ›How we check this ›

Are you an author, or do you see a problem with this page? Request a review