

The DOI matches its Crossref record; 13 of the 13 references it cites were found in a registry or an index.
Baseline levels of miR-223-3p correlate with the effectiveness of electroconvulsive therapy in patients with major depression
Abstract
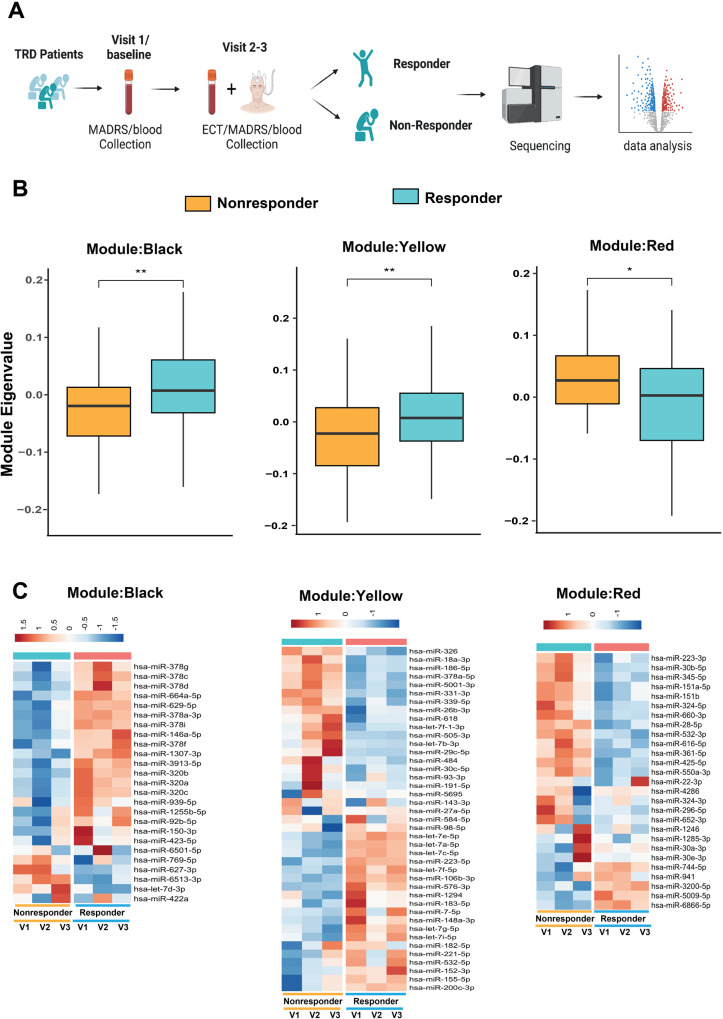
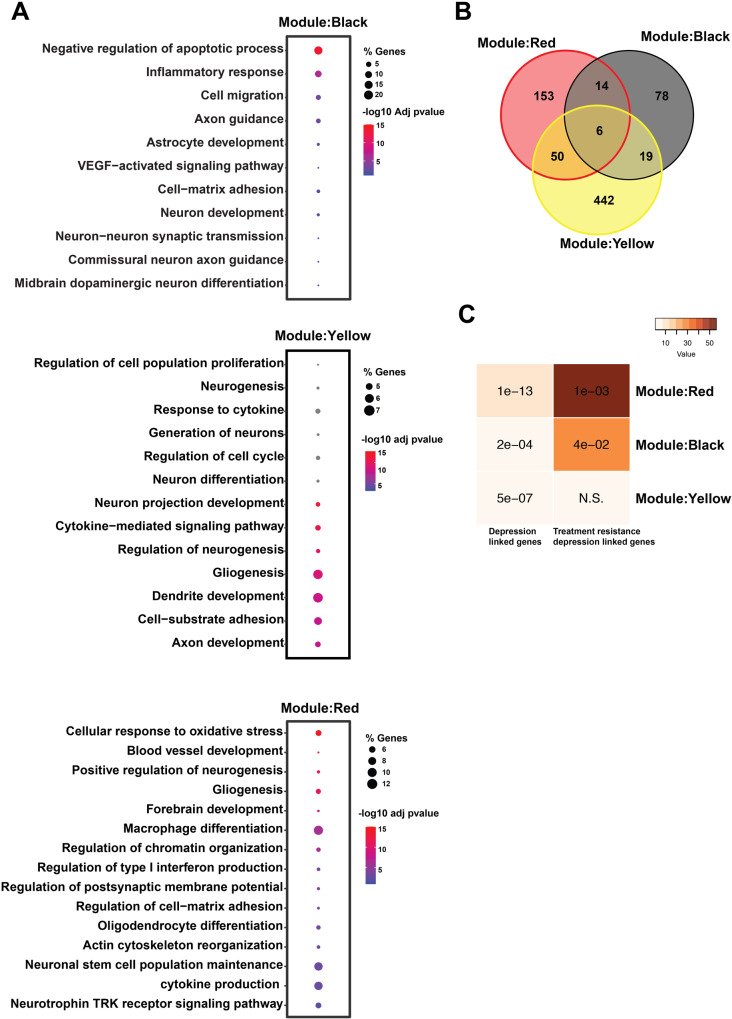
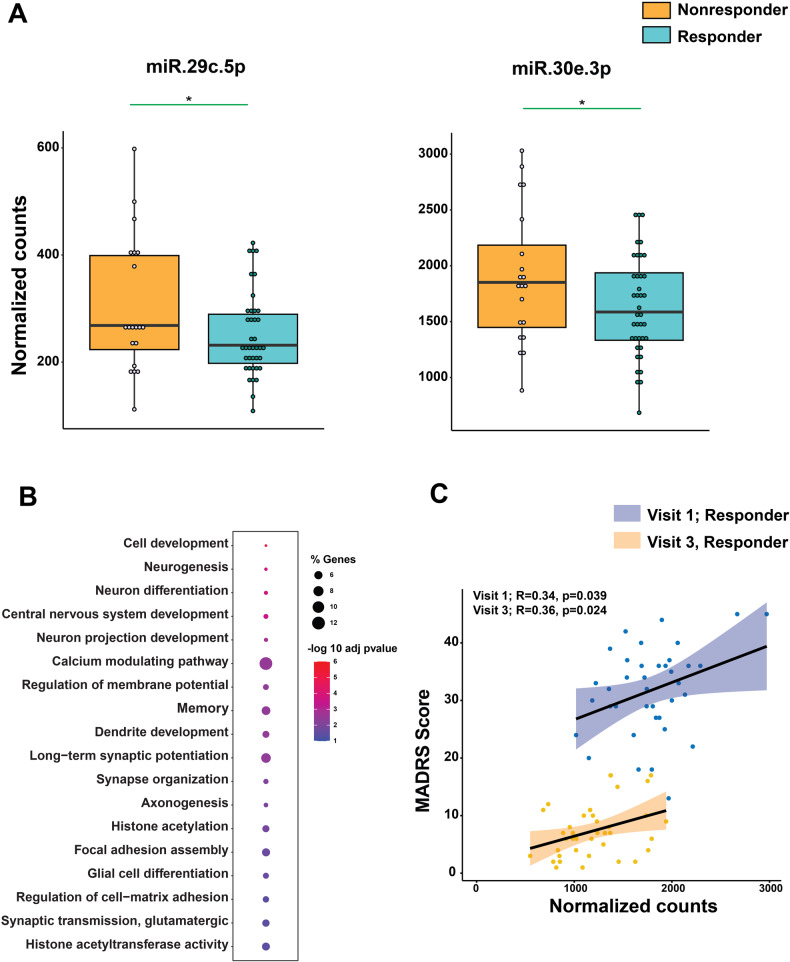
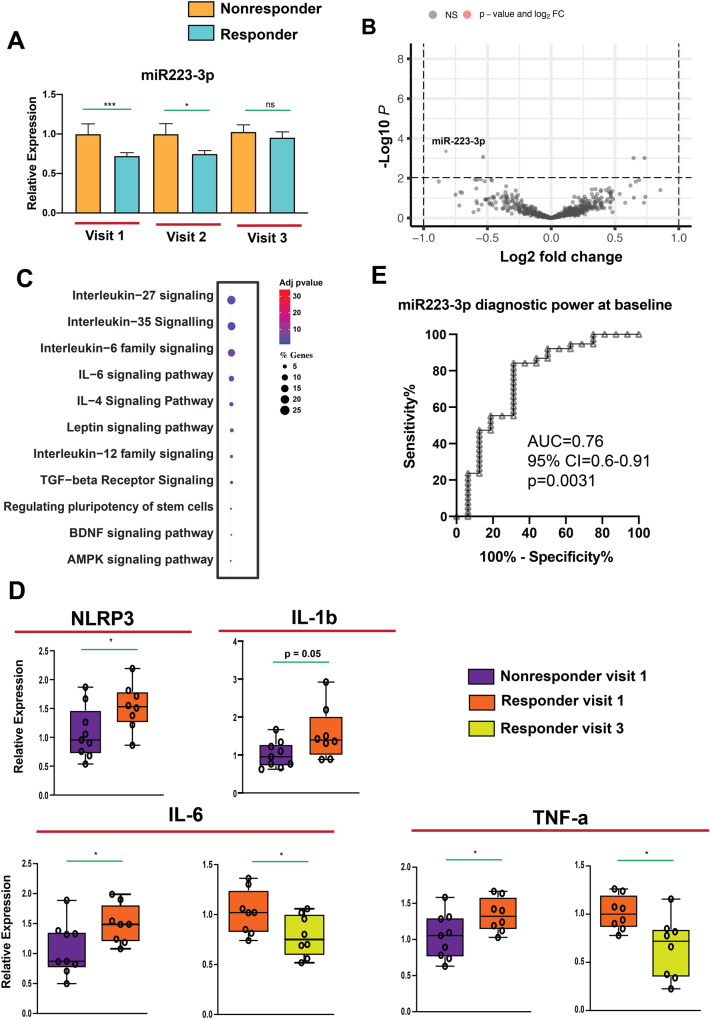
There is a strong medical need to develop suitable biomarkers to improve the diagnosis and treatment of depression, particularly in predicting response to certain therapeutic approaches such as electroconvulsive therapy (ECT). MicroRNAs are small non-coding RNAs that have the ability to influence the transcriptome as well as proteostasis at the systems level. Here, we investigate the role of circulating microRNAs in depression and response prediction towards ECT. Of the 64 patients with treatment-resistant major depression (MDD) who received ECT treatment, 62.5% showed a response, defined as a reduction of ≥50% in the MADRS total score from baseline. We performed smallRNA sequencing in blood samples that were taken before the first ECT, after the first and the last ECT. The microRNAome was compared between responders and non-responders. Co-expression network analysis identified three significant microRNA modules with reverse correlation between ECT- responders and non-responders, that were amongst other biological processes linked to inflammation. A candidate microRNA, namely miR-223-3p was down-regulated in ECT responders when compared to non-responders at baseline. In line with data suggesting a role of miR-223-3p in inflammatory processes we observed higher expression levels of proinflammatory factors Il-6, Il-1b, Nlrp3 and Tnf-α in ECT responders at baseline when compared to non-responders. ROC analysis of confirmed the diagnostic power of miR-223-3p demarcating ECT-responders from non-responder subjects (AUC = 0.76, p = 0.0031). Our data suggest that miR-223-3p expression and related cytokine levels could serve as predictors of response to ECT in individuals with treatment-resistant depressive disorders.
Overview
The claims and statistics of this paper haven’t been checked yet.
Run the check — free, no account needed. It reads the open-access text and checks the sources it cites.
Integrity signals
Registry
Cites
Statistics
Figures
Verification
Claims the paper makes
The claims and statistics of this paper haven’t been checked yet.
Run the check — free, no account needed. It reads the open-access text and checks the sources it cites.
Claims other papers make about this one
Each is checked against this paper’s own text: does it say what the citing paper says it does?
The source backs part of the claim, not all of it — or backs it for a different population, condition or comparison.
In the citing paper
“Dysregulation of miRs has been observed in various neurodegenerative and neuropsychiatric diseases, including Alzheimer’s disease (AD), Parkinson’s disease (PD), amyotrophic lateral sclerosis (ALS), schizophrenia, and depression [13–19].”
From A role for astrocytic miR-129-5p in frontotemporal dementia (2025) · cites this paper as [18]
Experimental — accuracy not yet measured
Self-check
Percentages, sums and reported differences re-computed from the paper’s own numbers.
The self-check needs the paper’s full text.
Citations
Cites
Otte, C., Gold, S. M., Penninx, B. W., Pariante, C. M., Etkin, A., Fava, M., Mohr, D. C., & Schatzberg, A. F. (2016) · Nature Reviews Disease Primers · doi:10.1038/nrdp.2016.65 · Cited by 2,269
Treatment-resistant depression: therapeutic trends, challenges, and future directions
Al-harbi (2012) · Patient Preference and Adherence · doi:10.2147/ppa.s29716 · Cited by 796
The inflammasome: Pathways linking psychological stress, depression, and systemic illnesses
Iwata, M., Ota, K. T., & Duman, R. S. (2013) · Brain, Behavior, and Immunity · doi:10.1016/j.bbi.2012.12.008 · Cited by 580
NLRP3 inflammasome-driven pathways in depression: clinical and preclinical findings
Kaufmann, F. N., Costa, A. P., Ghisleni, G., Diaz, A. P., Rodrigues, A. L. S., Peluffo, H., & Kaster, M. P. (2017) · Brain, Behavior, and Immunity · doi:10.1016/j.bbi.2017.03.002 · Cited by 370
Neurons secrete miR-132-containing exosomes to regulate brain vascular integrity
Xu, B., Zhang, Y., Du, X.-F., Li, J., Zi, H.-X., Bu, J.-W., Yan, Y., Han, H., & Du, J.-L. (2017) · Cell Research · doi:10.1038/cr.2017.62 · Cited by 354
Interleukin-6 Covaries Inversely with Hippocampal Grey Matter Volume in Middle-Aged Adults
Marsland, A. L., Gianaros, P. J., Abramowitch, S. M., Manuck, S. B., & Hariri, A. R. (2008) · Biological Psychiatry · doi:10.1016/j.biopsych.2008.04.016 · Cited by 348
Stress and Loss of Adult Neurogenesis Differentially Reduce Hippocampal Volume
Schoenfeld, T. J., McCausland, H. C., Morris, H. D., Padmanaban, V., & Cameron, H. A. (2017) · Biological Psychiatry · doi:10.1016/j.biopsych.2017.05.013 · Cited by 260
miR-223: An Effective Regulator of Immune Cell Differentiation and Inflammation
Jiao, P., Wang, X.-P., Luoreng, Z.-M., Yang, J., Jia, L., Ma, Y., & Wei, D.-W. (2021) · International Journal of Biological Sciences · doi:10.7150/ijbs.59876 · Cited by 151
Current electroconvulsive therapy practice and research in the geriatric population
Kerner, N., & Prudic, J. (2014) · Neuropsychiatry · doi:10.2217/npy.14.3 · Cited by 146
Pirnia, T., Joshi, S. H., Leaver, A. M., Vasavada, M., Njau, S., Woods, R. P., Espinoza, R., & Narr, K. L. (2016) · Translational Psychiatry · doi:10.1038/tp.2016.102 · Cited by 122
Xu, Y., Liu, H., Li, F., Sun, N., Ren, Y., Liu, Z., Cao, X., Wang, Y., Liu, P., & Zhang, K. (2010) · Journal of Affective Disorders · doi:10.1016/j.jad.2010.05.019 · Cited by 99
The effect of proinflammatory cytokines in Cognitive Behavioral Therapy
Moreira, F. P., Cardoso, T. D. A., Mondin, T. C., Souza, L. D. D. M., Silva, R., Jansen, K., Oses, J. P., & Wiener, C. D. (2015) · Journal of Neuroimmunology · doi:10.1016/j.jneuroim.2015.06.004 · Cited by 77
Kruse, J. L., Olmstead, R., Hellemann, G., Wade, B., Jiang, J., Vasavada, M. M., Brooks III, J. O., Congdon, E., Espinoza, R., Narr, K. L., et al. (2020) · Brain, Behavior, and Immunity · doi:10.1016/j.bbi.2020.05.069 · Cited by 46
Research works printed but not linked: 66
- Kolshus E, Ryan KM, Blackshields G, Smyth P, Sheils O, McLoughlin DM. Peripheral blood microRNA and VEGFA mRNA changes following electroconvulsive therapy: implications for psychotic depression. Acta Psychiatr Scand. 2017;136:594–606. · DOI
- Philip NS, Carpenter LL, Tyrka AR, Price LH. Pharmacologic approaches to treatment resistant depression: a re-examination for the modern era. Expert Opin Pharmacother. 2010;11:709–22. · DOI
- Fries GR, Zhang W, Benevenuto D, Quevedo J. MicroRNAs in major depressive disorder. Adv Exp Med Biol. 2019;1118:175–90. · DOI
- Lin C-Y, Hung S-Y, Chen H-T, Tsou H-K, Fong Y-C, Wang S-W, et al. Brain-derived neurotrophic factor increases vascular endothelial growth factor expression and enhances angiogenesis in human chondrosarcoma cells. Biochem Pharmacol. 2014;91:522–33. · DOI
- Miranda M, Morici JF, Zanoni MB, Bekinschtein P. Brain-derived neurotrophic factor: a key molecule for memory in the healthy and the pathological brain. Front Cell Neurosci. 2019;13:363. · DOI · Paper page
- Faust K, Vajkoczy P, Xi B, Harnack D. The effects of deep brain stimulation of the subthalamic nucleus on vascular endothelial growth factor, brain-derived neurotrophic factor, and glial cell line-derived neurotrophic factor in a rat model of Parkinson’s disease. Stereotact Funct Neurosurg. 2021;99:256–66. · DOI
- Nøhr AK, Lindow M, Forsingdal A, Demharter S, Nielsen T, Buller R, et al. A large-scale genome-wide gene expression analysis in peripheral blood identifies very few differentially expressed genes related to antidepressant treatment and response in patients with major depressive disorder. Neuropsychopharmacology. 2021;46:1324–32. · DOI
- Ma Y, Rosenheck R, Ye B, Fan N, He H. Effectiveness of electroconvulsive therapy in patients with “less treatment‐resistant” depression by the Maudsley Staging Model. Brain Behav. 2020;10:e01654. · DOI
- Cano M, Martínez-Zalacaín I, Bernabéu-Sanz Á, Contreras-Rodríguez O, Hernández-Ribas R, Via E, et al. Brain volumetric and metabolic correlates of electroconvulsive therapy for treatment-resistant depression: a longitudinal neuroimaging study. Transl Psychiatry. 2017;7:e1023. · DOI
- Leaver AM, Espinoza R, Wade B, Narr KL. Parsing the network mechanisms of electroconvulsive therapy. Biol Psychiatry. 2022;92:193–203. · DOI
- Broderick JA, Zamore PD. MicroRNA therapeutics. Gene Ther. 2011;18:1104–10. · DOI
- Mullany LE, Herrick JS, Wolff RK, Stevens JR, Samowitz W, Slattery ML. MicroRNA-transcription factor interactions and their combined effect on target gene expression in colon cancer cases. Genes Chromosomes Cancer. 2018;57:192–202. · DOI
- Treiber T, Treiber N, Meister G. Regulation of microRNA biogenesis and its crosstalk with other cellular pathways. Nat Rev Mol Cell Biol. 2019;20:5–20. · DOI
- Dwivedi Y. MicroRNAs in depression and suicide: recent insights and future perspectives. J Affect Disord. 2018;240:146–54. · DOI
- Zhou L, Zhu Y, Chen W, Tang Y. Emerging role of microRNAs in major depressive disorder and its implication on diagnosis and therapeutic response. J Affect Disord. 2021;286:80–6. · DOI
- Bayraktar R, Van Roosbroeck K, Calin GA. Cell‐to‐cell communication: microRNAs as hormones. Mol Oncol. 2017;11:1673–86. · DOI · Paper page
- Jose AM. Movement of regulatory RNA between animal cells. Genesis. 2015;53:395–416. · DOI
- Mustapic M, Eitan E, Werner JK, Berkowitz ST, Lazaropoulos MP, Tran J, et al. Plasma extracellular vesicles enriched for neuronal origin: a potential window into brain pathologic processes. Front Neurosci. 2017;11:278. · DOI · Paper page
- Goldberg M, Islam MR, Kerimoglu C, Lancelin C, Gisa V, Burkhardt S, et al. Exercise as a model to identify microRNAs linked to human cognition: a role for microRNA-409 and microRNA-501. Transl Psychiatry. 2021;11:1–13. · DOI · Paper page
- O’Connor RM, Dinan TG, Cryan JF. Little things on which happiness depends: microRNAs as novel therapeutic targets for the treatment of anxiety and depression. Mol Psychiatry. 2012;17:359–76. · DOI
- Gururajan A, Naughton ME, Scott KA, O’Connor RM, Moloney G, Clarke G, et al. MicroRNAs as biomarkers for major depression: a role for let-7b and let-7c. Transl Psychiatry. 2016;6:e862. · DOI
- Roy B, Yoshino Y, Allen L, Prall K, Schell G, Dwivedi Y. Exploiting circulating micrornas as biomarkers in psychiatric disorders. Mol Diagn Ther. 2020;24:279–98. · DOI
- Borza T, Engedal K, Bergh S, Benth JŠ, Selbæk G. The course of depression in late life as measured by the Montgomery and Asberg Depression Rating Scale in an observational study of hospitalized patients. BMC Psychiatry. 2015;15:191. · DOI
- Langmead B, Trapnell C, Pop M, Salzberg SL. Ultrafast and memory-efficient alignment of short DNA sequences to the human genome. Genome Biol. 2009;10:R25.
- Langfelder P, Horvath S. WGCNA: an R package for weighted correlation network analysis. BMC Bioinforma. 2008;9:559. · DOI · Paper page
- Risso D, Ngai J, Speed TP, Dudoit S. Normalization of RNA-seq data using factor analysis of control genes or samples. Nat Biotechnol. 2014;32:896–902. · DOI · Paper page
- Love MI, Huber W, Anders S. Moderated estimation of fold change and dispersion for RNA-seq data with DESeq2. Genome Biol. 2014;15:550.
- Islam MR, Kaurani L, Berulava T, Heilbronner U, Budde M, Centeno TP, et al. A microRNA signature that correlates with cognition and is a target against cognitive decline. EMBO Mol Med. 2021;13:e13659. · DOI · Paper page
- Shannon P, Markiel A, Ozier O, Baliga NS, Wang JT, Ramage D, et al. Cytoscape: a software environment for integrated models of biomolecular interaction networks. Genome Res. 2003;13:2498–504. · DOI · Paper page
- Gutiérrez-Sacristán A, Grosdidier S, Valverde O, Torrens M, Bravo À, Piñero J, et al. PsyGeNET: a knowledge platform on psychiatric disorders and their genes. Bioinformatics. 2015;31:3075–7. · DOI
- Cuomo-Haymour N, Kaiser S, Hartmann-Riemer M, Guetter K, Klaus F, Cathomas F, et al. Differential expression of serum extracellular vesicle microRNAs and analysis of target-gene pathways in major depressive disorder. Biomark Neuropsychiatry. 2022;6:100049. · DOI
- Inta D, Lima-Ojeda JM, Lau T, Tang W, Dormann C, Sprengel R, et al. Electroconvulsive therapy induces neurogenesis in frontal rat brain areas. PLoS ONE. 2013;8:e69869. · DOI
- Järventausta K, Sorri A, Kampman O, Björkqvist M, Tuohimaa K, Hämäläinen M, et al. Changes in interleukin-6 levels during electroconvulsive therapy may reflect the therapeutic response in major depression. Acta Psychiatr Scand. 2017;135:87–92. · DOI
- Muhammad RN, Ahmed LA, Abdul Salam RM, Ahmed KA, Attia AS. Crosstalk among NLRP3 inflammasome, ETBR signaling, and miRNAs in stress-induced depression-like behavior: a modulatory role for SGLT2 inhibitors. Neurotherapeutics. 2021;18:2664–81. · DOI
- Borrione L, Bellini H, Razza LB, Avila AG, Baeken C, Brem A-K, et al. Precision non-implantable neuromodulation therapies: a perspective for the depressed brain. Braz J Psychiatry. 2020;42:403–19. · DOI
- van Diermen L, van den Ameele S, Kamperman AM, Sabbe BCG, Vermeulen T, Schrijvers D, et al. Prediction of electroconvulsive therapy response and remission in major depression: meta-analysis. Br J Psychiatry. 2018;212:71–80. · DOI
- van Diermen L, Poljac E, Van der Mast R, Plasmans K, Van den Ameele S, Heijnen W, et al. Toward targeted ECT: the interdependence of predictors of treatment response in depression further explained. J Clin Psychiatry. 2020;82:20m13287. · DOI
- Belge J-B, van Diermen L, Sabbe B, Parizel P, Morrens M, Coppens V, et al. Inflammation, hippocampal volume, and therapeutic outcome following electroconvulsive therapy in depressive patients: a pilot study. Neuropsychobiology. 2020;79:222–32. · DOI
- Blanco I, Conant K. Extracellular matrix remodeling with stress and depression: studies in human, rodent and zebrafish models. Eur J Neurosci. 2021;53:3879–88. · DOI
- Madsen TM, Treschow A, Bengzon J, Bolwig TG, Lindvall O, Tingström A. Increased neurogenesis in a model of electroconvulsive therapy. Biol Psychiatry. 2000;47:1043–9. · DOI
- Ousdal OT, Brancati GE, Kessler U, Erchinger V, Dale AM, Abbott C, et al. The neurobiological effects of electroconvulsive therapy studied through magnetic resonance: what have we learned, and where do we go? Biol Psychiatry. 2022;91:540–9. · DOI
- Argyelan M, Oltedal L, Deng Z-D, Wade B, Bikson M, Joanlanne A, et al. Electric field causes volumetric changes in the human brain. eLife. 2019;8:e49115. · DOI
- Gorinski N, Bijata M, Prasad S, Wirth A, Abdel Galil D, Zeug A, et al. Attenuated palmitoylation of serotonin receptor 5-HT1A affects receptor function and contributes to depression-like behaviors. Nat Commun. 2019;10:3924. · DOI
- Keller MB. Issues in treatment-resistant depression. J Clin Psychiatry. 2005;66:5–12. · DOI
- Ali S, Khan MS, Wani JA, Faiz S, Rehman MU, Majid S, et al. Chapter 13 - miRNAs: the genetic regulators of immunity. In: Rehman MU, Arafah A, Ali MDN, Ali S, editors. A Molecular Approach to Immunogenetics, Academic Press; 2022. p. 299–325. https://doi.org/10.1016/B978-0-323-90053-9.00003-8, https://www.sciencedirect.com/science/article/pii/B9780323900539000038. · DOI
- Bauernfeind F, Rieger A, Schildberg FA, Knolle PA, Schmid-Burgk JL, Hornung V. NLRP3 inflammasome activity is negatively controlled by miR-223. J Immunol. 2012;189:4175–81. · DOI · Paper page
- Neudecker V, Brodsky KS, Clambey ET, Schmidt EP, Packard TA, Davenport B, et al. Neutrophil transfer of miR-223 to lung epithelial cells dampens acute lung injury in mice. Sci Transl Med. 2017;9:eaah5360. · DOI
- Yuan S, Wu Q, Wang Z, Che Y, Zheng S, Chen Y, et al. miR-223: an immune regulator in infectious disorders. Front Immunol. 2021;12:781815. · DOI
- Qu H, Liu R, Chen J, Zheng L, Chen R. Aerobic exercise inhibits CUMS-depressed mice hippocampal inflammatory response via activating hippocampal miR-223/TLR4/MyD88-NF-κB pathway. Int J Environ Res Public Health. 2020;17:2676. · DOI
- Swanson KV, Deng M, Ting JP-Y. The NLRP3 inflammasome: molecular activation and regulation to therapeutics. Nat Rev Immunol. 2019;19:477–89. · DOI · Paper page
- Alcocer-Gómez E, de Miguel M, Casas-Barquero N, Núñez-Vasco J, Sánchez-Alcazar JA, Fernández-Rodríguez A, et al. NLRP3 inflammasome is activated in mononuclear blood cells from patients with major depressive disorder. Brain Behav Immun. 2014;36:111–7. · DOI · Paper page
- Tian H, Li G, Xu G, Liu J, Wan X, Zhang J, et al. Inflammatory cytokines derived from peripheral blood contribute to the modified electroconvulsive therapy-induced cognitive deficits in major depressive disorder. Eur Arch Psychiatry Clin Neurosci. 2021;271:475–85. · DOI
- Roohi E, Jaafari N, Hashemian F. On inflammatory hypothesis of depression: what is the role of IL-6 in the middle of the chaos? J Neuroinflammation. 2021;18:45. · DOI
- Beurel E, Toups M, Nemeroff CB. The bidirectional relationship of depression and inflammation: double trouble. Neuron. 2020;107:234–56. · DOI · Paper page
- Lee C-H, Giuliani F. The role of inflammation in depression and fatigue. Front Immunol. 2019;10:1696. · DOI
- Gay F, Romeo B, Martelli C, Benyamina A, Hamdani N. Cytokines changes associated with electroconvulsive therapy in patients with treatment-resistant depression: a meta-analysis. Psychiatry Res. 2021;297:113735. · DOI
- Dahl J, Ormstad H, Aass HCD, Sandvik L, Malt UF, Andreassen OA. Recovery from major depressive disorder episode after non-pharmacological treatment is associated with normalized cytokine levels. Acta Psychiatr Scand. 2016;134:40–47. · DOI
- Yrondi A, Sporer M, Péran P, Schmitt L, Arbus C, Sauvaget A. Electroconvulsive therapy, depression, the immune system and inflammation: a systematic review. Brain Stimul. 2018;11:29–51. · DOI
- Hestad KA, Tønseth S, Støen CD, Ueland T, Aukrust P. Raised plasma levels of tumor necrosis factor alpha in patients with depression: normalization during electroconvulsive therapy. J ECT. 2003;19:183–8. · DOI · Paper page
- Das S, Halushka MK. Extracellular vesicle microRNA transfer in cardiovascular disease. Cardiovasc Pathol. 2015;24:199–206. · DOI
- Men Y, Yelick J, Jin S, Tian Y, Chiang MSR, Higashimori H, et al. Exosome reporter mice reveal the involvement of exosomes in mediating neuron to astroglia communication in the CNS. Nat Commun. 2019;10:4136.
- Nogueras-Ortiz CJ, Mahairaki V, Delgado-Peraza F, Das D, Avgerinos K, Eren E, et al. Astrocyte- and neuron-derived extracellular vesicles from Alzheimer’s disease patients effect complement-mediated neurotoxicity. Cells. 2020;9:1618. · DOI
- Badhwar A, Haqqani AS. Biomarker potential of brain‐secreted extracellular vesicles in blood in Alzheimer’s disease. Alzheimers Dement. 2020;12:e12001.
- Brymer KJ, Romay-Tallon R, Allen J, Caruncho HJ, Kalynchuk LE. Exploring the potential antidepressant mechanisms of TNFα antagonists. Front Neurosci. 2019;13:98. · DOI
- Raison CL, Rutherford RE, Woolwine BJ, Shuo C, Schettler P, Drake DF, et al. A randomized controlled trial of the tumor necrosis factor-alpha antagonist infliximab in treatment resistant depression: role of baseline inflammatory biomarkers. JAMA Psychiatry. 2013;70:31–41. · DOI · Paper page
- Ye L, Xiao X, Xu Y, Zheng C, Chen S, Luo T, et al. Prelimbic cortex miR-34a contributes to (2R,6R)-hydroxynorketamine-mediated antidepressant-relevant actions. Neuropharmacology. 2022;208:108984. · DOI
Cited by
Sorted by citations
A role for astrocytic miR-129-5p in frontotemporal dementia
Kaurani, L., Pradhan, R., Schröder, S., Burkhardt, S., Schuetz, A.-L., Krüger, D. M., Pena, T., Heutink, P., Sananbenesi, F., & Fischer, A. (2025) · Translational Psychiatry · doi:10.1038/s41398-025-03338-y · Cited by 10
Self-citation
Metadata
- Authors
- Kaurani, L., Besse, M., Methfessel, I., Methi, A., Zhou, J., Pradhan, R., Burkhardt, S., Kranaster, L., Sartorius, A., Habel, U., Grözinger, M., Fischer, A., Wiltfang, J., & Zilles-Wegner, D.
- ORCID
- Venue
- Translational Psychiatry
- Published
- 2023-09-13
- Volume
- 13
- Issue
- 1
- ISSN
- 2158-3188
- PMC
- PMC10497550
- Cited by
- 36
- References
- 13
- Language
- en
About these checks
Registry, retraction, Cites and statistics results are computed, not judged, with one exception: a printed reference that no index lists is read once by a model before it counts as a citation error. Claims are extracted by a model and kept only when their quote appears verbatim in the text; each cited source is then checked, with a model’s help, for whether it says what the claim relies on. Those verdicts can be wrong — read the claim’s quote and the cited source before relying on one.
Statistics and arithmetic are recomputed, not judged.
Confidence bands are shown only for fields calibrated on our annotated test set. None is calibrated yet, so no band is shown.
What counts as a claim ›How we measure confidence ›How we check this ›
Are you an author, or do you see a problem with this page? Request a review
