

The DOI matches its Crossref record; 10 of the 10 references it cites were found in a registry or an index.
A small molecule inhibitor of Rheb selectively targets mTORC1 signaling
Abstract
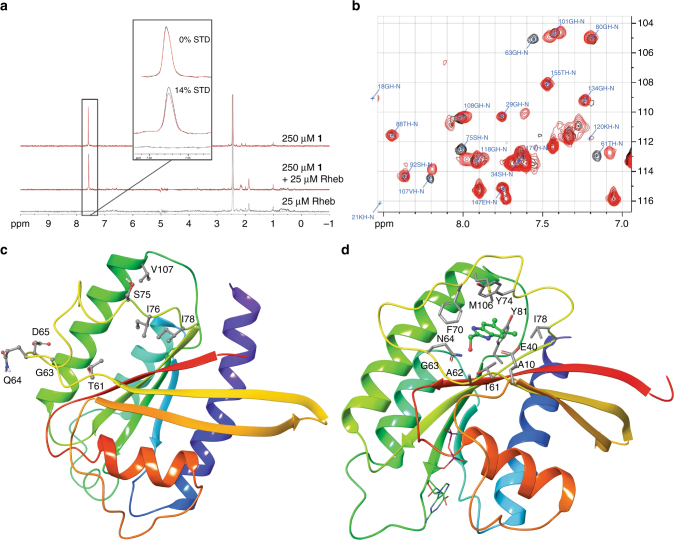
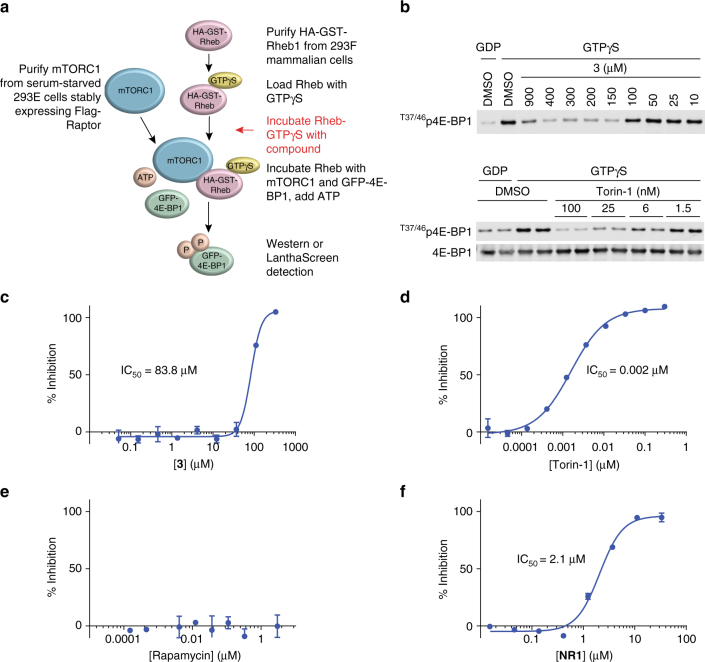
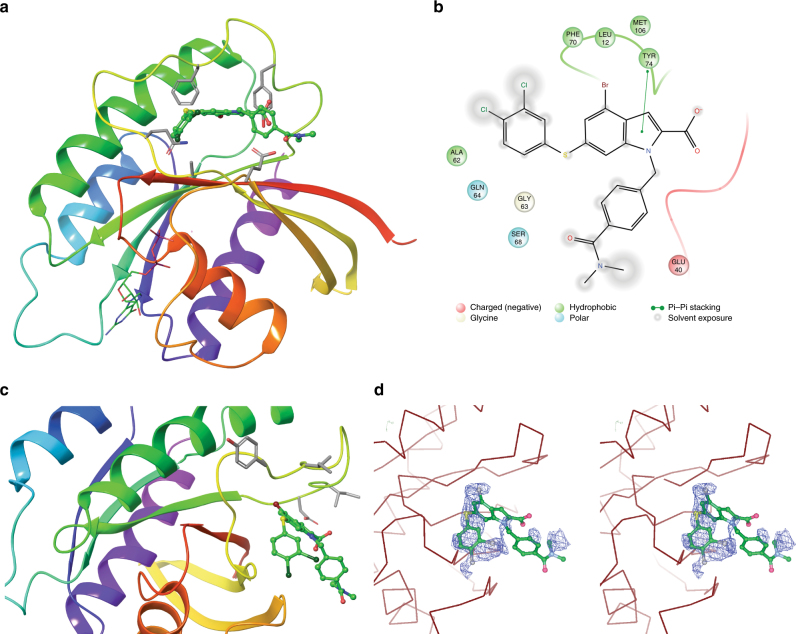
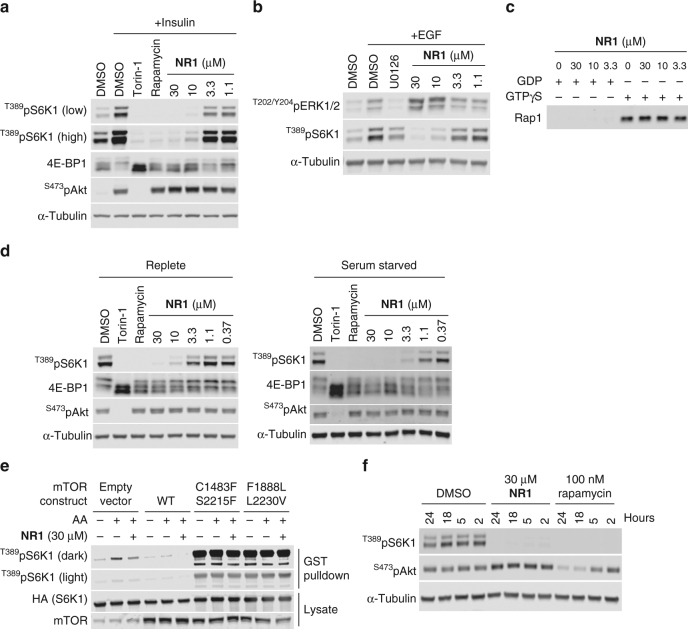
The small G-protein Rheb activates the mechanistic target of rapamycin complex 1 (mTORC1) in response to growth factor signals. mTORC1 is a master regulator of cellular growth and metabolism; aberrant mTORC1 signaling is associated with fibrotic, metabolic, and neurodegenerative diseases, cancers, and rare disorders. Point mutations in the Rheb switch II domain impair its ability to activate mTORC1. Here, we report the discovery of a small molecule (NR1) that binds Rheb in the switch II domain and selectively blocks mTORC1 signaling. NR1 potently inhibits mTORC1 driven phosphorylation of ribosomal protein S6 kinase beta-1 (S6K1) but does not inhibit phosphorylation of AKT or ERK. In contrast to rapamycin, NR1 does not cause inhibition of mTORC2 upon prolonged treatment. Furthermore, NR1 potently and selectively inhibits mTORC1 in mouse kidney and muscle in vivo. The data presented herein suggest that pharmacological inhibition of Rheb is an effective approach for selective inhibition of mTORC1 with therapeutic potential.
Overview
The claims and statistics of this paper haven’t been checked yet.
Run the check — free, no account needed. It reads the open-access text and checks the sources it cites.
Integrity signals
Registry
Cites
Statistics
Figures
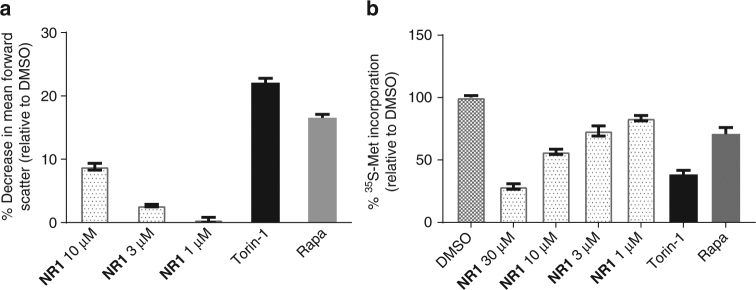
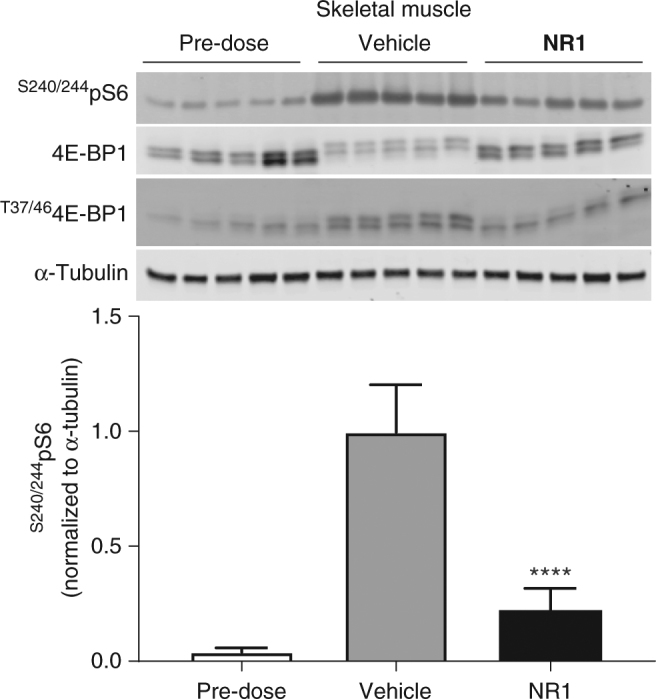
Verification
Claims the paper makes
The claims and statistics of this paper haven’t been checked yet.
Run the check — free, no account needed. It reads the open-access text and checks the sources it cites.
Claims other papers make about this one
Each is checked against this paper’s own text: does it say what the citing paper says it does?
The source backs part of the claim, not all of it — or backs it for a different population, condition or comparison.
In the citing paper
“mTORC1 is able to phosphorylate its substrates only after allosteric interaction with Rheb-GTP, which activates mTORC1 by promoting the alignment of kinase-site residues 163,164.”
From Targeting the biology of aging with mTOR inhibitors (2023) · cites this paper as [164]
Experimental — accuracy not yet measuredThe source backs part of the claim, not all of it — or backs it for a different population, condition or comparison.
In the citing paper
“One of the best examples of these is the compound is NR1, which binds the mTORC1 activator Rheb and prevents it from allosterically activating mTORC1 164.”
From Targeting the biology of aging with mTOR inhibitors (2023) · cites this paper as [164]
Experimental — accuracy not yet measuredThe source backs part of the claim, not all of it — or backs it for a different population, condition or comparison.
In the citing paper
“mTORC1 is able to phosphorylate its substrates only after allosteric interaction with Rheb-GTP, which activates mTORC1 by promoting the alignment of kinase-site residues 163,164.”
From Targeting the biology of aging with mTOR inhibitors (2023) · cites this paper as [164]
Experimental — accuracy not yet measured
Self-check
Percentages, sums and reported differences re-computed from the paper’s own numbers.
The self-check needs the paper’s full text.
Citations
Cites
mTOR: from growth signal integration to cancer, diabetes and ageing
Zoncu, R., Efeyan, A., & Sabatini, D. M. (2011) · Nature Reviews Molecular Cell Biology · doi:10.1038/nrm3025 · Cited by 3,941
K-Ras(G12C) inhibitors allosterically control GTP affinity and effector interactions
Ostrem, J. M., Peters, U., Sos, M. L., Wells, J. A., & Shokat, K. M. (2013) · Nature · doi:10.1038/nature12796 · Cited by 2,557
Drugging the undruggable RAS: Mission Possible?
Cox, A. D., Fesik, S. W., Kimmelman, A. C., Luo, J., & Der, C. J. (2014) · Nature Reviews Drug Discovery · doi:10.1038/nrd4389 · Cited by 1,997
mTOR is a key modulator of ageing and age-related disease
Johnson, S. C., Rabinovitch, P. S., & Kaeberlein, M. (2013) · Nature · doi:10.1038/nature11861 · Cited by 1,676
PRAS40 is an insulin-regulated inhibitor of the mTORC1 protein kinase
Sancak, Y., Thoreen, C. C., Peterson, T. R., Lindquist, R. A., Kang, S. A., Spooner, E., Carr, S. A., & Sabatini, D. M. (2007) · Molecular Cell · doi:10.1016/j.molcel.2007.03.003 · Cited by 1,236
Self-citationRegulation and function of ribosomal protein S6 kinase (S6K) within mTOR signalling networks
Magnuson, B., Ekim, B., & Fingar, D. C. (2012) · Biochemical Journal · doi:10.1042/bj20110892 · Cited by 1,015
The CASTOR Proteins Are Arginine Sensors for the mTORC1 Pathway
Chantranupong, L., Scaria, S. M., Saxton, R. A., Gygi, M. P., Shen, K., Wyant, G. A., Wang, T., Harper, J. W., Gygi, S. P., & Sabatini, D. M. (2016) · Cell · doi:10.1016/j.cell.2016.02.035 · Cited by 843
Mechanisms of mTORC1 activation by RHEB and inhibition by PRAS40
Yang, H., Jiang, X., Li, B., Yang, H. J., Miller, M., Yang, A., Dhar, A., & Pavletich, N. P. (2017) · Nature · doi:10.1038/nature25023 · Cited by 548
Castro, A. F., Rebhun, J. F., Clark, G. J., & Quilliam, L. A. (2003) · Journal of Biological Chemistry · doi:10.1074/jbc.c300226200 · Cited by 381
Discovery and characterization of small molecules that target the GTPase Ral
Yan, C., Liu, D., Li, L., Wempe, M. F., Guin, S., Khanna, M., Meier, J., Hoffman, B., Owens, C., Wysoczynski, C. L., et al. (2014) · Nature · doi:10.1038/nature13713 · Cited by 150
Research works printed but not linked: 60
- Laplante, M. & Sabatini, D. M. mTOR signaling in growth control and disease. Cell 149, 274–293 (2012). · DOI · Paper page
- Dibble, C. C. & Manning, B. D. Signal integration by mTORC1 coordinates nutrient input with biosynthetic output. Nat. Cell Biol. 15, 555–564 (2013). · DOI
- Oh, W. J. & Jacinto, E. mTOR complex 2 signaling and functions. Cell Cycle 10, 2305–2316 (2011). · DOI
- Gui, Y. S. et al. mTOR overactivation and compromised autophagy in the pathogenesis of pulmonary fibrosis. PLoS ONE 10, e0138625 (2015). · DOI
- Crino, P. B. The mTOR signalling cascade: paving new roads to cure neurological disease. Nat. Rev. Neurol. 12, 379–392 (2016). · DOI · Paper page
- Jahrling, J. B. & Laberge, R. M. Age-related neurodegeneration prevention through mTOR inhibition: potential mechanisms and remaining questions. Curr. Top. Med. Chem. 15, 2139–2151 (2015). · DOI
- Fernandez, D. & Perl, A. mTOR signaling: a central pathway to pathogenesis in systemic lupus erythematosus? Discov. Med. 9, 173–178 (2010).
- Populo, H., Lopes, J. M. & Soares, P. The mTOR signalling pathway in human cancer. Int. J. Mol. Sci. 13, 1886–1918 (2012). · DOI · Paper page
- Sampson, J. R. Therapeutic targeting of mTOR in tuberous sclerosis. Biochem. Soc. Trans. 37, 259–264 (2009). · DOI
- Li, J., Kim, S. G. & Blenis, J. Rapamycin: one drug, many effects. Cell Metab. 19, 373–379 (2014). · DOI · Paper page
- Kaplan, B., Qazi, Y. & Wellen, J. R. Strategies for the management of adverse events associated with mTOR inhibitors. Transplant. Rev. 28, 126–133 (2014). · DOI
- Sarbassov, D. D. et al. Prolonged rapamycin treatment inhibits mTORC2 assembly and Akt/PKB. Mol. Cell 22, 159–168 (2006). · DOI · Paper page
- Lamming, D. W. et al. Rapamycin-induced insulin resistance is mediated by mTORC2 loss and uncoupled from longevity. Science 335, 1638–1643 (2012). · DOI · Paper page
- Basu, B. et al. First-in-human pharmacokinetic and pharmacodynamic study of the dual m-TORC 1/2 inhibitor AZD2014. Clin. Cancer Res. 21, 3412–3419 (2015). · DOI
- Mateo, J. et al. A first in man, dose-finding study of the mTORC1/mTORC2 inhibitor OSI-027 in patients with advanced solid malignancies. Br. J. Cancer 114, 889–896 (2016). · DOI
- Asahina, H. et al. Safety and tolerability of AZD8055 in Japanese patients with advanced solid tumors; a dose-finding phase I study. Invest. New Drugs 31, 677–684 (2013). · DOI
- Naing, A. et al. Safety, tolerability, pharmacokinetics and pharmacodynamics of AZD8055 in advanced solid tumours and lymphoma. Br. J. Cancer 107, 1093–1099 (2012). · DOI
- Heard, J. J., Fong, V., Bathaie, S. Z. & Tamanoi, F. Recent progress in the study of the Rheb family GTPases. Cell. Signal. 26, 1950–1957 (2014). · DOI
- Yu, Y. et al. Structural basis for the unique biological function of small GTPase RHEB. J. Biol. Chem. 280, 17093–17100 (2005). · DOI
- Long, X., Lin, Y., Ortiz-Vega, S., Busch, S. & Avruch, J. The Rheb switch 2 segment is critical for signaling to target of rapamycin complex 1. J. Biol. Chem. 282, 18542–18551 (2007). · DOI
- Basso, A. D. et al. The farnesyl transferase inhibitor (FTI) SCH66336 (lonafarnib) inhibits Rheb farnesylation and mTOR signaling. Role in FTI enhancement of taxane and tamoxifen anti-tumor activity. J. Biol. Chem. 280, 31101–31108 (2005). · DOI
- Ding, H. et al. Farnesyltransferase inhibitor tipifarnib inhibits Rheb prenylation and stabilizes Bax in acute myelogenous leukemia cells. Haematologica 99, 60–69 (2014). · DOI
- Baines, A. T., Xu, D. & Der, C. J. Inhibition of Ras for cancer treatment: the search continues. Future Med. Chem. 3, 1787–1808 (2011). · DOI
- Wang, J., Yao, X. & Huang, J. New tricks for human farnesyltransferase inhibitor: cancer and beyond. Med. Chem. Commun. 8, 841–854 (2017). · DOI
- Wennerberg, K., Rossman, K. L. & Der, C. J. The Ras superfamily at a glance. J. Cell Sci. 118, 843–846 (2005). · DOI
- Spiegel, J., Cromm, P. M., Zimmermann, G., Grossmann, T. N. & Waldmann, H. Small-molecule modulation of Ras signaling. Nat. Chem. Biol. 10, 613–622 (2014). · DOI
- Shang, X. et al. Rational design of small molecule inhibitors targeting RhoA subfamily Rho GTPases. Chem. Biol. 19, 699–710 (2012). · DOI
- Gao, J. et al. Automated NMR fragment based screening identified a novel interface blocker to the LARG/RhoA complex. PLoS ONE 9, e88098 (2014). · DOI
- Erlanson, D. A., Jahnke, W., Mannhold, R., Kubinyi, H. & Folkers G. Fragment-Based Drug Discovery: Lessons and Outlook Vol. 67 (Wiley, Weinheim, Germany, 2016). · DOI
- Meyer, B. & Peters, T. NMR spectroscopy techniques for screening and identifying ligand binding to protein receptors. Angew. Chem. Int. Ed. 42, 864–890 (2003). · DOI
- Karassek, S. et al. Ras homolog enriched in brain (Rheb) enhances apoptotic signaling. J. Biol. Chem. 285, 33979–33991 (2010). · DOI
- Maurer, T. et al. Small-molecule ligands bind to a distinct pocket in Ras and inhibit SOS-mediated nucleotide exchange activity. Proc. Natl Acad. Sci. USA 109, 5299–5304 (2012). · DOI · Paper page
- Annis, D. A., Nickbarg, E., Yang, X., Ziebell, M. R. & Whitehurst, C. E. Affinity selection-mass spectrometry screening techniques for small molecule drug discovery. Curr. Opin. Chem. Biol. 11, 518–526 (2007). · DOI
- Tabancay, A. P. Jr. et al. Identification of dominant negative mutants of Rheb GTPase and their use to implicate the involvement of human Rheb in the activation of p70S6K. J. Biol. Chem. 278, 39921–39930 (2003). · DOI
- Anastassiadis, T., Deacon, S. W., Devarajan, K., Ma, H. & Peterson, J. R. Comprehensive assay of kinase catalytic activity reveals features of kinase inhibitor selectivity. Nat. Biotechnol. 29, 1039–1045 (2011). · DOI · Paper page
- Kang, S. A. et al. mTORC1 phosphorylation sites encode their sensitivity to starvation and rapamycin. Science 341, 1236566 (2013). · DOI
- Choo, A. Y., Yoon, S. O., Kim, S. G., Roux, P. P. & Blenis, J. Rapamycin differentially inhibits S6Ks and 4E-BP1 to mediate cell-type-specific repression of mRNA translation. Proc. Natl Acad. Sci. USA 105, 17414–17419 (2008). · DOI
- Carracedo, A. et al. Inhibition of mTORC1 leads to MAPK pathway activation through a PI3K-dependent feedback loop in human cancer. J. Clin. Invest. 118, 3065–3074 (2008).
- Yu, J., Astrinidis, A., Howard, S. & Henske, E. P. Estradiol and tamoxifen stimulate LAM-associated angiomyolipoma cell growth and activate both genomic and nongenomic signaling pathways. Am. J. Physiol. Lung Cell. Mol. Physiol. 286, L694–L700 (2004). · DOI
- Hong, F. et al. mTOR-raptor binds and activates SGK1 to regulate p27 phosphorylation. Mol. Cell 30, 701–711 (2008). · DOI
- Xu, J. et al. Mechanistically distinct cancer-associated mTOR activation clusters predict sensitivity to rapamycin. J. Clin. Invest. 126, 3526–3540 (2016). · DOI
- Wang, X. & Proud, C. G. The mTOR pathway in the control of protein synthesis. Physiology 21, 362–369 (2006). · DOI · Paper page
- Battelli, C. & Cho, D. C. mTOR inhibitors in renal cell carcinoma. Therapy 8, 359–367 (2011). · DOI
- Adegoke, O. A., Abdullahi, A. & Tavajohi-Fini, P. mTORC1 and the regulation of skeletal muscle anabolism and mass. Appl. Physiol. Nutr. Metab. 37, 395–406 (2012). · DOI
- Chang, G. R. et al. Long-term administration of rapamycin reduces adiposity, but impairs glucose tolerance in high-fat diet-fed KK/HlJ mice. Basic Clin. Pharmacol. Toxicol. 105, 188–198 (2009). · DOI
- Fraenkel, M. et al. mTOR inhibition by rapamycin prevents beta-cell adaptation to hyperglycemia and exacerbates the metabolic state in type 2 diabetes. Diabetes 57, 945–957 (2008). · DOI
- Pavlakis, M. & Goldfarb-Rumyantzev, A. S. Diabetes after transplantation and sirolimus: what’s the connection? J. Am. Soc. Nephrol. 19, 1255–1256 (2008). · DOI
- Kleinert, M. et al. Acute mTOR inhibition induces insulin resistance and alters substrate utilization in vivo. Mol. Metab. 3, 630–641 (2014). · DOI
- Yang, S. B. et al. Rapamycin induces glucose intolerance in mice by reducing islet mass, insulin content, and insulin sensitivity. J. Mol. Med. 90, 575–585 (2012). · DOI
- Chantranupong, L. et al. The Sestrins interact with GATOR2 to negatively regulate the amino-acid-sensing pathway upstream of mTORC1. Cell Rep. 9, 1–8 (2014). · DOI · Paper page
- Wolfson, R. L. et al. KICSTOR recruits GATOR1 to the lysosome and is necessary for nutrients to regulate mTORC1. Nature 543, 438–442 (2017). · DOI
- Goorden, S. M. et al. Rheb is essential for murine development. Mol. Cell. Biol. 31, 1672–1678 (2011). · DOI
- Groenewoud, M. J. et al. Mammalian target of rapamycin complex I (mTORC1) activity in ras homologue enriched in brain (Rheb)-deficient mouse embryonic fibroblasts. PLoS ONE 8, e81649 (2013). · DOI
- Potheraveedu, V. N., Schopel, M., Stoll, R. & Heumann, R. Rheb in neuronal degeneration, regeneration, and connectivity. Biol. Chem. 398, 589–606 (2017). · DOI
- Shahani, N. et al. Rheb GTPase regulates beta-secretase levels and amyloid beta generation. J. Biol. Chem. 289, 5799–5808 (2014). · DOI
- Delgoffe, G. M. et al. The kinase mTOR regulates the differentiation of helper T cells through the selective activation of signaling by mTORC1 and mTORC2. Nat. Immunol. 12, 295–303 (2011). · DOI
- Pollizzi, K. N. et al. mTORC1 and mTORC2 selectively regulate CD8(+) T cell differentiation. J. Clin. Invest. 125, 2090–2108 (2015). · DOI
- Knowles, M. A., Hornigold, N. & Pitt, E. Tuberous sclerosis complex (TSC) gene involvement in sporadic tumours. Biochem. Soc. Trans. 31, 597–602 (2003). · DOI
- Zhang, H. M., Diaz, V., Walsh, M. E. & Zhang, Y. Moderate lifelong overexpression of tuberous sclerosis complex 1 (TSC1) improves health and survival in mice. Sci. Rep. 7, 834 (2017). · DOI · Paper page
- Welsch, M. E. et al. Multivalent small-molecule Pan-RAS inhibitors. Cell 168, 878–889 e829 (2017). · DOI
Cited by
Sorted by citations
Molecular mechanisms of dietary restriction promoting health and longevity
Green, C. L., Lamming, D. W., & Fontana, L. (2022) · Nature Reviews Molecular Cell Biology · doi:10.1038/s41580-021-00411-4 · Cited by 714
Targeting the biology of aging with mTOR inhibitors
Mannick, J. B., & Lamming, D. W. (2023) · Nature Aging · doi:10.1038/s43587-023-00416-y · Cited by 372
Mammalian/mechanistic target of rapamycin (mTOR) complexes in neurodegeneration
Querfurth, H., & Lee, H.-K. (2021) · Molecular Neurodegeneration · doi:10.1186/s13024-021-00428-5 · Cited by 288
Targeting lysosomes in human disease: from basic research to clinical applications
Cao, M., Luo, X., Wu, K., & He, X. (2021) · Signal Transduction and Targeted Therapy · doi:10.1038/s41392-021-00778-y · Cited by 225
Metadata
- Authors
- Mahoney, S. J., Narayan, S., Molz, L., Berstler, L. A., Kang, S. A., Vlasuk, G. P., & Saiah, E.
- ORCID
- Mahoney, Sarah J.
- Venue
- Nature Communications
- Published
- 2018-02-07
- Volume
- 9
- Issue
- 1
- ISSN
- 2041-1723
- PMC
- PMC5803267
- Cited by
- 88
- References
- 10
- Language
- en
About these checks
Registry, retraction, Cites and statistics results are computed, not judged, with one exception: a printed reference that no index lists is read once by a model before it counts as a citation error. Claims are extracted by a model and kept only when their quote appears verbatim in the text; each cited source is then checked, with a model’s help, for whether it says what the claim relies on. Those verdicts can be wrong — read the claim’s quote and the cited source before relying on one.
Statistics and arithmetic are recomputed, not judged.
Confidence bands are shown only for fields calibrated on our annotated test set. None is calibrated yet, so no band is shown.
What counts as a claim ›How we measure confidence ›How we check this ›
Are you an author, or do you see a problem with this page? Request a review
