

The DOI matches its Crossref record; 75 of the 75 references it cites were found in a registry or an index.
ATAC-Seq analysis reveals a widespread decrease of chromatin accessibility in age-related macular degeneration
Open accessPublished version of a preprint
Abstract
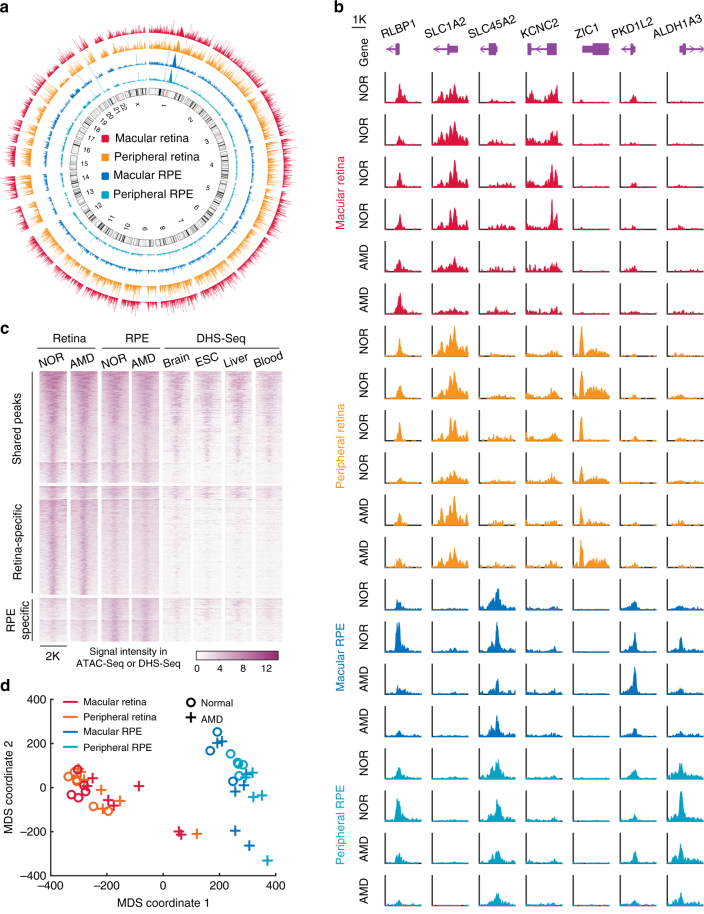
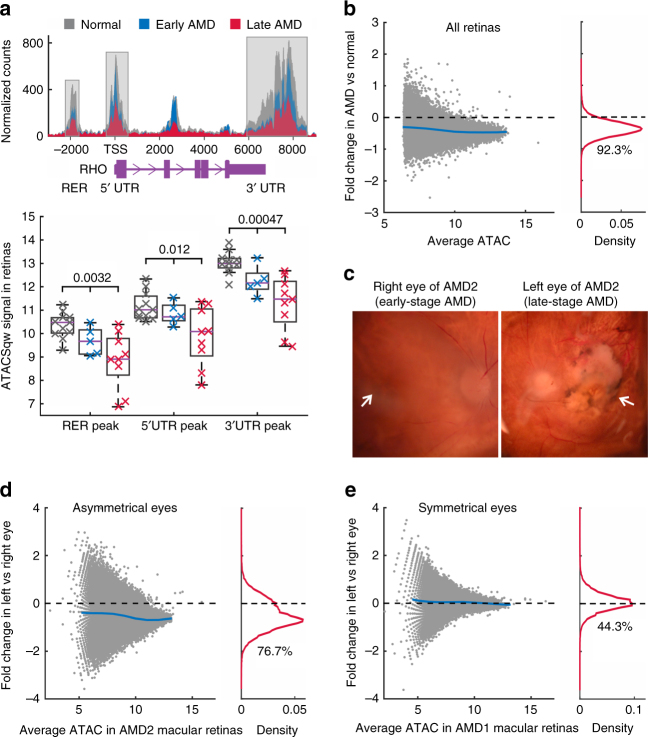
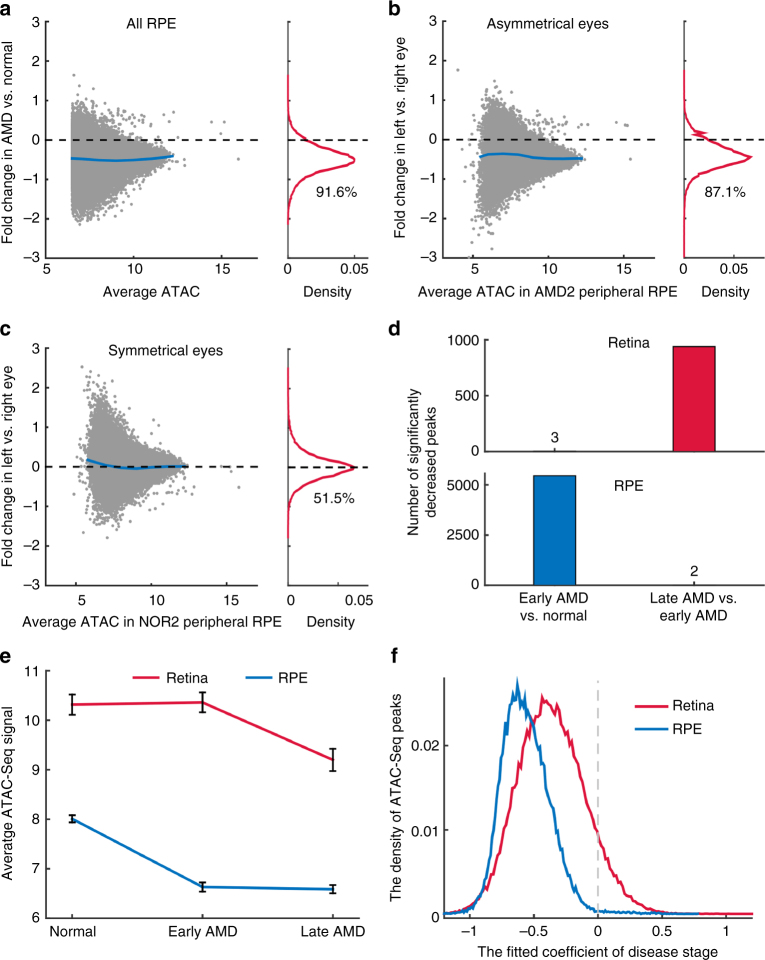
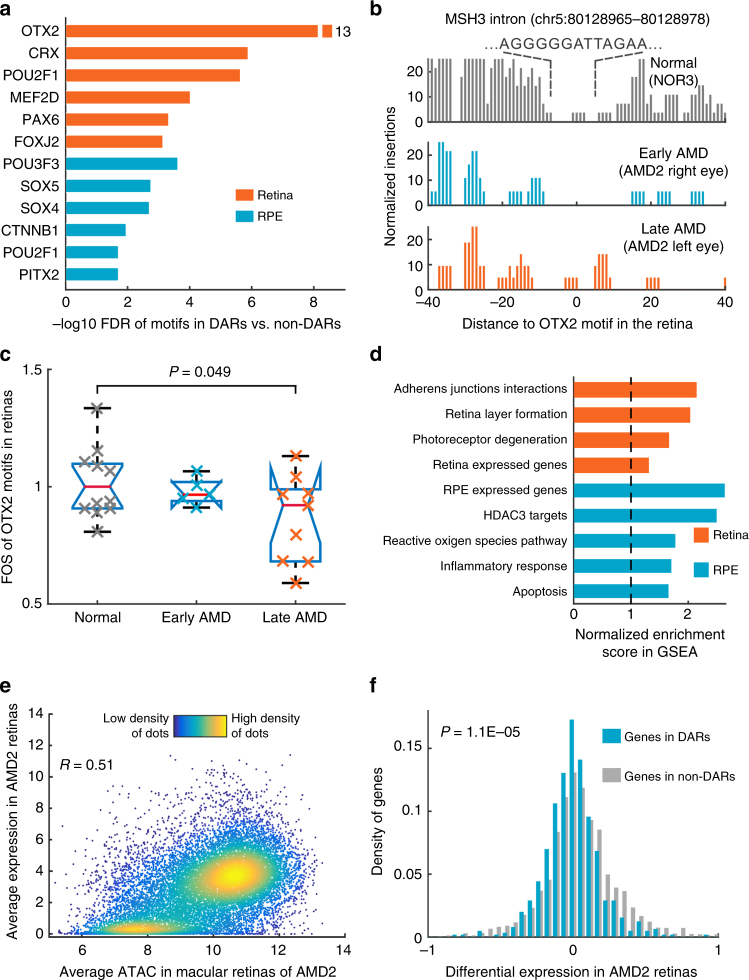
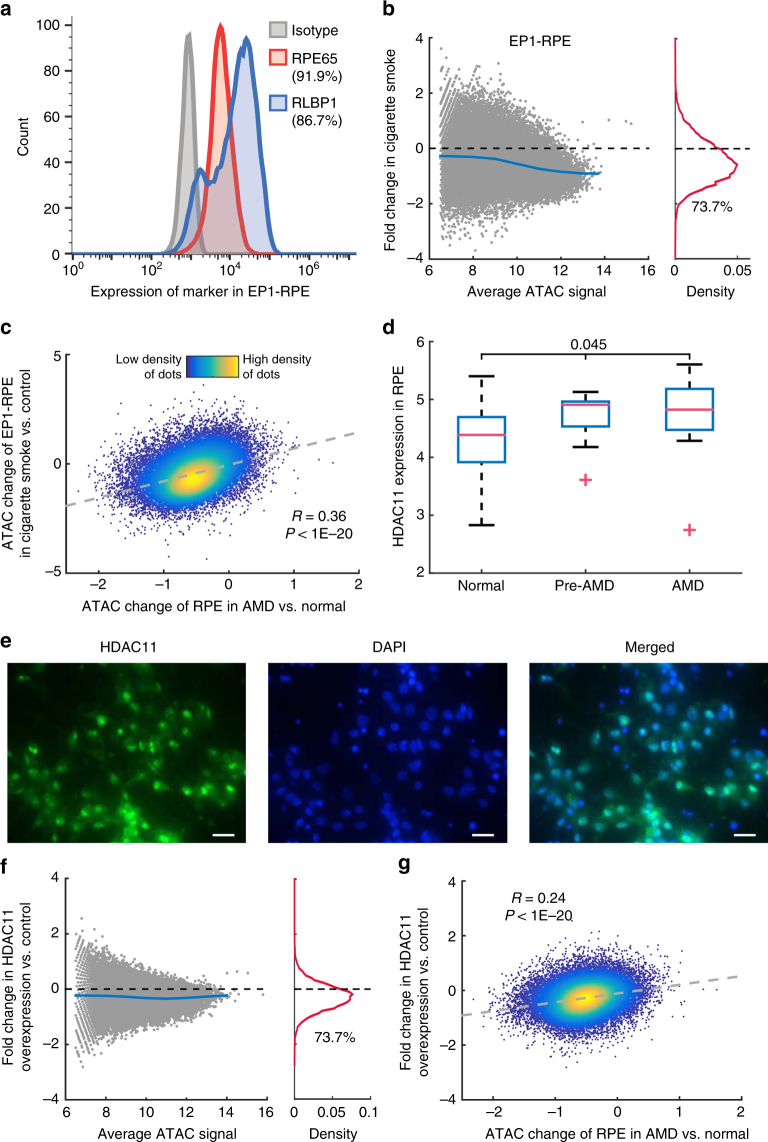
Age-related macular degeneration (AMD) is a significant cause of vision loss in the elderly. The extent to which epigenetic changes regulate AMD progression is unclear. Here we globally profile chromatin accessibility using ATAC-Seq in the retina and retinal pigmented epithelium (RPE) from AMD and control patients. Global decreases in chromatin accessibility occur in the RPE with early AMD, and in the retina of advanced disease, suggesting that dysfunction in the RPE drives disease onset. Footprints of photoreceptor and RPE-specific transcription factors are enriched in differentially accessible regions (DARs). Genes associated with DARs show altered expression in AMD. Cigarette smoke treatment of RPE cells recapitulates chromatin accessibility changes seen in AMD, providing an epigenetic link between a known risk factor for AMD and AMD pathology. Finally, overexpression of HDAC11 is partially responsible for the observed reduction in chromatin accessibility, suggesting that HDAC11 may be a potential new therapeutic target for AMD.
Overview
The claims and statistics of this paper haven’t been checked yet.
Run the check — free, no account needed. It reads the open-access text and checks the sources it cites.
Integrity signals
Registry
Cites
Statistics
Figures
Verification
Claims the paper makes
The claims and statistics of this paper haven’t been checked yet.
Run the check — free, no account needed. It reads the open-access text and checks the sources it cites.
Claims other papers make about this one
Each is checked against this paper’s own text: does it say what the citing paper says it does?
The cited source says what the claim attributes to it.
In the citing paper
“which aligns with the conclusion that chromatin accessibility alterations occur in age-related macular degeneration54.”
From Inferring gene regulatory networks from single-cell multiome data using atlas-scale external data (2025) · cites this paper as [54]
Self-check
Percentages, sums and reported differences re-computed from the paper’s own numbers.
The self-check needs the paper’s full text.
Citations
Cites
Trimmomatic: a flexible trimmer for Illumina sequence data
Bolger, A. M., Lohse, M., & Usadel, B. (2014) · Bioinformatics · doi:10.1093/bioinformatics/btu170 · Cited by 65,548
The Sequence Alignment/Map format and SAMtools
Li, H., Handsaker, B., Wysoker, A., Fennell, T., Ruan, J., Homer, N., Marth, G., Abecasis, G., Durbin, R., & 1000 Genome Project Data Processing Subgroup (2009) · Bioinformatics · doi:10.1093/bioinformatics/btp352 · Cited by 62,041
Fast gapped-read alignment with Bowtie 2
Langmead, B., & Salzberg, S. L. (2012) · Nature Methods · doi:10.1038/nmeth.1923 · Cited by 56,400
Subramanian, A., Tamayo, P., Mootha, V. K., Mukherjee, S., Ebert, B. L., Gillette, M. A., Paulovich, A., Pomeroy, S. L., Golub, T. R., Lander, E. S., et al. (2005) · Proceedings of the National Academy of Sciences · doi:10.1073/pnas.0506580102 · Cited by 53,625
Robinson, M. D., McCarthy, D. J., & Smyth, G. K. (2010) · Bioinformatics · doi:10.1093/bioinformatics/btp616 · Cited by 41,364
HTSeq—a Python framework to work with high-throughput sequencing data
Anders, S., Pyl, P. T., & Huber, W. (2015) · Bioinformatics · doi:10.1093/bioinformatics/btu638 · Cited by 21,464
Model-based Analysis of ChIP-Seq (MACS)
Zhang, Y., Liu, T., Meyer, C. A., Eeckhoute, J., Johnson, D. S., Bernstein, B. E., Nusbaum, C., Myers, R. M., Brown, M., Li, W., et al. (2008) · Genome Biology · doi:10.1186/gb-2008-9-9-r137 · Cited by 18,386
ANNOVAR: functional annotation of genetic variants from high-throughput sequencing data
Wang, K., Li, M., & Hakonarson, H. H. (2010) · Nucleic Acids Research · doi:10.1093/nar/gkq603 · Cited by 14,724
Trapnell, C., Roberts, A., Goff, L. A., Pertea, G. M., Kim, D., Kelley, D. R., Pimentel, H., Salzberg, S. L., Rinn, J. L., & Pachter, L. S. (2012) · Nature Protocols · doi:10.1038/nprot.2012.016 · Cited by 12,145
Circos: An information aesthetic for comparative genomicsPreprint
Krzywinski, M. I., Schein, J. E., Birol, İ., Connors, J. M., Gascoyne, R. D., Horsman, D. E., Jones, S. J. M., & Marra, M. A. (2009) · Genome Research · doi:10.1101/gr.092759.109 · Cited by 11,073
Induced Pluripotent Stem Cell Lines Derived from Human Somatic Cells
Yu, J., Vodyanik, M. A., Smuga-Otto, K., Antosiewicz-Bourget, J., Frane, J. L., Tian, S., Nie, J., Jonsdottir, G. A., Ruotti, V., Stewart, R., et al. (2007) · Science · doi:10.1126/science.1151526 · Cited by 10,310
Highly parallel genome-wide expression profiling of individual cells using nanoliter droplets.
Macosko, E. Z., Basu, A., Satija, R., Nemesh, J., Shekhar, K., Goldman, M., Tirosh, I., Bialas, A. R., Kamitaki, N., Martersteck, E. M., et al. (2015) · Cell · doi:10.1016/j.cell.2015.05.002 · Cited by 7,110
Mitochondrial Dysfunction and Oxidative Stress in Neurodegenerative Diseases
Lin, M. T., & Beal, M. F. (2006) · Nature · doi:10.1038/nature05292 · Cited by 6,455
Buenrostro, J. D., Giresi, P. G., Zaba, L. C., Chang, H. Y., & Greenleaf, W. J. (2013) · Nature Methods · doi:10.1038/nmeth.2688 · Cited by 6,422
Wong, W. L., Su, X., Li, X., Cheung, C. M. G., Klein, R., Cheng, C., & Wong, T. Y. (2014) · The Lancet Global Health · doi:10.1016/s2214-109x(13)70145-1 · Cited by 5,545
Cillà, S. D., Farruggio, S., Vujosevic, S., Raina, G., Filippini, D. A., Gatti, V., Clemente, N., Mary, D., Vezzola, D., Casini, G., et al. (2017) · Cellular Physiology and Biochemistry · doi:10.1159/000479441 · Cited by 5,154
FIMO: scanning for occurrences of a given motif
Grant, C. E., Bailey, T. L., & Noble, W. S. (2011) · Bioinformatics · doi:10.1093/bioinformatics/btr064 · Cited by 4,247
Otto Warburg's contributions to current concepts of cancer metabolism
Koppenol, W. H., Bounds, P. L., & Dang, C. V. (2011) · Nature Reviews Cancer · doi:10.1038/nrc3038 · Cited by 3,427
The accessible chromatin landscape of the human genome
Thurman, R. E., Rynes, E., Humbert, R., Vierstra, J., Maurano, M. T., Haugen, E., Sheffield, N. C., Stergachis, A. B., Wang, H., Vernot, B., et al. (2012) · Nature · doi:10.1038/nature11232 · Cited by 2,679
Irizarry, R. A., Ladd-Acosta, C., Wen, B., Wu, Z., Montano, C., Onyango, P., Cui, H., Gabo, K., Rongione, M., Webster, M., et al. (2009) · Nature Genetics · doi:10.1038/ng.298 · Cited by 2,177
Self-citationTRANSFAC(R): transcriptional regulation, from patterns to profiles
Matys, V. (2003) · Nucleic Acids Research · doi:10.1093/nar/gkg108 · Cited by 1,985
Age-related macular degeneration
Lim, L. S., Mitchell, P., Seddon, J. M., Holz, F. G., & Wong, T. Y. (2012) · The Lancet · doi:10.1016/s0140-6736(12)60282-7 · Cited by 1,806
Phenotypic plasticity and the epigenetics of human disease
Feinberg, A. P. (2007) · Nature · doi:10.1038/nature05919 · Cited by 1,613
Fritsche, L. G., Igl, W., Bailey, J. N. C., Grassmann, F., Sengupta, S., Bragg-Gresham, J. L., Burdon, K. P., Hebbring, S. J., Wen, C., Gorski, M., et al. (2016) · Nature Genetics · doi:10.1038/ng.3448 · Cited by 1,544
Self-citationAge-related macular degeneration
Jager, R. D., Mieler, W. F., & Miller, J. W. (2008) · New England Journal of Medicine · doi:10.1056/nejmra0801537 · Cited by 1,379
Human housekeeping genes, revisited
Eisenberg, E., & Levanon, E. Y. (2013) · Trends in Genetics · doi:10.1016/j.tig.2013.05.010 · Cited by 1,249
The Control of the Metabolic Switch in Cancers by Oncogenes and Tumor Suppressor Genes
Levine, A. J., & Puzio-Kuter, A. M. (2010) · Science · doi:10.1126/science.1193494 · Cited by 1,243
Mechanisms of Age-Related Macular Degeneration
Ambati, J., & Fowler, B. J. (2012) · Neuron · doi:10.1016/j.neuron.2012.06.018 · Cited by 1,062
Electroporation and RNA interference in the rodent retina in vivo and in vitro
Matsuda, T., & Cepko, C. L. (2003) · Proceedings of the National Academy of Sciences · doi:10.1073/pnas.2235688100 · Cited by 1,032
Bhutto, I. A., & Lutty, G. A. (2012) · Molecular Aspects of Medicine · doi:10.1016/j.mam.2012.04.005 · Cited by 1,028
Seven new loci associated with age-related macular degeneration
The AMD Gene Consortium (2013) · Nature Genetics · doi:10.1038/ng.2578 · Cited by 788
Self-citationHuman body epigenome maps reveal noncanonical DNA methylation variation
Schultz, M. D., He, Y., Whitaker, J. W., Hariharan, M., Mukamel, E. A., Leung, D., Rajagopal, N., Nery, J. R., Urich, M. A., Chen, H., et al. (2015) · Nature · doi:10.1038/nature14465 · Cited by 690
Photoreceptor degeneration: genetic and mechanistic dissection of a complex trait
Wright, A. F., Chakarova, C. F., El-Aziz, M. M. A., & Bhattacharya, S. S. (2010) · Nature Reviews Genetics · doi:10.1038/nrg2717 · Cited by 668
Otx2 homeobox gene controls retinal photoreceptor cell fate and pineal gland development
Nishida, A., Furukawa, A., Koike, C., Tano, Y., Aizawa, S., Matsuo, I., & Furukawa, T. (2003) · Nature Neuroscience · doi:10.1038/nn1155 · Cited by 607
Genomic Analysis of Mouse Retinal Development
Blackshaw, S., Harpavat, S., Trimarchi, J. M., Cai, L., Huang, H., Kuo, W. P., Weber, G. M., Lee, K., Fraioli, R. E., Cho, S., et al. (2004) · PLoS Biology · doi:10.1371/journal.pbio.0020247 · Cited by 586
Self-citationKim, H. J., Rowe, M. K., Ren, M., Hong, J., Chen, P.-S., & Chuang, D. (2007) · Journal of Pharmacology and Experimental Therapeutics · doi:10.1124/jpet.107.120188 · Cited by 560
(2011) · PubMed Central · Cited by 560
The transcriptome of retinal Müller glial cells
Roesch, K., Jadhav, A. P., Trimarchi, J. M., Stadler, M. B., Roska, B., Sun, B. B., & Cepko, C. L. (2008) · The Journal of Comparative Neurology · doi:10.1002/cne.21730 · Cited by 409
Nfib Promotes Metastasis through a Widespread Increase in Chromatin Accessibility
Denny, S. K., Yang, D., Chuang, C.-H., Brady Jennifer, J., Lim, J. S., Grüner, B. M., Chiou, S., Schep, A. N., Baral, J., Hamard, C., et al. (2016) · Cell · doi:10.1016/j.cell.2016.05.052 · Cited by 366
Dietary intake of antioxidants and risk of age-related macular degeneration
van Leeuwen, R. (2005) · JAMA · doi:10.1001/jama.294.24.3101 · Cited by 345
Metabolic Regulation of Histone Post-Translational Modifications
Fan, J., Krautkramer, K. A., Feldman, J. L., & Denu, J. M. (2015) · ACS Chemical Biology · doi:10.1021/cb500846u · Cited by 339
Histone acetylation increases chromatin accessibility
Görisch, S. M., Wachsmuth, M., Tóth, K. F., Lichter, P., & Rippe, K. (2005) · Journal of Cell Science · doi:10.1242/jcs.02689 · Cited by 321
Blackshaw, S., Fraioli, R. E., Furukawa, T., & Cepko, C. L. (2001) · Cell · doi:10.1016/s0092-8674(01)00574-8 · Cited by 303
Self-citationAbnormal mitochondrial dynamics and neurodegenerative diseases
Su, B., Wang, X., Zheng, L., Perry, G. L., Smith, M. A., & Zhu, X. (2009) · Biochimica et Biophysica Acta (BBA) - Molecular Basis of Disease · doi:10.1016/j.bbadis.2009.09.013 · Cited by 301
De novo mutations in the CRX homeobox gene associated with Leber congenital amaurosis
Freund, C. L., Wang, Q., Chen, S., Muskat, B. L., Wiles, C. D., Sheffield, V. C., Jacobson, S. G., Mclnnes, R. R., Zack, D. J., & Stone, E. M. (1998) · Nature Genetics · doi:10.1038/ng0498-311 · Cited by 299
Self-citationDeregulation of HDAC1 by p25/Cdk5 in Neurotoxicity
Kim, D., Frank, C. L., Dobbin, M. M., Tsunemoto, R. K., Tu, W., Peng, P. L., Guan, J.-S., Lee, B.-H., Moy, L. Y., Giusti, P., et al. (2008) · Neuron · doi:10.1016/j.neuron.2008.10.015 · Cited by 286
Newman, A. M., Gallo, N., Hancox, L. S., Miller, N. J., Radeke, C. M., Maloney, M. A., Cooper, J. B., Hageman, G. S., Anderson, D. H., Johnson, L. V., et al. (2012) · Genome Medicine · doi:10.1186/gm315 · Cited by 276
Transcriptome analysis and molecular signature of human retinal pigment epithelium
Strunnikova, N. V., Maminishkis, A., Barb, J. J., Wang, F., Zhi, C., Sergeev, Y., Chen, W., Edwards, A. O., Stambolian, D., Abecasis, G., et al. (2010) · Human Molecular Genetics · doi:10.1093/hmg/ddq129 · Cited by 269
Transcriptional code and disease map for adult retinal cell types
Siegert, S., Cabuy, E., Scherf, B. G., Kohler, H., Panda, S., Le, Y.-Z., Fehling, H. J., Gaidatzis, D., Stadler, M. B., & Roska, B. (2012) · Nature Neuroscience · doi:10.1038/nn.3032 · Cited by 253
Regulation of glioblastoma stem cells by retinoic acid: role for Notch pathway inhibition
Ying, M., Wang, S., Sang, Y., Sun, P., Lal, B., Goodwin, C. R., Guerrero-Cazares, H., Quinones-Hinojosa, A., Laterra, J., & Xia, S. (2011) · Oncogene · doi:10.1038/onc.2011.58 · Cited by 204
Self-citationDietary Fatty Acids and the 10-Year Incidence of Age-Related Macular Degeneration
Tan, J. S. L. (2009) · Archives of Ophthalmology · doi:10.1001/archophthalmol.2009.76 · Cited by 204
Seddon, J. M., George, S., Rosner, B., & Klein, M. L. (2006) · Human Heredity · doi:10.1159/000094141 · Cited by 176
Hypomethylation of the IL17RC Promoter Associates with Age-Related Macular Degeneration
Wei, L., Liu, B., Tuo, J., Shen, D., Chen, P., Li, Z., Liu, X., Ni, J., Dagur, P., Sen, H. N., et al. (2012) · Cell Reports · doi:10.1016/j.celrep.2012.10.013 · Cited by 167
DNase Footprint Signatures Are Dictated by Factor Dynamics and DNA Sequence
Sung, M., Guertin, M. J., Baek, S., & Hager, G. L. (2014) · Molecular Cell · doi:10.1016/j.molcel.2014.08.016 · Cited by 160
Trimarchi, J. M., Stadler, M. B., Roska, B., Billings, N., Sun, B. B., Bartch, B., & Cepko, C. L. (2007) · The Journal of Comparative Neurology · doi:10.1002/cne.21368 · Cited by 156
Maruotti, J., Sripathi, S. R., Bharti, K., Fuller, J., Wahlin, K. J., Jaskula-Ranga, V., Sluch, V. M., Berlinicke, C. A., Davis, J. A., Kim, C., et al. (2015) · Proceedings of the National Academy of Sciences · doi:10.1073/pnas.1422818112 · Cited by 144
Self-citationThe Cis-regulatory Logic of the Mammalian Photoreceptor Transcriptional Network
Hsiau, T. H.-C., Diaconu, C. I., Myers, C. A., Lee, J., Cepko, C. L., & Corbo, J. C. (2007) · PLoS ONE · doi:10.1371/journal.pone.0000643 · Cited by 142
DNA Methylation Is Associated with Altered Gene Expression in AMD
Hunter, A. A., Spechler, P., Cwanger, A., Song, Y., Zhang, Z., Ying, G., Hunter, A. K., de Zoeten, E. F., & Dunaief, J. L. (2012) · Investigative Ophthalmology & Visual Science · doi:10.1167/iovs.11-8449 · Cited by 136
Hao, H., Kim, D. S., Klocke, B., Johnson, K. R., Cui, K., Gotoh, N., Zang, C., Gregorski, J., Gieser, L. M., Peng, W., et al. (2012) · PLoS Genetics · doi:10.1371/journal.pgen.1002649 · Cited by 125
Excessive HDAC activation is critical for neurodegeneration in the rd1 mouse
Sancho-Pellúz, J., Alavi, M. V., Sahaboglu, A., Kustermann, S., Farinelli, P., Azadi, S., Veen, T. V., Romero, F. J., Paquet‐Durand, F., & Ekström, P. A. R. (2010) · Cell Death and Disease · doi:10.1038/cddis.2010.4 · Cited by 124
Comprehensive analysis of gene expression in human retina and supporting tissues
Li, M., Cheng, J., Kazmierkiewicz, K. L., Bowman, A. S., Tian, L., Liu, Y., Gupta, N., Gudiseva, H. V., Yee, S. S., Kim, M., et al. (2014) · Human Molecular Genetics · doi:10.1093/hmg/ddu114 · Cited by 118
Inhibition of Histone Deacetylase Protects the Retina from Ischemic Injury
Crosson, C. E., Mani, S. K., Husain, S., Alsarraf, O., & Menick, D. R. (2010) · Investigative Ophthalmology & Visual Science · doi:10.1167/iovs.09-4538 · Cited by 102
Maruotti, J., Wahlin, K. J., Gorrell, D., Bhutto, I. A., Lutty, G. A., & Zack, D. J. (2013) · Stem Cells Translational Medicine · doi:10.5966/sctm.2012-0106 · Cited by 96
Self-citationLu, J., Frerich, J. M., Turtzo, L. C., Li, S., Chiang, J. Y., Yang, C., Wang, X., Zhang, C., Wu, C., Sun, Z., et al. (2013) · Proceedings of the National Academy of Sciences · doi:10.1073/pnas.1308950110 · Cited by 89
Differential DNA methylation identified in the blood and retina of AMD patients
Oliver, V. F., Jaffe, A. E., Song, J., Wang, G., Zhang, P., Branham, K. E. H., Swaroop, A., Eberhart, C. G., Zack, D. J., Qian, J. X., et al. (2015) · Epigenetics · doi:10.1080/15592294.2015.1060388 · Cited by 72
Self-citationA Mechanistic Review of Cigarette Smoke and Age-Related Macular Degeneration
Woodell, A. S., & Rohrer, B. (2014) · Advances in experimental medicine and biology · doi:10.1007/978-1-4614-3209-8_38 · Cited by 63
Seddon, J. M., Reynolds, R. C., & ROSNER, B. A. (2010) · Europe PMC (PubMed Central) · Cited by 62
Ophthalmology 1 Age-related macular degeneration
Lim, L. S., Mitchell, P., Seddon, J. M., Holz, F. G., & Wong, T. Y. (2012) · Cited by 60
Zhang, Z., Qin, X., Tong, N., Zhao, X., Gong, Y., Shi, Y., & Wu, X. (2011) · Experimental Eye Research · doi:10.1016/j.exer.2011.11.013 · Cited by 57
Shang, P., Valapala, M., Grebe, R. R., Hose, S., Ghosh, S., Bhutto, I. A., Handa, J. T., Lutty, G. A., Lü, L., Wan, J., et al. (2017) · Aging Cell · doi:10.1111/acel.12561 · Cited by 52
Self-citationOliver, V. F., Franchina, M., Jaffe, A. E., Branham, K. E. H., Othman, M., Heckenlively, J. R., Swaroop, A., Campochiaro, B., Vote, B. J. T., Craig, J. E., et al. (2013) · Cell Reports · doi:10.1016/j.celrep.2013.11.042 · Cited by 50
Self-citationInhibition of HDAC2 Protects the Retina From Ischemic Injury
Fan, J., Alsarraf, O., Dahrouj, M., Platt, K. A., Chou, C. J., Rice, D. S., & Crosson, C. E. (2013) · Investigative Ophthalmology & Visual Science · doi:10.1167/iovs.12-11529 · Cited by 45
Green, J. J., Bhise, N. S., Wahlin, K. J., & Zack, D. J. (2013) · International Journal of Nanomedicine · doi:10.2147/ijn.s53830 · Cited by 44
Self-citationHDAC Inhibition Prevents Rd1 Mouse Photoreceptor Degeneration
Sancho-Pellúz, J., & Paquet‐Durand, F. (2011) · Advances in experimental medicine and biology · doi:10.1007/978-1-4614-0631-0_15 · Cited by 14
Orešič, M., Seppänen-Laakso, T., Sun, D., Tang, J., Therman, S., Viehman, R., Mustonen, U., van Erp, T. G., Hyötyläinen, T., Thompson, P., et al. (2012) · Genome Medicine · doi:10.1186/gm300 · Cited by 5
Research works printed but not linked: 1
- Buenrostro, J. D., Giresi, P. G., Zaba, L. C., Chang, H. Y. & Greenleaf, W. J. Transposition of native chromatin for multimodal regulatory analysis and personal epigenomics. Nat. Methods 10, 1213 (2013). · DOI · Paper page
Cited by
Sorted by citations
Age-related macular degeneration
Fleckenstein, M., Keenan, T. D. L., Guymer, R. H., Chakravarthy, U., Schmitz-Valckenberg, S., Klaver, C. C. W., Wong, W. T., & Chew, E. Y. (2021) · Nature Reviews Disease Primers · doi:10.1038/s41572-021-00265-2 · Cited by 1,093
Mechanisms of mitochondrial dysfunction and their impact on age-related macular degeneration
Kaarniranta, K., Uusitalo, H. M. T., Błasiak, J., Felszeghy, S., Kannan, R., Kauppinen, A., Salminen, A., Sinha, D., & Ferrington, D. A. (2020) · Progress in Retinal and Eye Research · doi:10.1016/j.preteyeres.2020.100858 · Cited by 548
Self-citationFrom reads to insight: a hitchhiker’s guide to ATAC-seq data analysis
Yan, F., Powell, D., Curtis, D. J., & Wong, N. C. (2020) · Genome biology · doi:10.1186/s13059-020-1929-3 · Cited by 487
Gene regulatory networks controlling vertebrate retinal regeneration
Hoang, T. V., Wang, J., Boyd, P., Wang, F., Santiago, C. P., Jiang, L., Yoo, S., Lahne, M., Todd, L. J., Jia, M. X., et al. (2020) · Science · doi:10.1126/science.abb8598 · Cited by 408
Self-citationHanda, J. T., Rickman, C. B., Dick, A. D., Gorin, M. B., Miller, J. W., Toth, C. A., Ueffing, M., Zarbin, M. A., & Farrer, L. A. (2019) · Nature Communications · doi:10.1038/s41467-019-11262-1 · Cited by 285
Self-citation
Metadata
- Authors
- Wang, J., Zibetti, C., Shang, P., Sripathi, S. R., Zhang, P., Cano, M., Hoang, T., Xia, S., Ji, H., Merbs, S. L., Zack, D. J., Handa, J. T., Sinha, D., Blackshaw, S., & Qian, J.
- Affiliations
- Johns Hopkins University (US)
- Corresponding author
- Blackshaw, Seth
- Qian, Jiang
- ORCID
- Venue
- Nature Communications
- Published
- 2018-04-10
- Volume
- 9
- Issue
- 1
- Pages
- 1364-1364
- ISSN
- 2041-1723 (ISSN-L)
- PMC
- PMC5893535
- OpenAlex
- W2797486746
- Cited by
- 185
- References
- 74
- Citations by year
- 2026: 15 · 2025: 27 · 2024: 32 · 2023: 24 · 2022: 24 · 2021: 24 · 2020: 21 · 2019: 13 · 2018: 5
- FWCI
- 17.10
- Type
- journal article
- Language
- en
- Open access
- gold
- doi.org
- Locations
- Nature Communications (publishedVersion, cc-by)
- bioRxiv (Cold Spring Harbor Laboratory) (acceptedVersion)
- Europe PMC (PubMed Central) (publishedVersion, other-oa)
- PubMed Central (publishedVersion, cc-by)
- PubMed (publishedVersion)
- RePEc: Research Papers in Economics (submittedVersion)
- DOAJ (DOAJ: Directory of Open Access Journals) (submittedVersion)
- DOAJ (DOAJ: Directory of Open Access Journals) (submittedVersion, cc-by-sa)
- NORA - Norwegian Open Research Archives (submittedVersion, cc-by)
- Funders
- International Retinal Research Foundation
- National Institutes of Health
- National Eye Institute (R01EY020560, R01EY024580, R01EY023188, R01EY027691)
- National Institute of Neurological Disorders and Stroke (R01NS091165)
- Topics
- Health Sciences › Medicine › Ophthalmology › Retinal Diseases and Treatments
- Health Sciences › Medicine › Ophthalmology › Retinal Development and Disorders
- Life Sciences › Biochemistry, Genetics and Molecular Biology › Molecular Biology › Epigenetics and DNA Methylation
- Keywords
- age-related macular degeneration, chromatin accessibility, retinal pigment epithelium, retina, epigenetic regulation, differentially accessible regions, cigarette smoke, HDAC11, histone deacetylase, therapeutic target
- MeSH terms
- Aged, Aged, 80 and over, Chromatin, Epithelial Cells, Eye Proteins, Female, Histone Deacetylases, Humans, Macular Degeneration, Male, Smoke, Nicotiana, Transcription Factors, Case-Control Studies, Epigenesis, Genetic, Complex Mixtures, Genome-Wide Association Study, Retinal Pigment Epithelium, High-Throughput Nucleotide Sequencing, Primary Cell Culture
About these checks
Registry, retraction, Cites and statistics results are computed, not judged, with one exception: a printed reference that no index lists is read once by a model before it counts as a citation error. Claims are extracted by a model and kept only when their quote appears verbatim in the text; each cited source is then checked, with a model’s help, for whether it says what the claim relies on. Those verdicts can be wrong — read the claim’s quote and the cited source before relying on one.
Statistics and arithmetic are recomputed, not judged.
Confidence bands are shown only for fields calibrated on our annotated test set. None is calibrated yet, so no band is shown.
What counts as a claim ›How we measure confidence ›How we check this ›
Are you an author, or do you see a problem with this page? Request a review
