

The DOI matches its Crossref record; 64 of the 64 references it cites were found in a registry or an index.
Osteocytic oxygen sensing controls bone mass through epigenetic regulation of sclerostin
Open accessAbstract
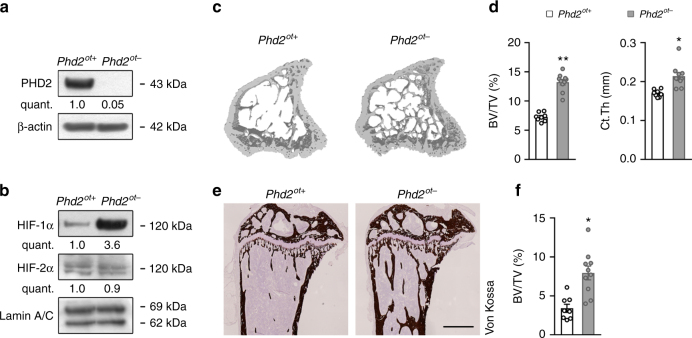
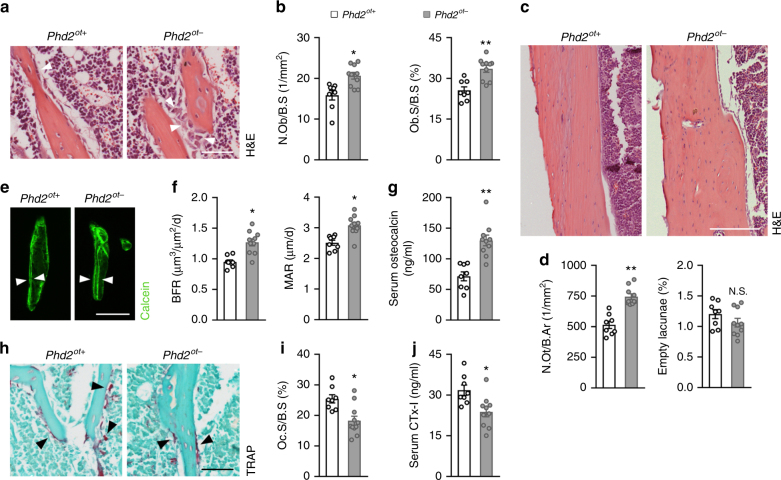
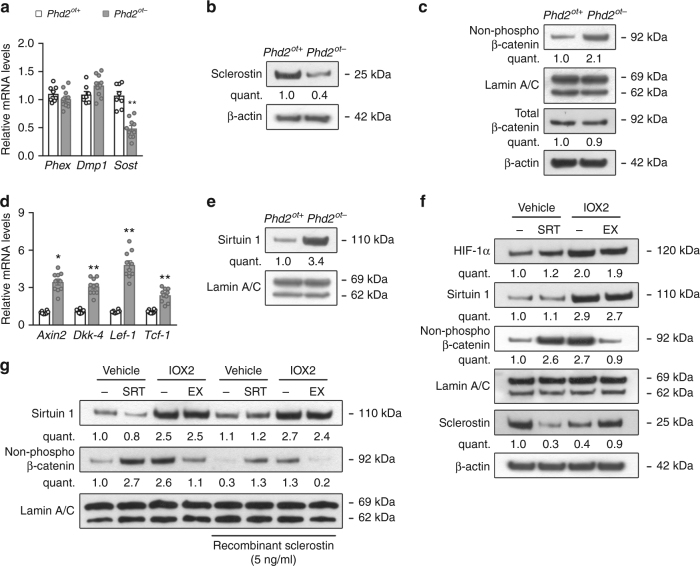
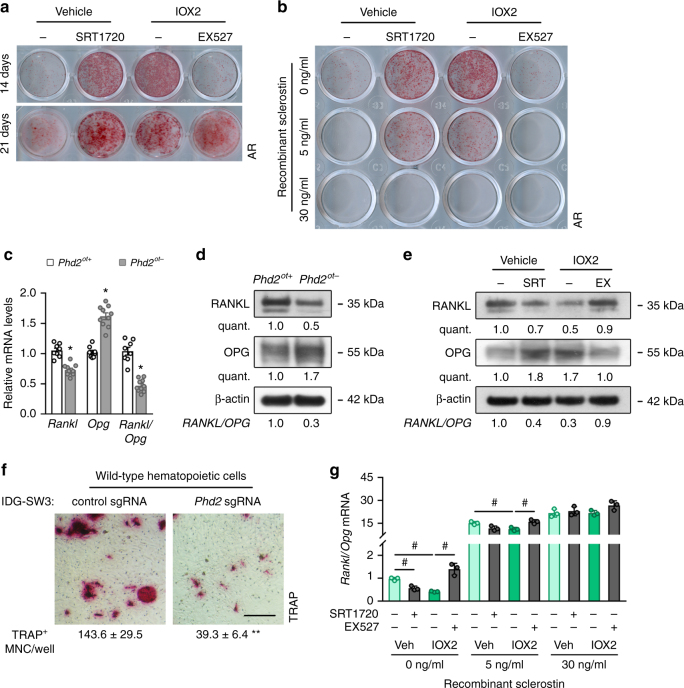
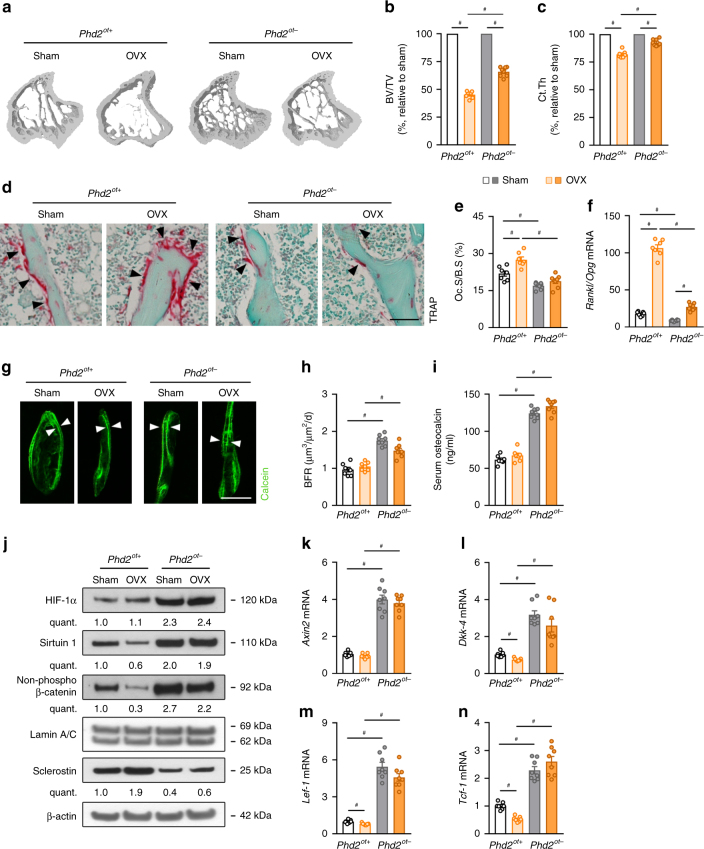
Preservation of bone mass is crucial for healthy ageing and largely depends on adequate responses of matrix-embedded osteocytes. These cells control bone formation and resorption concurrently by secreting the WNT/β-catenin antagonist sclerostin (SOST). Osteocytes reside within a low oxygen microenvironment, but whether and how oxygen sensing regulates their function remains elusive. Here, we show that conditional deletion of the oxygen sensor prolyl hydroxylase (PHD) 2 in osteocytes results in a high bone mass phenotype, which is caused by increased bone formation and decreased resorption. Mechanistically, enhanced HIF-1α signalling increases Sirtuin 1-dependent deacetylation of the Sost promoter, resulting in decreased sclerostin expression and enhanced WNT/β-catenin signalling. Additionally, genetic ablation of PHD2 in osteocytes blunts osteoporotic bone loss induced by oestrogen deficiency or mechanical unloading. Thus, oxygen sensing by PHD2 in osteocytes negatively regulates bone mass through epigenetic regulation of sclerostin and targeting PHD2 elicits an osteo-anabolic response in osteoporotic models.
Overview
The claims and statistics of this paper haven’t been checked yet.
Run the check — free, no account needed. It reads the open-access text and checks the sources it cites.
Integrity signals
Registry
Cites
Statistics
Figures
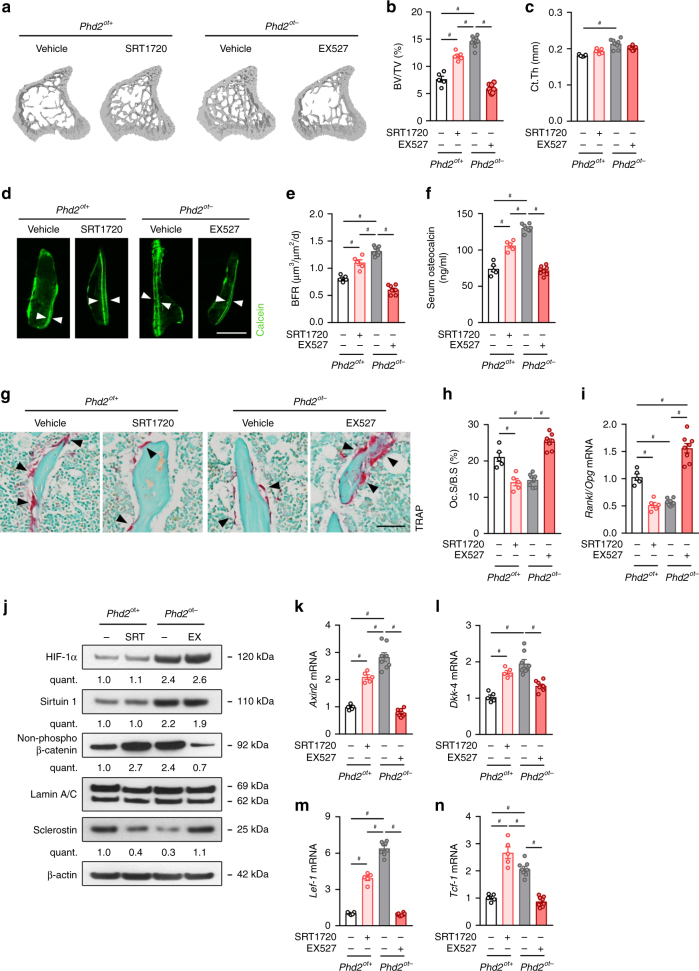
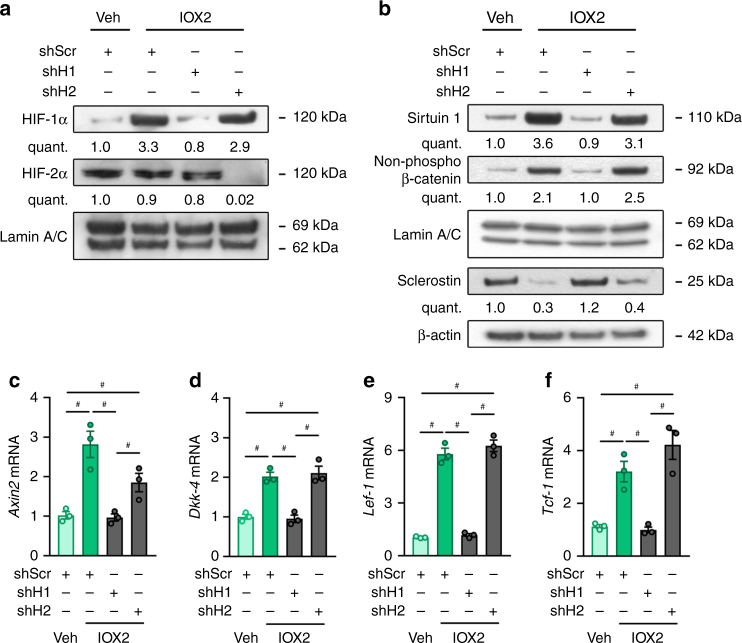
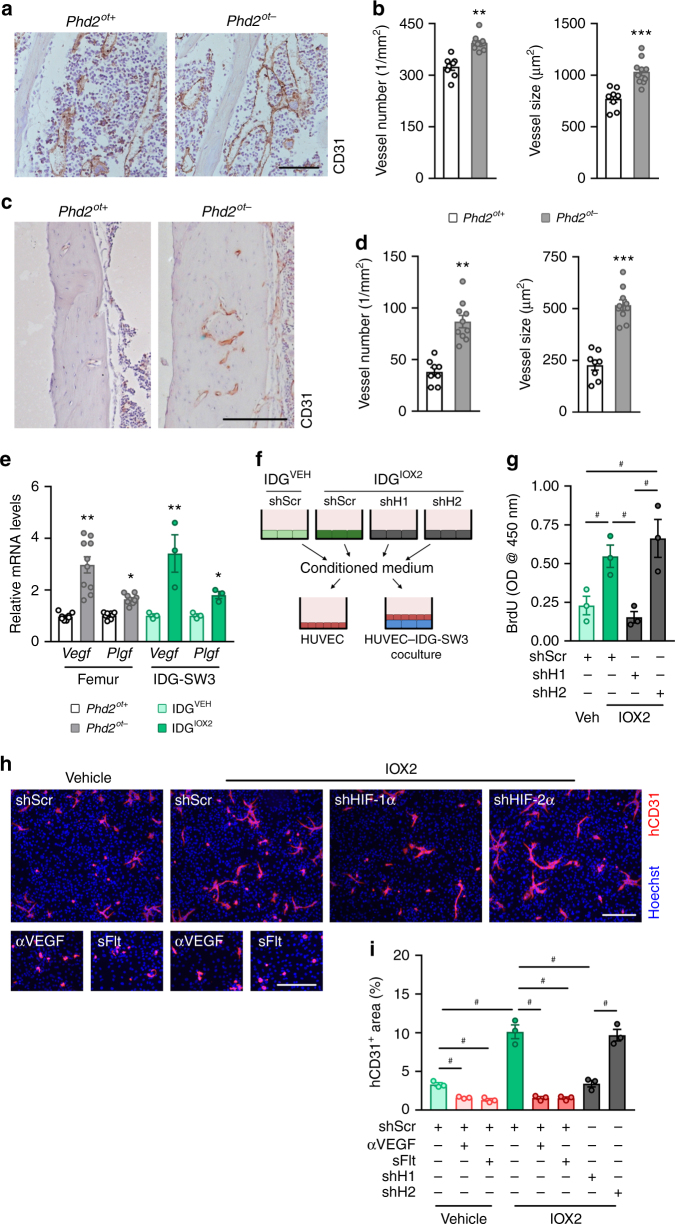
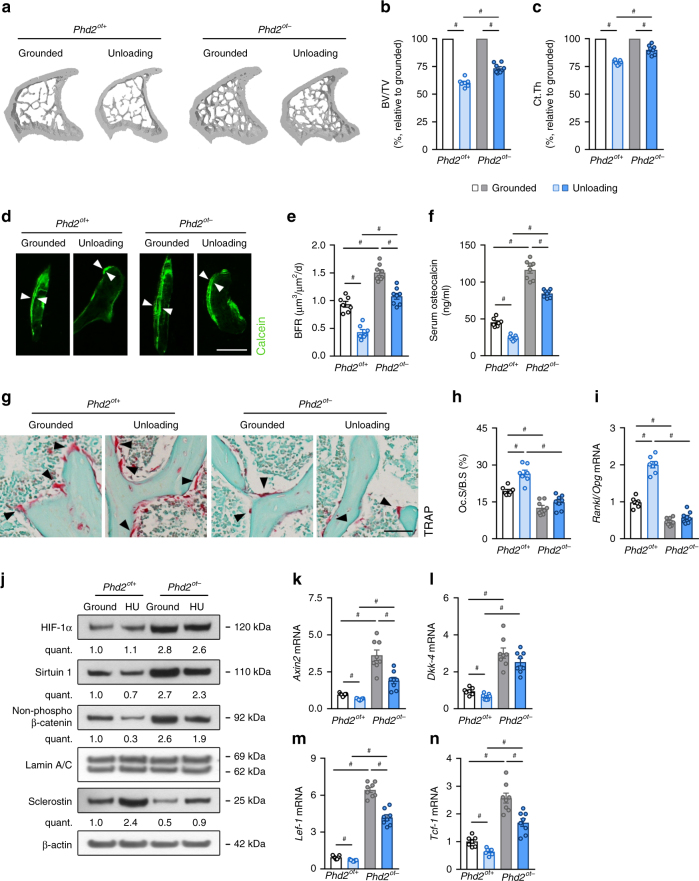
Verification
Claims the paper makes
The claims and statistics of this paper haven’t been checked yet.
Run the check — free, no account needed. It reads the open-access text and checks the sources it cites.
Claims other papers make about this one
Each is checked against this paper’s own text: does it say what the citing paper says it does?
In the citing paper
“Osteocytes can also decrease SOST expression after sensing decreases in oxygen levels.47”
From Bone remodeling: an operational process ensuring survival and bone mechanical competence (2022) · cites this paper as [47]
Self-check
Percentages, sums and reported differences re-computed from the paper’s own numbers.
The self-check needs the paper’s full text.
Citations
Cites
Guidelines for assessment of bone microstructure in rodents using micro–computed tomography
Bouxsein, M., Boyd, S. K., Christiansen, B., Guldberg, R. E., Jepsen, K. J., & Müller, R. (2010) · Journal of Bone and Mineral Research · doi:10.1002/jbmr.141 · Cited by 4,461
Epstein, A. C. R., Gleadle, J. M., McNeill, L. A., Hewitson, K. S., O'Rourke, J., Mole, D. R., Mukherji, M., Metzen, E., Wilson, M. I., Dhanda, A., et al. (2001) · Cell · doi:10.1016/s0092-8674(01)00507-4 · Cited by 3,333
Self-citationDempster, D. W., Compston, J. E., Drezner, M. K., Glorieux, F. H., Kanis, J. A., Malluche, H., Meunier, P. J., Ott, S. M., Recker, R. R., & Parfitt, A. M. (2013) · Journal of Bone and Mineral Research · doi:10.1002/jbmr.1805 · Cited by 2,543
Regulation of angiogenesis by hypoxia: role of the HIF system
Pugh, C. W., & Ratcliffe, P. J. (2003) · Nature Medicine · doi:10.1038/nm0603-677 · Cited by 2,520
Bonewald, L. F. (2011) · Journal of Bone and Mineral Research · doi:10.1002/jbmr.320 · Cited by 2,287
Coupling of angiogenesis and osteogenesis by a specific vessel subtype in bone
Kusumbe, A. P., Ramasamy, S. K., & Adams, R. H. (2014) · Nature · doi:10.1038/nature13145 · Cited by 2,155
WNT signaling in bone homeostasis and disease: From human mutations to treatments
Baron, R., & Kneissel, M. (2013) · Nature Medicine · doi:10.1038/nm.3074 · Cited by 2,093
Evidence for osteocyte regulation of bone homeostasis through RANKL expression
Nakashima, T., Hayashi, M., Fukunaga, T., Kurata, K., Oh-hora, M., Feng, J. Q., Bonewald, L. F., Kodama, T., Wutz, A., Wagner, E. F., et al. (2011) · Nature Medicine · doi:10.1038/nm.2452 · Cited by 1,778
Mechanical Stimulation of Bone in Vivo Reduces Osteocyte Expression of Sost/Sclerostin
Robling, A. G., Niziolek, P. J., Baldridge, L. A., Condon, K. W., Allen, M. R., Alam, I., Mantila, S. M., Gluhak-Heinrich, J., Bellido, T. M., Harris, S. E., et al. (2008) · Journal of Biological Chemistry · doi:10.1074/jbc.m705092200 · Cited by 1,350
Matrix-embedded cells control osteoclast formation
Xiong, J., Onal, M., Jilka, R. L., Weinstein, R. S., Manolagas, S. C., & O'Brien, C. A. (2011) · Nature Medicine · doi:10.1038/nm.2448 · Cited by 1,304
Cited by
Sorted by citations
Wnt/β-catenin signalling: function, biological mechanisms, and therapeutic opportunities
Liu, J., Xiao, Q., Xiao, J., Niu, C., Li, Y., Zhang, X., Zhou, Z., Shu, G., & Yin, G. (2022) · Signal Transduction and Targeted Therapy · doi:10.1038/s41392-021-00762-6 · Cited by 2,519
“In a hypoxic environment, the activity of PHD2 in osteocytes is reduced and HIF signalling is enhanced, improving the activity of the canonical Wnt signalling pathway through the HIF-SIRT1-SOST-β-catenin signalling axis, thereby promoting bone formation mediated by the activated Wnt/β-catenin signalling pathway and in…”
BackgroundThe sirtuin family in health and disease
Wu, Q., Zhang, T., Chen, H., Yu, X., Lv, J.-L., Liu, Y., Liu, Y., Zheng, G., Zhao, J.-Q., Wei, Y., et al. (2022) · Signal Transduction and Targeted Therapy · doi:10.1038/s41392-022-01257-8 · Cited by 928
Molecular mechanosensors in osteocytes
Qin, L., Liu, W., Cao, H., & Xiao, G. (2020) · Bone Research · doi:10.1038/s41413-020-0099-y · Cited by 484
Bone remodeling: an operational process ensuring survival and bone mechanical competence
Bolamperti, S., Villa, I., & Rubinacci, A. (2022) · Bone Research · doi:10.1038/s41413-022-00219-8 · Cited by 482
“Osteocytes can also decrease SOST expression after sensing decreases in oxygen levels.(47) In vivo anatomical studies have suggested that the presence of apoptotic osteocytes at microdamaged sites correlates with the recruitment of osteoclasts at microcracks.”
BackgroundOsteocyte-Related Cytokines Regulate Osteoclast Formation and Bone Resorption
Kitaura, H., Marahleh, A., Ohori, F., Noguchi, T., Shen, W.-R., Qi, J., Nara, Y., Pramusita, A., Kinjo, R., & Mizoguchi, I. (2020) · International Journal of Molecular Sciences · doi:10.3390/ijms21145169 · Cited by 405
“Osteocytes also control osteogenesis through the fine tuning of their oxygen sensing apparatus prolyl hydroxylase 2 (PHD 2), in which silencing of PHD 2 causes an increase in bone mass and strength and protects against bone loss caused by estrogen deficiency and absence of mechanical loading, through decreased express…”
BackgroundThe Regulation of Bone Metabolism and Disorders by Wnt Signaling
Maeda, K., Kobayashi, Y., Koide, M., Uehara, S., Okamoto, M., Ishihara, A., Kayama, T., Saito, M., & Marumo, K. (2019) · International Journal of Molecular Sciences · doi:10.3390/ijms20225525 · Cited by 360
“On the other hand, hypoxia increases Sirtuin 1-dependent deacetylation of the Sost promoter, resulting in decreased sclerostin expression and enhanced Wnt/β-catenin signaling in osteocytes [89].”
BackgroundHIF-1α metabolically controls collagen synthesis and modification in chondrocytes
Stegen, S., Laperre, K., Eelen, G., Rinaldi, G., Fraisl, P., Torrekens, S., Looveren, R. V., Loopmans, S., Bultynck, G., Vinckier, S., et al. (2019) · Nature · doi:10.1038/s41586-019-0874-3 · Cited by 323
Self-citationLipid availability determines fate of skeletal progenitor cells via SOX9
van Gastel, N., Stegen, S., Eelen, G., Schoors, S., Carlier, A., Daniëls, V. W., Baryawno, N., Przybylski, D., Depypere, M., Stiers, P., et al. (2020) · Nature · doi:10.1038/s41586-020-2050-1 · Cited by 238
Self-citationSun, H., Xu, J., Wang, Y., Shen, S., Xu, X., Zhang, L., & Jiang, Q. Y. (2023) · Bioactive Materials · doi:10.1016/j.bioactmat.2022.12.021 · Cited by 215
“but also inhibit the metabolic transformation and osteogenesis of BMSC, which in turn significantly reduce the expression of osteogenic markers and mineralization [4,5].”
BackgroundOxidative stress: A common pathological state in a high-risk population for osteoporosis
Zhang, C., Li, H., Li, J., Hu, J., Yang, K., & Tao, L. (2023) · Biomedicine & Pharmacotherapy · doi:10.1016/j.biopha.2023.114834 · Cited by 219
Biological basis of bone strength: anatomy, physiology and measurement.
Hart, N. H., Newton, R. U., Tan, J., Rantalainen, T., Chivers, P., Siafarikas, A., & Nimphius, S. (2020) · PubMed Central · Cited by 137
Sirtuins and FoxOs in osteoporosis and osteoarthritis
Almeida, M., & Porter, R. M. (2019) · Bone · doi:10.1016/j.bone.2019.01.018 · Cited by 131
Glutamine Metabolism Controls Chondrocyte Identity and Function
Stegen, S., Rinaldi, G., Loopmans, S., Stockmans, I., Moermans, K., Thienpont, B., Fendt, S., Carmeliet, P., & Carmeliet, G. (2020) · Developmental Cell · doi:10.1016/j.devcel.2020.05.001 · Cited by 130
Self-citationThe Roles of Epigenetics Regulation in Bone Metabolism and Osteoporosis
Xu, F., Li, W., Yang, X. Y., Na, L., Chen, L., & Liu, G. (2021) · Frontiers in Cell and Developmental Biology · doi:10.3389/fcell.2020.619301 · Cited by 117
The role of sirtuin 1 and its activator, resveratrol in osteoarthritis
Deng, Z., Li, Y.-S., Liu, H., Xiao, S., Li, L.-J., Tian, J., Cheng, C., Zhang, G., & Zhang, F.-J. (2019) · Bioscience Reports · doi:10.1042/bsr20190189 · Cited by 96
Hypoxia Signaling in the Skeleton: Implications for Bone Health
Yellowley, C. E., & Genetos, D. C. (2019) · Current Osteoporosis Reports · doi:10.1007/s11914-019-00500-6 · Cited by 94
Cui, D., Kong, N., Ding, L., Guo, Y., Yang, W. R., & Yan, F. (2021) · Advanced Healthcare Materials · doi:10.1002/adhm.202101215 · Cited by 90
Bioceramic Scaffolds with Antioxidative Functions for ROS Scavenging and Osteochondral Regeneration
Deng, C., Zhou, Q., Zhang, M., Li, T., Chen, H., Xu, C. W., Feng, Q., Wang, X., Yin, F., Cheng, Y., et al. (2022) · Advanced Science · doi:10.1002/advs.202105727 · Cited by 76
Osteoporosis Treatment with Anti-Sclerostin Antibodies—Mechanisms of Action and Clinical Application
Rauner, M., Taipaleenmäki, H., Tsourdi, E. A., & Winter, E. M. (2021) · Journal of Clinical Medicine · doi:10.3390/jcm10040787 · Cited by 79
Energy metabolism: A newly emerging target of BMP signaling in bone homeostasis
Yang, J., Ueharu, H., & Mishina, Y. M. (2020) · Bone · doi:10.1016/j.bone.2020.115467 · Cited by 76
Wu, C., Liu, R., Huan, S., Tang, W., Zeng, Y.-K., Zhang, J., Yang, J., Li, Z., Zhou, Y., Zha, Z., et al. (2022) · Arthritis Research & Therapy · doi:10.1186/s13075-022-02747-4 · Cited by 70
“The lack of SOST aggravates OA by modulating the turnover and cell apoptosis of the subchondral bone, thus destructing the bone homeostasis [100, 101].”
BackgroundStegen, S., Devignes, C.-S., Torrekens, S., Looveren, R. V., Carmeliet, P., & Carmeliet, G. (2020) · Journal of Bone and Mineral Research · doi:10.1002/jbmr.4219 · Cited by 67
“Eight-week-old male mice were injected with either 80 μg/kg PTH (human PTH [1-34], Bachem AG) or vehicle control (0.”
MethodSelf-citationStegen, S., Moermans, K., Stockmans, I., Thienpont, B., & Carmeliet, G. (2024) · Nature Metabolism · doi:10.1038/s42255-023-00948-y · Cited by 65
“Histomorphometric analyses on mouse tibiae were performed as previously described 39,41,43 .”
MethodInfluentialSelf-citationIn silico experiments of bone remodeling explore metabolic diseases and their drug treatment
KAMEO, Y., Yuki, M. I. Y. A., Hayashi, M., Nakashima, T., & ADACHI, T. (2020) · Science Advances · doi:10.1126/sciadv.aax0938 · Cited by 60
Li, Q., Cheng, J. C. Y., Jiang, Q. Y., & Lee, W. (2021) · Aging Cell · doi:10.1111/acel.13301 · Cited by 60
Yan, Y., Wang, L., Ge, L., & Pathak, J. L. (2020) · Current Osteoporosis Reports · doi:10.1007/s11914-020-00564-9 · Cited by 63
Ex Vivo Organ Cultures as Models to Study Bone Biology
Bellido, T., & Delgado‐Calle, J. (2020) · JBMR Plus · doi:10.1002/jbm4.10345 · Cited by 57
“Similarly, Stegen and colleagues employed ex vivo osteocyte-enriched bone cultures to study the effects of oxygen in osteocytes and identified the oxygen-sensing Phd2 as an important regulator of sclerostin and bone mass.((31)) Moreover, osteocyte-enriched cultures have been used to study the effects of aging on osteo…”
BackgroundStudies on Osteocytes in Their 3D Native Matrix Versus 2D In Vitro Models
Zhang, C., Bakker, A. D., Klein‐Nulend, J., & Bravenboer, N. (2019) · Current Osteoporosis Reports · doi:10.1007/s11914-019-00521-1 · Cited by 53
Hypoxia-Inducible Factors Signaling in Osteogenesis and Skeletal Repair
Qin, Q., Liu, Y., Yang, Z. L., Aimaijiang, M., Ma, R., Yang, Y., Zhang, Y., & Zhou, Y. (2022) · International Journal of Molecular Sciences · doi:10.3390/ijms231911201 · Cited by 59
Bioinspired injectable hydrogels for bone regeneration
Tang, X., Zhou, F., Wang, S., Wang, G., Bai, L., & Su, J. (2024) · Journal of Advanced Research · doi:10.1016/j.jare.2024.10.032 · Cited by 61
“Low-oxygen level can inhibit the metabolic transformation and osteogenesis of bone marrow stem cells (BMSCs), which in turn signifi-cantly reduce the therapeutic effect of bone regeneration [129,130].”
Brent, M. B. (2023) · Pharmacology & Therapeutics · doi:10.1016/j.pharmthera.2023.108383 · Cited by 52
Ma, L., Li, G., Lei, J., Song, Y., Feng, X., Tan, L., Luo, R., Liao, Z., Shi, Y., Zhang, W., et al. (2021) · ACS Nano · doi:10.1021/acsnano.1c07150 · Cited by 48
Zhang, Y., Yang, K., Yang, J., Lao, Y., Deng, L., Deng, G., Yi, J., Sun, X., & Wang, Q. (2020) · Cell Reports · doi:10.1016/j.celrep.2020.01.036 · Cited by 44
Stegen, S., & Carmeliet, G. (2019) · Current Opinion in Nephrology & Hypertension · doi:10.1097/mnh.0000000000000508 · Cited by 44
Self-citationCuproptosis-a potential target for the treatment of osteoporosis
Li, D., Gao, Z., Li, Q., Liu, X., & Liu, H. (2023) · Frontiers in Endocrinology · doi:10.3389/fendo.2023.1135181 · Cited by 40
“Recently, it has been shown that osteoblasts and osteoclasts, which maintain bone homeostasis, are oxygen-sensing cells (30), and hypoxia regulates bone remodeling and bone remodeling turnover (31).”
BackgroundWang, H., Wang, X., Ma, L., Huang, X., Peng, Y., Huang, H., Gao, X., Chen, Y., & Cao, Z. (2022) · Annals of the New York Academy of Sciences · doi:10.1111/nyas.14872 · Cited by 38
Exploring the Role of Hormones and Cytokines in Osteoporosis Development
Umur, E., Bulut, S. B., Yiğit, P., Bayrak, E., Arkan, Y., Arslan, F., Baysoy, E., Kaleli‐Can, G., & Ayan, B. (2024) · Biomedicines · doi:10.3390/biomedicines12081830 · Cited by 42
Bone metabolism regulation: Implications for the treatment of bone diseases
Yao, D., Huang, L., Ke, J., Zhang, M., Xiao, Q., & Zhu, X. M. (2020) · Biomedicine & Pharmacotherapy · doi:10.1016/j.biopha.2020.110494 · Cited by 41
Brent, M. B. (2021) · Bone · doi:10.1016/j.bone.2021.116258 · Cited by 38
Song, X., Tang, Y., Zhu, J., Tian, Y., Song, Z.-H., Hu, X. F., Hong, C., Cai, Y., & Kang, F. (2020) · Tissue and Cell · doi:10.1016/j.tice.2020.101402 · Cited by 37
Energy Metabolism of Osteocytes
Karthik, V., & Guntur, A. R. (2021) · Current Osteoporosis Reports · doi:10.1007/s11914-021-00688-6 · Cited by 40
Oxygen-Generating Biomaterials for Translational Bone Regenerative Engineering
Hosseini, F. S., Abedini, A. A., Chen, F., Whitfield, T., Ude, C. C., & Laurencin, C. T. (2023) · ACS Applied Materials & Interfaces · doi:10.1021/acsami.2c20715 · Cited by 35
Osteocyte Vegf-a contributes to myeloma-associated angiogenesis and is regulated by Fgf23
Mulcrone, P. L., Edwards, S. K. E., Petrusca, D. N., Haneline, L. S., Delgado‐Calle, J., & Roodman, G. D. (2020) · Scientific Reports · doi:10.1038/s41598-020-74352-x · Cited by 34
Evidence of the static magnetic field effects on bone-related diseases and bone cells
Yang, J., Feng, Y., Li, Q., & Zeng, Y. H. (2022) · Progress in Biophysics and Molecular Biology · doi:10.1016/j.pbiomolbio.2022.11.006 · Cited by 45
HIF-1α Mediates Osteoclast-Induced Mandibular Condyle Growth via AMPK Signaling
Tang, Y., Hong, C., Cai, Y., Zhu, J., Hu, X., Tian, Y., Song, X., Song, Z., Jiang, R., & Kang, F. (2020) · Journal of Dental Research · doi:10.1177/0022034520935788 · Cited by 30
“HIF-1α was considered to be required for osteoclast activation in postmenopausal osteoporosis (Miyauchi et al. 2013; Loots et al. 2018; Stegen et al. 2018).”
BackgroundZhu, S.-Q., Liu, J., Zhao, J., Zhou, B.-H., Zhang, Y., & Wang, H. (2022) · Environmental Pollution · doi:10.1016/j.envpol.2022.120396 · Cited by 29
Jin, Y., Zhou, B.-H., Zhao, J., Ommati, M. M., Wang, S., & Wang, H. (2023) · Environmental Pollution · doi:10.1016/j.envpol.2023.122407 · Cited by 31
Hypoxia-Inducible Factors Regulate Osteoclasts in Health and Disease
Meng, X., Wielockx, B., Rauner, M., & Bözec, A. (2021) · Frontiers in Cell and Developmental Biology · doi:10.3389/fcell.2021.658893 · Cited by 28
Mechanical strain-mediated reduction in RANKL expression is associated with RUNX2 and BRD2
Galea, G. L., Paradise, C. R., Meakin, L. B., Camilleri, E. T., Taipaleenmäki, H., Stein, G. S., Lanyon, L. E., Price, J. S., van Wijnen, A. J., & Dudakovic, A. (2020) · Gene · doi:10.1016/j.gene.2020.100027 · Cited by 27
“Epigenetic regulation of SOST expression through DNA methylation has previously been reported (Delgado-Calle et al., 2012; Reppe et al., 2015; Lhaneche et al., 2016; Stegen et al., 2018).”
BackgroundUbiquitin‐specific peptidases: Players in bone metabolism
Shen, J., Lin, X., Dai, F., Chen, G., Lin, H., Fang, B., & Liu, H. (2023) · Cell Proliferation · doi:10.1111/cpr.13444 · Cited by 27
Xu, Y.-X., Zheng, S., Tang, Z., Zhong, Q., Chen, R., Wang, P.-K., Fu, J., Xie, J., Ning, Y., Lei, M., et al. (2024) · Materials Today Bio · doi:10.1016/j.mtbio.2024.101267 · Cited by 32
“Reduced oxygen levels not only affect the proliferation and vitality of bone marrow mesenchymal stem cells (BMSCs) but also inhibit their metabolic conversion and osteogenic effects [12,13].”
BackgroundChen, K., Zhao, J., Qiu, M., Zhang, L., Yang, K., Chang, L., Jia, P., Jin, Q., Deng, L., & Li, C. (2022) · Frontiers in Cell and Developmental Biology · doi:10.3389/fcell.2021.721561 · Cited by 26
Regulation of sclerostin by the SIRT1 stabilization pathway in osteocytes
Kim, J., Yang, Y.-S., Xie, J., Lee, O., Kim, J., Hong, J., Boldyreff, B., Filhol, O., Chun, H., Greenblatt, M. B., et al. (2022) · Cell Death and Differentiation · doi:10.1038/s41418-022-00952-x · Cited by 26
“Previous studies have demonstrated that SIRT1 plays a role in bone remodeling by promoting bone formation and inhibiting bone resorption and that SIRT1-dependent suppression of sclerostin expression contributes to increased bone mass mediated by SIRT1 activation [14, 16, 45].”
BackgroundMethodPhysicochemical Niche Conditions and Mechanosensing by Osteocytes and Myocytes
Jin, J., Bakker, A. D., Wu, G., Klein‐Nulend, J., & Jaspers, R. T. (2019) · Current Osteoporosis Reports · doi:10.1007/s11914-019-00522-0 · Cited by 26
Oxygen‐Releasing Hydrogels for Tissue Regeneration
Jiang, S., Zheng, Y., Xia, H., Liu, Z., Rao, S., Wang, Y., Sun, H., Lu, X., & Xie, C. (2024) · Advanced NanoBiomed Research · doi:10.1002/anbr.202300133 · Cited by 27
Zeng, X., Yuan, X., Liao, H., Wei, Y., Wu, Q., Zhu, X., Li, Q., Chen, S., & Hu, M. (2024) · American Journal Of Pathology · doi:10.1016/j.ajpath.2024.07.022 · Cited by 26
Sirt1 Promotes a Thermogenic Gene Program in Bone Marrow Adipocytes: From Mice to (Wo)Men
Artsi, H., Gurt, I., El-Haj, M., Müller, R., Kuhn, G. A., Ben-Shalom, G., Cohen‐Kfir, E., Abramowitz, E., Kandel, L., Safran, O., et al. (2019) · Frontiers in Endocrinology · doi:10.3389/fendo.2019.00126 · Cited by 25
“Our findings were recently confirmed (40).”
ResultParacrine Mechanisms of Redox Signalling for Postmitotic Cell and Tissue Regeneration
Hervera, A., Santos, C. X. C., Virgiliis, F. D., Shah, A. M., & Giovanni, S. D. (2019) · Trends in Cell Biology · doi:10.1016/j.tcb.2019.01.006 · Cited by 24
Li, Q., Yue, T., Du, X., Tang, Z., Cui, J., Wang, W., Xia, W., Ren, B., Kan, S., Li, C., et al. (2022) · Cell Death and Differentiation · doi:10.1038/s41418-022-01068-y · Cited by 24
“Data were presented as described previously [35].”
Osteocyte Egln1/Phd2 links oxygen sensing and biomineralization via FGF23
Noonan, M. L., Ni, P., Solis, E., Marambio, Y. G., Agoro, R., Chu, X., Wang, Y., Gao, H., Xuei, X., Clinkenbeard, E. L., et al. (2023) · Bone Research · doi:10.1038/s41413-022-00241-w · Cited by 25
“More recently, Phd2 deletion in osteocytes produced mice with increased bone mass (BMD) and strength at basal levels in vivo which was associated with lower Wnt-inhibitor Sclerostin (Sost) expression and resistance to skeletal unloading and ovariectomy associated with low bone mass phenotypes.(10) Thus, in combination…”
BackgroundResultInfluentialSelf-citationHypoxia‐Inducible Factor‐2α Signaling in the Skeletal System
Mendoza, S. V., Genetos, D. C., & Yellowley, C. E. (2023) · JBMR Plus · doi:10.1002/jbm4.10733 · Cited by 26
“Osteocyte-specific deletion of Phd2 (Dmp1-cre; Phd2) generated a significant increase in trabecular and cortical bone mass, wherein bone remodeling was enhanced in young mice and bone resorption was reduced in aging mice, ultimately increasing bone strength.((74)) Phd2 is highly expressed in osteocytes compared with o…”
BackgroundFouad-Elhady, E. A., Aglan, H. A., Hassan, R. E., Ahmed, H. H., & Sabry, G. M. (2020) · Heliyon · doi:10.1016/j.heliyon.2020.e03341 · Cited by 21
“It is well known that HIF-1α supresses SOST gene expression [43].”
BackgroundResultInfluentialEpigenetic Regulation of Skeletal Tissue Integrity and Osteoporosis Development
Chen, Y., Lian, W., Kuo, C.-W., Ke, H.-J., Wang, S.-Y., Kuo, P.-C., Jahr, H., & Wang, F. (2020) · International Journal of Molecular Sciences · doi:10.3390/ijms21144923 · Cited by 23
Wirsig, K., Kilian, D., von Witzleben, M., Gelinsky, M., & Bernhardt, A. (2022) · European Journal of Cell Biology · doi:10.1016/j.ejcb.2022.151256 · Cited by 18
Li, J., Chen, Z., Liao, H., Zhong, Y., Hua, J., Su, M., Li, J., Xu, J., Cui, L., & Cui, Y. (2021) · Frontiers in Pharmacology · doi:10.3389/fphar.2021.772190 · Cited by 17
“Activation of hypoxia-inducible factor (HIF) along with an increased supply of oxygen and nutrients was proposed to underlie bone anabolism in mice lacking the oxygen sensor prolyl hydroxylase (PHD)2 (Stegen et al., 2018).”
BackgroundZeng, J., Xiao, Q. F., Li, X., & Chen, J. (2021) · International Journal of Molecular Medicine · doi:10.3892/ijmm.2021.4941 · Cited by 16
Osteocytes: New Kids on the Block for Cancer in Bone Therapy
Anloague, A., & Delgado‐Calle, J. (2023) · Cancers · doi:10.3390/cancers15092645 · Cited by 17
“oxygen levels and induce vascular changes in the bone marrow [66,67].”
BackgroundHistone Acetylation in the Epigenetic Regulation of Bone Metabolism and Related Diseases
Tian, Q., Gao, S., Zhou, X., Zheng, L., & Zhou, Y. (2021) · Stem Cells International · doi:10.1155/2021/8043346 · Cited by 16
“Stegen and colleagues found enhanced Wnt/β-catenin after the deletion of PHD2, which resulted in a high bone mass phenotype at last, and SIRT1dependent epigenetic regulation of SOST promoter activation may be the underlying mechanism [25].”
BackgroundWnt Antagonists in Hematopoietic and Immune Cell Fate: Implications for Osteoporosis Therapies
Chicana, B. J., Donham, C., Millan, A. J., & Manilay, J. O. (2019) · Current Osteoporosis Reports · doi:10.1007/s11914-019-00503-3 · Cited by 17
HIF-1α mediates osteoclast-induced disuse osteoporosis via cytoophidia in the femur of mice
Bie, M., Tang, Y., Xia, Y., Zhang, Q., Tian, Y., Cheng, C., Li, X., Qi, X., & Kang, F. (2022) · Bone · doi:10.1016/j.bone.2022.116648 · Cited by 15
Shiraki, M., Xu, X., Iovanna, J., Kukita, T., Hirata, H., Kamohara, A., Kubota, Y., Miyamoto, H., Mawatari, M., & Kukita, A. (2019) · The FASEB Journal · doi:10.1096/fj.201802322rr · Cited by 13
Maillard, S., Sicard, L., Andrique, C., Torrens, C., Lesieur, J., Baroukh, B., Coradin, T., Poliard, A., Slimani, L., & Chaussain, C. (2021) · Acta Biomaterialia · doi:10.1016/j.actbio.2021.11.046 · Cited by 13
Hypoxia Pathway in Osteoporosis: Laboratory Data for Clinical Prospects
Wang, J., Zhao, B., Che, J., & Shang, P. (2023) · International Journal of Environmental Research and Public Health · doi:10.3390/ijerph20043129 · Cited by 14
“It was also proved that the knocked-out PHD2 gene activated the HIF-1α signaling pathway, which led to the decrease in sclerostin (SOST) expression and the enhancement of the response to the Wnt/β-catenin pathway, which finally showed the accumulation of bone mass [104].”
BackgroundThe Effects of Sclerostin on the Immune System
Donham, C., & Manilay, J. O. (2020) · Current Osteoporosis Reports · doi:10.1007/s11914-020-00563-w · Cited by 12
Li, F., Tan, Q., Li, F., Zhang, K., Liu, Z., Tian, Y., & Zhu, T. (2023) · Frontiers in Molecular Biosciences · doi:10.3389/fmolb.2023.1057154 · Cited by 11
“Additionally, it is acknowledged that Hif-1α can enhance Wnt/βcatenin signaling (Stegen et al., 2018); the increased transcription level of Hif-1α strengthens the notion that Wnt/β-catenin signaling activation takes place in subchondral bone osteoblasts in response to hypoxia.”
BackgroundHoppock, G. A., Buettmann, E. G., Denisco, J. A., Goldscheitter, G., Condyles, S. N., Juhl, O. J., Friedman, M. A., Zhang, Y., & Donahue, H. J. (2023) · American Journal of Physiology-Cell Physiology · doi:10.1152/ajpcell.00220.2023 · Cited by 11
Zhang, Y., Sun, H., Huang, F., Chen, Y., Ding, X., Zhou, C., Wu, Y. T., Zhang, Q., Ma, X., Wang, J., et al. (2024) · Journal of Bone and Mineral Research · doi:10.1093/jbmr/zjae042 · Cited by 12
PHD1-3 oxygen sensors in vivo—lessons learned from gene deletions
Jucht, A. E., & Scholz, C. C. (2024) · Pflügers Archiv - European Journal of Physiology · doi:10.1007/s00424-024-02944-x · Cited by 11
“Conditional deletion of Phd2 in osteocytes (Dentin Matrix Protein 1 (Dmp1)-Cre) increased the bone mass by enhanced bone formation and reduced resorption [140].”
BackgroundHydrogel promotes bone regeneration through various mechanisms: a review
Zheng, Y., Ke, Z., Hu, G., & Tong, S. (2024) · Biomedizinische Technik/Biomedical Engineering · doi:10.1515/bmt-2024-0391 · Cited by 10
Role of sirtuins in obesity and osteoporosis: molecular mechanisms and therapeutic targets
Du, Y., Huo, Y., Yang, Y., Lin, P., Liu, W., Wang, Z., Zeng, W., Li, J., Liang, Z., Yuan, C., et al. (2025) · Cell Communication and Signaling · doi:10.1186/s12964-024-02025-7 · Cited by 10
Hypoxia signaling in bone physiology and energy metabolism
Valle-Tenney, R., Melis, S., & Maes, C. (2023) · Current Opinion in Endocrine and Metabolic Research · doi:10.1016/j.coemr.2023.100473 · Cited by 11
Role of prolyl hydroxylase domain proteins in bone metabolism
Wolf, D., Muralidharan, A., & Mohan, S. (2022) · Osteoporosis and Sarcopenia · doi:10.1016/j.afos.2022.03.001 · Cited by 10
“5) Consistent with the findings that genetic ablation of Phd2 in chondrocytes and osteocytes increase bone mass, administration of pan-PHD inhibitor, dimethyloxalylglycine, rescued ovariectomy-induced bone loss [93].”
BackgroundPerfused Platforms to Mimic Bone Microenvironment at the Macro/Milli/Microscale: Pros and Cons
Lipreri, M. V., Baldini, N., Graziani, G., & Avnet, S. (2022) · Frontiers in Cell and Developmental Biology · doi:10.3389/fcell.2021.760667 · Cited by 10
Exploring epigenetic strategies for the treatment of osteoporosis
Yi, S.-J., Lim, J., & Kim, K. (2024) · Molecular Biology Reports · doi:10.1007/s11033-024-09353-4 · Cited by 9
“In wild-type mice, it induced a high-bone mass phenotype, associated with low sclerostin expression and increased WNT/β-catenin signaling in bone [145].”
Sirtuin 6 Overexpression Improves Rotator Cuff Tendon-to-Bone Healing in the Aged
Moon, Y. J., Cui, B., Cho, S., Hwang, J. W., Chung, H.-C., Kwon, J. S., Kim, D., Jang, K. Y., Kim, J. R., & Wang, S. I. (2023) · Cells · doi:10.3390/cells12162035 · Cited by 7
“Increased SIRT1-dependent deacetylation by deleting an oxygen sensor protein in osteocytes directly acts on the Sost promoter to reduce sclerostin expression and increase Wnt-β-catenin signals to increase bone mass [43].”
BackgroundDoms, S., Verlinden, L., Janssens, I., Vanhevel, J., Eerlings, R., Houtman, R., Kato, S., Mathieu, C., Decallonne, B., Carmeliet, G., et al. (2024) · Bone Research · doi:10.1038/s41413-024-00343-7 · Cited by 7
Self-citationArtsi, H., Cohen‐Kfir, E., Shahar, R., Kalish-Achrai, N., Lishinsky-Fischer, N., & Dresner–Pollak, R. (2022) · Frontiers in Endocrinology · doi:10.3389/fendo.2022.1032262 · Cited by 7
Hyperbaric Oxygen Therapy Does Not Have a Negative Impact on Bone Signaling Pathways in Humans
Salmón, Z., Anchuelo, J., Borregán, J. C. R., del Real, Á., Sañudo, C., García‐Unzueta, M. T., Riancho, J. A., & Valero, C. (2021) · Healthcare · doi:10.3390/healthcare9121714 · Cited by 7
Cui, D., Chen, C., Luo, B., & Yan, F. (2021) · Journal of Leukocyte Biology · doi:10.1002/jlb.1ma0321-761r · Cited by 7
LncRNA-mRNA Expression Profiles of Osteoclast After Conditional Knockout HIF-1α
Tian, Y., Shao, Q., Gu, J., Tang, Y., Bie, M., Zhou, Y., Cheng, C., Liang, Y., Zhang, Q., & Kang, F. (2022) · Frontiers in Genetics · doi:10.3389/fgene.2022.909095 · Cited by 6
“HIF-1α also affects bone cells, such as osteoblasts, chondrocytes and osteoclasts, and immune cells, which also perform vital functions in supporting bone metastasis (Devignes et al., 2018; Stegen et al., 2018; Stegen et al., 2019).”
BackgroundLiu, Y., Liu, S., Du, J., Xu, J., Li, J., Guo, L., & Liu, Y. F. (2025) · Bioactive Materials · doi:10.1016/j.bioactmat.2025.07.020 · Cited by 8
“However, local hypoxic microenvironments are believed to inhibit the proliferation and survival of MSCs, thereby lowering their differentiation ability [15,16]. including osteogenic differentiation functions [17].”
Fan, X., Li, B., Chai, S., Zhang, R., Cai, C., & Ge, R.-L. (2024) · International Journal of Molecular Sciences · doi:10.3390/ijms26010010 · Cited by 5
Osteocytic oxygen sensing: Distinct impacts of VHL and HIF-2alpha on bone integrity
Mendoza, S. V., Wells, K. V., Murugesh, D. K., Hum, N. R., Sebastian, A., Gorman, B. M., Wong, A., Osipov, B., Christiansen, B., Loots, G. G., et al. (2024) · Bone · doi:10.1016/j.bone.2024.117339 · Cited by 5
“We have previously established a fundamental role of osteocytic oxygen-sensing in skeletal development through deletion of Vhl [10], which was also observed in osteocytic deletion of select prolyl hydroxylases [11].”
Specification of Sprouty2 functions in osteogenesis in in vivo context
Veselá, B., Švandová, E., Hovořáková, M., Peterková, R., Kratochvílová, A., Pasovská, M., Ramešová, A., Lesot, H., & Matalová, E. (2019) · Organogenesis · doi:10.1080/15476278.2019.1656995 · Cited by 5
Zhang, Y.-S., Yu, J.-N., Han, M.-Z., Si, B., Li, Z., & Han, J. (2025) · Frontiers in Medicine · doi:10.3389/fmed.2025.1597116 · Cited by 4
Complete Blood Count Parameters and Bone Health: Clinical and Experimental Evidence
Ha, J., Ono, M., Zhu, H., Cencer, C. S., Ge, X., & Wu, J. Y. (2025) · Endocrinology and Metabolism · doi:10.3803/enm.2025.2695 · Cited by 4
Du, M., Xia, Y., Sun, J., Meng, Y., Wang, L., Yan, S., & Zhang, Q. (2024) · International Journal of Biological Macromolecules · doi:10.1016/j.ijbiomac.2024.139090 · Cited by 4
Sirtuins: exploring next-gen therapeutics in the pathogenesis osteoporosis and associated diseases
Waykar, T. R., Mandlik, S. K., & Mandlik, D. S. (2024) · Immunopharmacology and Immunotoxicology · doi:10.1080/08923973.2024.2315418 · Cited by 5
“According to a recent study, it was shown that SiRt1's deacetylation of the SOSt promoter caused a reduction in the expression of sclerostin and an enhancement of wNt/β catenin signaling. this ultimately led to an increase in the bone mass of mice (Figure 5(b)) [44].”
BackgroundJiang, Y.-Y., Xie, Y.-T., Chen, Z., Li, K., & Zheng, X.-B. (2020) · Journal of Biomedical Materials Research. Part A · doi:10.1002/jbm.a.37020 · Cited by 4
Vascular endothelial growth factor and bone–vascular interactions
Stegen, S., & Carmeliet, G. (2019) · Elsevier eBooks · doi:10.1016/b978-0-12-814841-9.00046-4 · Cited by 4
Self-citation
Metadata
- Authors
- Stegen, S., Stockmans, I., Moermans, K., Thienpont, B., Maxwell, P. H., Carmeliet, P., & Carmeliet, G.
- Affiliations
- KU Leuven (BE)
- University of Cambridge (GB)
- VIB-KU Leuven Center for Cancer Biology (BE)
- Corresponding author
- Carmeliet, Geert
- Venue
- Nature Communications
- Published
- 2018-07-02
- Volume
- 9
- Issue
- 1
- Pages
- 2557-2557
- ISSN
- 2041-1723 (ISSN-L)
- PMC
- PMC6028485
- OpenAlex
- W2810241167
- Cited by
- 126
- References
- 64
- Citations by year
- 2026: 11 · 2025: 9 · 2024: 18 · 2023: 16 · 2022: 20 · 2021: 15 · 2020: 23 · 2019: 14
- FWCI
- 4.62
- Type
- journal article
- Language
- en
- Open access
- gold
- doi.org
- Locations
- Nature Communications (publishedVersion, cc-by)
- Europe PMC (PubMed Central) (publishedVersion, other-oa)
- PubMed Central (publishedVersion, cc-by)
- PubMed (publishedVersion)
- Lirias (submittedVersion, other-oa)
- Apollo (University of Cambridge) (submittedVersion, cc-by)
- RePEc: Research Papers in Economics (submittedVersion)
- DOAJ (DOAJ: Directory of Open Access Journals) (submittedVersion)
- DOAJ (DOAJ: Directory of Open Access Journals) (submittedVersion, cc-by-sa)
- Apollo (cc-by)
- Funders
- Wellcome Trust (096956/Z/11/Z)
- National Institute for Health and Care Research (NF-SI-0514-10122)
- Fonds Wetenschappelijk Onderzoek (12H5917N, G0A4216N)
- Vlaamse regering
- Topics
- Life Sciences › Biochemistry, Genetics and Molecular Biology › Molecular Biology › Bone Metabolism and Diseases
- Health Sciences › Medicine › Orthopedics and Sports Medicine › Bone health and osteoporosis research
- Health Sciences › Medicine › Endocrinology, Diabetes and Metabolism › Alkaline Phosphatase Research Studies
- Keywords
- osteocytes, oxygen sensing, prolyl hydroxylase 2, sclerostin, HIF-1α, SIRT1, histone deacetylation, Wnt/β-catenin signaling, bone mass regulation, bone formation, bone resorption, osteoporosis, estrogen deficiency, mechanical unloading, epigenetic regulation
- MeSH terms
- Acetylation, Animals, Carbazoles, Cell Line, Disease Models, Animal, Female, Glycoproteins, Heterocyclic Compounds, 4 or More Rings, Humans, Male, Mice, Inbred C57BL, Mice, Transgenic, Osteocytes, Osteogenesis, Osteoporosis, Oxygen, Promoter Regions, Genetic, Bone Density, Coculture Techniques, Intercellular Signaling Peptides and Proteins, Epigenesis, Genetic, Adaptor Proteins, Signal Transducing, Hypoxia-Inducible Factor 1, alpha Subunit, Sirtuin 1, Wnt Signaling Pathway, Primary Cell Culture, Hypoxia-Inducible Factor-Proline Dioxygenases
About these checks
Registry, retraction, Cites and statistics results are computed, not judged, with one exception: a printed reference that no index lists is read once by a model before it counts as a citation error. Claims are extracted by a model and kept only when their quote appears verbatim in the text; each cited source is then checked, with a model’s help, for whether it says what the claim relies on. Those verdicts can be wrong — read the claim’s quote and the cited source before relying on one.
Statistics and arithmetic are recomputed, not judged.
Confidence bands are shown only for fields calibrated on our annotated test set. None is calibrated yet, so no band is shown.
What counts as a claim ›How we measure confidence ›How we check this ›
Are you an author, or do you see a problem with this page? Request a review
