

The DOI matches its Crossref record; 70 of the 70 references it cites were found in a registry or an index.
Competitive repopulation of an empty microglial niche yields functionally distinct subsets of microglia-like cells
Open accessAbstract
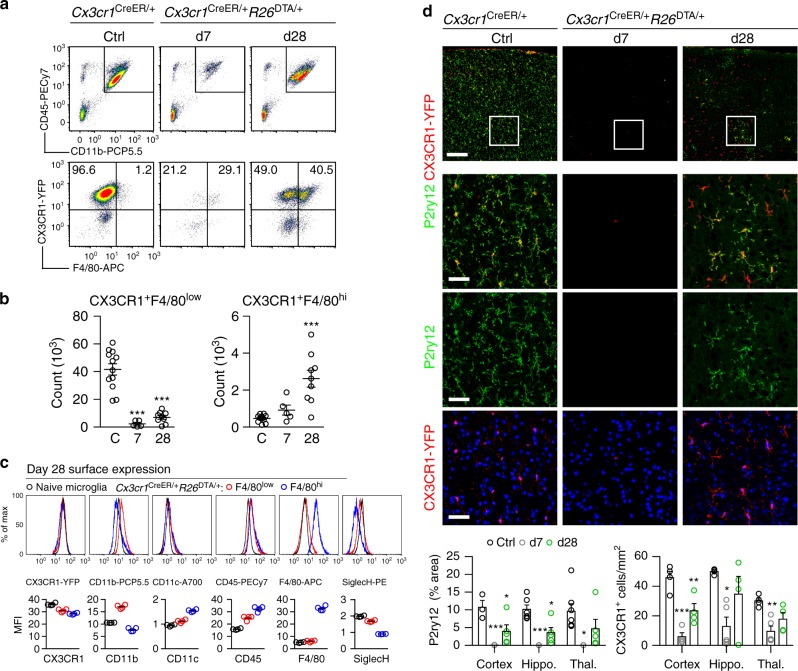
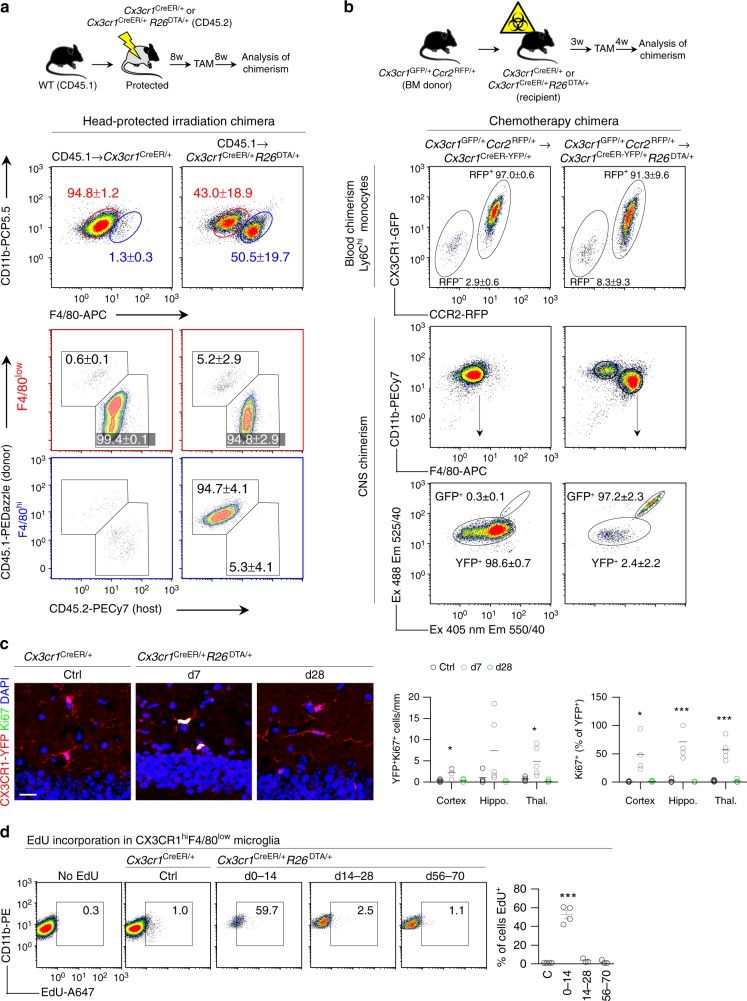
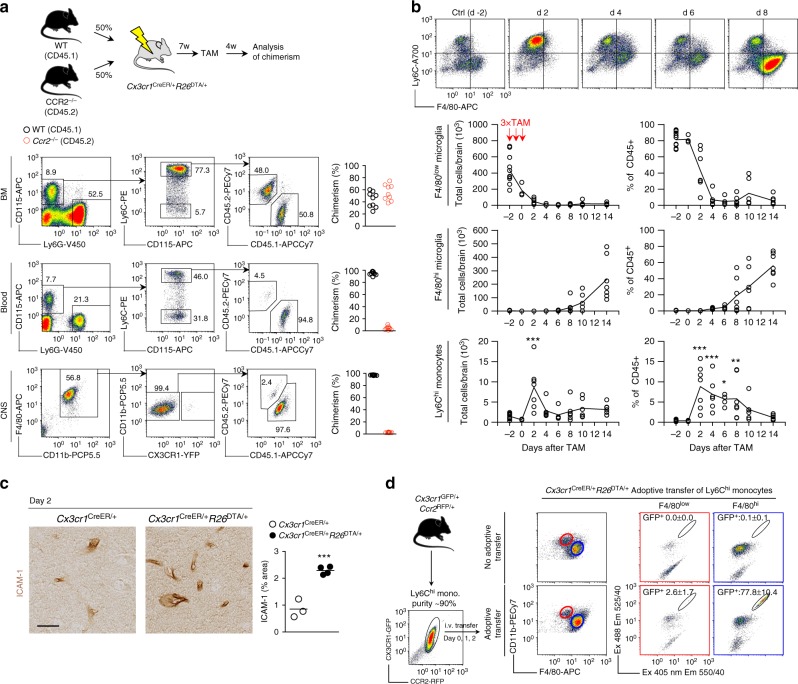
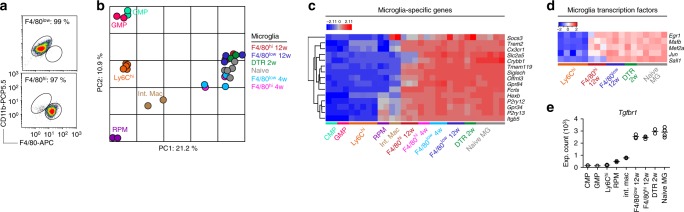
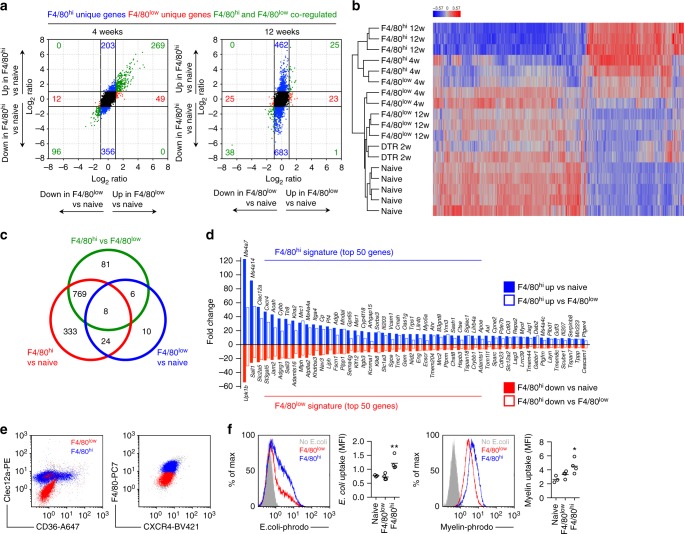
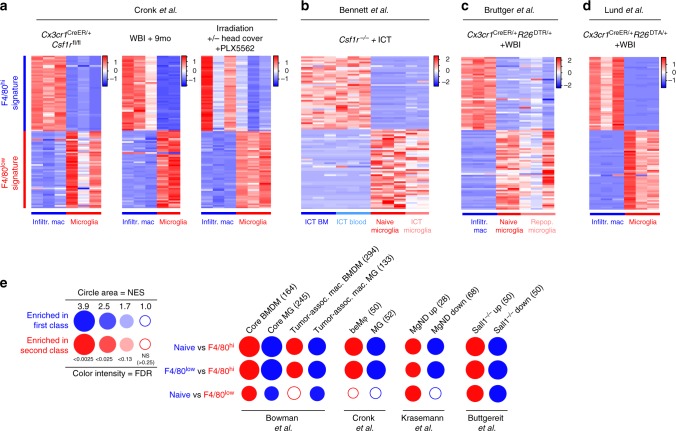
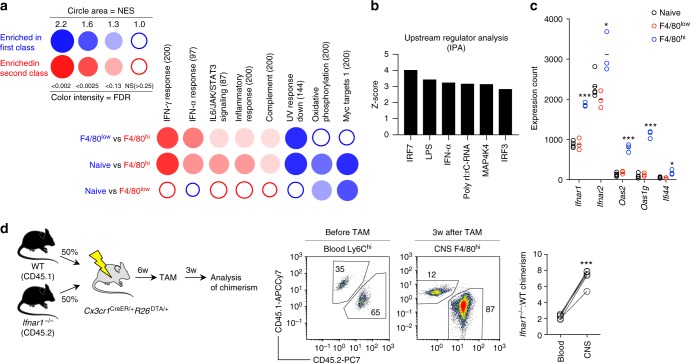
Circulating monocytes can compete for virtually any tissue macrophage niche and become long-lived replacements that are phenotypically indistinguishable from their embryonic counterparts. As the factors regulating this process are incompletely understood, we studied niche competition in the brain by depleting microglia with >95% efficiency using Cx3cr1 CreER/+ R26 DTA/+ mice and monitored long-term repopulation. Here we show that the microglial niche is repopulated within weeks by a combination of local proliferation of CX3CR1 + F4/80 low Clec12a – microglia and infiltration of CX3CR1 + F4/80 hi Clec12a + macrophages that arise directly from Ly6C hi monocytes. This colonization is independent of blood brain barrier breakdown, paralleled by vascular activation, and regulated by type I interferon. Ly6C hi monocytes upregulate microglia gene expression and adopt microglia DNA methylation signatures, but retain a distinct gene signature from proliferating microglia, displaying altered surface marker expression, phagocytic capacity and cytokine production. Our results demonstrate that monocytes are imprinted by the CNS microenvironment but remain transcriptionally, epigenetically and functionally distinct.
Overview
The claims and statistics of this paper haven’t been checked yet.
Run the check — free, no account needed. It reads the open-access text and checks the sources it cites.
Integrity signals
Registry
Cites
Statistics
Figures
Verification
Claims the paper makes
The claims and statistics of this paper haven’t been checked yet.
Run the check — free, no account needed. It reads the open-access text and checks the sources it cites.
Claims other papers make about this one
Each is checked against this paper’s own text: does it say what the citing paper says it does?
The cited source doesn’t support the claim as written.
In the citing paper
“Moreover, recent studies have reported that during aging or neurodegeneration, bone marrow-derived blood monocytes can infiltrate the brain through a disrupted blood-brain barrier (BBB) and differentiate into microglia-like cells, exhibiting transcriptional and functional similarity to brain-resident microglia13–15.”
From Somatic cancer variants enriched in Alzheimer’s disease microglia-like cells drive inflammatory and proliferative states (2026) · cites this paper as [13]
Checked by a reasoning model — may be wrong.
Experimental — accuracy not yet measuredThe cited source doesn’t support the claim as written.
In the citing paper
“Interestingly, MoMg and to a lesser extend HSC-M F displayed expression of Sall1 , as compared to leptomeningeal M F ( Fig. 4f ), suggesting that also engrafted cells in BM chimeras can acquire this proposed 'microglia signature' marker 14,18,19 .”
From Clonal hematopoiesis-associated motoric deficits caused by monocyte-derived microglia accumulating in aging mice (2025) · cites this paper as [19]
Checked by a reasoning model — may be wrong.
Experimental — accuracy not yet measuredThe cited source says what the claim attributes to it.
In the citing paper
“Marrow-derived cells may have an ameliorative effect on neurodegenerative phenotypes in mice33,34, possibly due to their superior phagocytic capacity35.”
From Clonal hematopoiesis is associated with protection from Alzheimer’s disease (2023) · cites this paper as [35]
The cited source says what the claim attributes to it.
In the citing paper
“This includes, for instance, lack of expression of the transcriptional repressor Spalt Like Transcription Factor 1 (Sall1), a proposed hallmark of microglia identity 14,18,19 .”
From Clonal hematopoiesis-associated motoric deficits caused by monocyte-derived microglia accumulating in aging mice (2025) · cites this paper as [19]
Self-check
Percentages, sums and reported differences re-computed from the paper’s own numbers.
The self-check needs the paper’s full text.
Citations
Cites
1 retracted
Microglia-dependent synapse loss in type I interferon-mediated lupus
Bialas, A. R., Presumey, J., Das, A., van der Poel, C. E., Lapchak, P. H., Mesin, L., Victora, G., Tsokos, G. C., Mawrin, C., Herbst, R., et al. (2017) · Nature · doi:10.1038/nature22821 · Cited by 197
RetractedThe Molecular Signatures Database Hallmark Gene Set Collection
Liberzon, A., Birger, C., Thorvaldsdóttir, H., Ghandi, M., Mesirov, J. P., & Tamayo, P. (2015) · Cell Systems · doi:10.1016/j.cels.2015.12.004 · Cited by 13,807
Fate Mapping Analysis Reveals That Adult Microglia Derive from Primitive Macrophages
Ginhoux, F., Greter, M., Leboeuf, M., Nandi, S., See, P., Gokhan, S., Mehler, M. F., Conway, S. J., Ng, L. G., Stanley, E. R., et al. (2010) · Science · doi:10.1126/science.1194637 · Cited by 5,175
Fate Mapping Reveals Origins and Dynamics of Monocytes and Tissue Macrophages under Homeostasis
Yona, S., Kim, K.-W., Wolf, Y., Mildner, A., Varol, D., Breker, M., Strauss-Ayali, D., Viukov, S., Guilliams, M., Misharin, A., et al. (2013) · Immunity · doi:10.1016/j.immuni.2012.12.001 · Cited by 3,245
Krasemann, S., Madore, C., Cialic, R., Baufeld, C., Calcagno, N., El Fatimy, R., Beckers, L., O’Loughlin, E., Xu, Y., Fanek, Z., et al. (2017) · Immunity · doi:10.1016/j.immuni.2017.08.008 · Cited by 2,979
Self-citationMicroglia promote learning-dependent synapse formation through brain-derived neurotrophic factor
Parkhurst, C. N., Yang, G., Ninan, I., Savas, J. N., Yates, J. R., Lafaille, J. J., Hempstead, B. L., Littman, D. R., & Gan, W.-B. (2013) · Cell · doi:10.1016/j.cell.2013.11.030 · Cited by 2,599
A Lineage of Myeloid Cells Independent of Myb and Hematopoietic Stem Cells
Schulz, C., Perdiguero, E. G., Chorro, L., Szabo-Rogers, H., Cagnard, N., Kierdorf, K., Prinz, M., Wu, B., Jacobsen, S. E. W., Pollard, J. W., et al. (2012) · Science · doi:10.1126/science.1219179 · Cited by 2,578
Identification of a unique TGF-β–dependent molecular and functional signature in microglia
Butovsky, O., Jedrychowski, M. P., Moore, C. S., Cialic, R., Lanser, A. J., Gabriely, G., Koeglsperger, T., Dake, B., Wu, P. M., Doykan, C. E., et al. (2014) · Nature Neuroscience · doi:10.1038/nn.3599 · Cited by 2,543
Self-citationTissue-resident macrophages originate from yolk-sac-derived erythro-myeloid progenitors
Gomez Perdiguero, E., Klapproth, K., Schulz, C., Busch, K., Azzoni, E., Crozet, L., Garner, H., Trouillet, C., de Bruijn, M. F., Geissmann, F., et al. (2015) · Nature · doi:10.1038/nature13989 · Cited by 2,339
Hashimoto, D., Chow, A., Noizat, C., Teo, P., Beasley, M. B., Leboeuf, M., Becker, C. D., See, P., Price, J., Lucas, D., et al. (2013) · Immunity · doi:10.1016/j.immuni.2013.04.004 · Cited by 2,311
Cited by
Sorted by citations
Microglia Biology: One Century of Evolving Concepts
Prinz, M., Jung, S., & Priller, J. (2019) · Cell · doi:10.1016/j.cell.2019.08.053 · Cited by 1,525
Macrophages in health and disease
Park, M. D., Silvin, A., Ginhoux, F., & Merad, M. (2022) · Cell · doi:10.1016/j.cell.2022.10.007 · Cited by 644
Glial Cells: Role of the Immune Response in Ischemic Stroke
Xu, S., Lü, J., Shao, A., Zhang, J. H., & Zhang, J. (2020) · Frontiers in Immunology · doi:10.3389/fimmu.2020.00294 · Cited by 626
Establishment and Maintenance of the Macrophage Niche
Guilliams, M., Thierry, G. R., Bonnardel, J., & Bajenoff, M. (2020) · Immunity · doi:10.1016/j.immuni.2020.02.015 · Cited by 512
Silvin, A., Uderhardt, S., Piot, C., Da Mesquita, S., Yang, K., Geirsdottir, L., Mulder, K., Eyal, D., Liu, Z., Bridlance, C., et al. (2022) · Immunity · doi:10.1016/j.immuni.2022.07.004 · Cited by 368
Self-citationOsorio, D., Zhong, Y., Li, G., Xu, Q., Yang, Y., Hillhouse, A., Chen, J., Davidson, L. A., Tian, Y., Chapkin, R. S., et al. (2021) · Patterns · doi:10.1016/j.patter.2022.100434 · Cited by 406
To Kill a Microglia: A Case for CSF1R Inhibitors
Green, K. N., Crapser, J. D., & Hohsfield, L. A. (2020) · Trends in Immunology · doi:10.1016/j.it.2020.07.001 · Cited by 265
Cien Años de Microglía: Milestones in a Century of Microglial Research
Sierra, A., Paolicelli, R. C., & Kettenmann, H. (2019) · Trends in Neurosciences · doi:10.1016/j.tins.2019.09.004 · Cited by 244
Jorfi, M., Park, J., Hall, C. K., Lin, C.-C. J., Chen, M., von Maydell, D., Kruskop, J. M., Kang, B., Choi, Y., Prokopenko, D., et al. (2023) · Nature Neuroscience · doi:10.1038/s41593-023-01415-3 · Cited by 214
Efficient Strategies for Microglia Replacement in the Central Nervous System
Xu, Z., Rao, Y., Huang, Y., Zhou, T. G., Feng, R., Xiong, S., Yuan, T., Qin, S., Lu, Y., Zhou, X., et al. (2020) · Cell Reports · doi:10.1016/j.celrep.2020.108041 · Cited by 189
Astrocytic phagocytosis is a compensatory mechanism for microglial dysfunction
Konishi, H., Okamoto, T., Hara, Y., Komine, O., Tamada, H., Maeda, M., Osako, F., Kobayashi, M., Nishiyama, A., Kataoka, Y., et al. (2020) · The EMBO Journal · doi:10.15252/embj.2020104464 · Cited by 179
Microglia as hackers of the matrix: sculpting synapses and the extracellular space
Crapser, J. D., Arreola, M. A., Tsourmas, K. I., & Green, K. N. (2021) · Cellular & Molecular Immunology · doi:10.1038/s41423-021-00751-3 · Cited by 178
Microglial/Macrophage polarization and function in brain injury and repair after stroke
Lyu, J., Xie, D., Bhatia, T. N., Leak, R. K., Hu, X., & Jiang, X. (2021) · CNS Neuroscience & Therapeutics · doi:10.1111/cns.13620 · Cited by 176
Clonal hematopoiesis is associated with protection from Alzheimer’s disease
Bouzid, H., Belk, J. A., Jan, M., Qi, Y., Sarnowski, C., Wirth, S., Ma, L., Chrostek, M. R., Ahmad, H., Nachun, D., et al. (2023) · Nature Medicine · doi:10.1038/s41591-023-02397-2 · Cited by 169
Emerging Principles in Myelopoiesis at Homeostasis and during Infection and Inflammation
Schultze, J. L., Mass, E., & Schlitzer, A. (2019) · Immunity · doi:10.1016/j.immuni.2019.01.019 · Cited by 174
Absence of microglia promotes diverse pathologies and early lethality in Alzheimer’s disease mice
Kiani Shabestari, S., Morabito, S., Danhash, E. P., McQuade, A., Sanchez, J. R., Miyoshi, E., Chadarevian, J. P., Claes, C., Coburn, M. A., Hasselmann, J., et al. (2022) · Cell Reports · doi:10.1016/j.celrep.2022.110961 · Cited by 167
Vlaminck, K. D., Hove, H. V., Kancheva, D., Scheyltjens, I., Antunes, A. R. P., Bastos, J., Vara‐Pérez, M., Ali, L., Mampay, M., Deneyer, L., et al. (2021) · Immunity · doi:10.1016/j.immuni.2022.09.005 · Cited by 169
Microglial autophagy–associated phagocytosis is essential for recovery from neuroinflammation
Berglund, R., Guerreiro-Cacais, A. O., Adzemovic, M. Z., Zeitelhofer, M., Lund, H., Ewing, E., Ruhrmann, S., Nutma, E., Parsa, R., Thessen-Hedreul, M., et al. (2020) · Science Immunology · doi:10.1126/sciimmunol.abb5077 · Cited by 149
Self-citationMicroglial depletion aggravates the severity of acute and chronic seizures in mice
Wu, W., Li, Y., Wei, Y., Bosco, D. B., Xie, M., Zhao, M., Richardson, J. R., & Wu, L. (2020) · Brain Behavior and Immunity · doi:10.1016/j.bbi.2020.06.028 · Cited by 133
Protective Microglial Subset in Development, Aging, and Disease: Lessons From Transcriptomic Studies
Benmamar-Badel, A., Owens, T., & Wlodarczyk, A. (2020) · Frontiers in Immunology · doi:10.3389/fimmu.2020.00430 · Cited by 124
Microglial metabolic disturbances and neuroinflammation in cerebral infarction
Takeda, H., Yamaguchi, T., Yano, H., & Tanaka, J. (2020) · Journal of Pharmacological Sciences · doi:10.1016/j.jphs.2020.11.007 · Cited by 133
Margeta, M. A., Yin, Z., Madore, C., Pitts, K. M., Letcher, S. M., Tang, J., Jiang, S., Gauthier, C. D., Silveira, S. R., Schroeder, C. M., et al. (2022) · Immunity · doi:10.1016/j.immuni.2022.07.014 · Cited by 130
Self-citationThe influence of environment and origin on brain resident macrophages and implications for therapy
Bennett, M. L., & Bennett, F. C. (2019) · Nature Neuroscience · doi:10.1038/s41593-019-0545-6 · Cited by 136
Treatment of a genetic brain disease by CNS-wide microglia replacement
Shibuya, Y., Kumar, K. K., Mader, M. M.-D., Yoo, Y., Ayala, L. A., Zhou, M., Mohr, M. A., Neumayer, G., Kumar, I., Yamamoto, R., et al. (2022) · Science Translational Medicine · doi:10.1126/scitranslmed.abl9945 · Cited by 124
Chiot, A., Zaïdi, S., Iltis, C., Ribon, M., Berriat, F., Schiaffino, L., Jolly, A., de la Grange, P., Mallat, M., Bohl, D., et al. (2020) · Nature Neuroscience · doi:10.1038/s41593-020-00718-z · Cited by 122
Distinct fate, dynamics and niches of renal macrophages of bone marrow or embryonic origins
Liu, F., Dai, S., Feng, D., Qin, Z., Peng, X., Sakamuri, S. S. V. P., Ren, M., Huang, L., Cheng, M., Mohammad, K. E., et al. (2020) · Nature Communications · doi:10.1038/s41467-020-16158-z · Cited by 130
Neuroprotection in glaucoma: Mechanisms beyond intraocular pressure lowering
Tribble, J. R., Hui, F., Quintero, H., Hajji, S. E., Bell, K. C., Polo, A. D., & Williams, P. A. (2023) · Molecular Aspects of Medicine · doi:10.1016/j.mam.2023.101193 · Cited by 124
The expanding world of tissue‐resident macrophages
Jenkins, S. J., & Allen, J. E. (2021) · European Journal of Immunology · doi:10.1002/eji.202048881 · Cited by 114
Sahasrabuddhe, V., & Ghosh, H. S. (2022) · Cell Reports · doi:10.1016/j.celrep.2021.110252 · Cited by 91
Microglia in brain development and regeneration
Mehl, L. C., Manjally, A. V., Bouadi, O., Gibson, E. M., & Tay, T. L. (2022) · Development · doi:10.1242/dev.200425 · Cited by 113
A Noninvasive Gut‐to‐Brain Oral Drug Delivery System for Treating Brain Tumors
Miao, Y., Chen, K., Chen, C., Mi, F., Lin, Y., Chang, Y., Chiang, C., Wang, J., Lin, K., & Sung, H. (2021) · Advanced Materials · doi:10.1002/adma.202100701 · Cited by 102
Engineering an inhibitor-resistant human CSF1R variant for microglia replacement
Chadarevian, J. P., Lombroso, S. I., Peet, G. C., Hasselmann, J., Tu, C. H., Marzan, D. E., Capocchi, J. K., Purnell, F. S., Nemec, K. M., Lahian, A., et al. (2022) · The Journal of Experimental Medicine · doi:10.1084/jem.20220857 · Cited by 101
Yan, P., Kim, K.-W., Xiao, Q., Ma, X., Czerniewski, L. R., Liu, H., Rawnsley, D. R., Yan, Y., Randolph, G. J., Epelman, S., et al. (2022) · Journal of Clinical Investigation · doi:10.1172/jci152565 · Cited by 95
Immunotherapy of Glioblastoma: Current Strategies and Challenges in Tumor Model Development
Majc, B., Novak, M., Kopitar‐Jerala, N., Jewett, A., & Breznik, B. (2021) · Cells · doi:10.3390/cells10020265 · Cited by 98
Microenvironmental Heterogeneity in Brain Malignancies
Perus, L. J. M., & Walsh, L. A. (2019) · Frontiers in Immunology · doi:10.3389/fimmu.2019.02294 · Cited by 96
Chen, H., Chen, C., Kuo, Y.-M., Chen, B., Kuan, I. S., Huang, H., Lee, J., Anthony, N. R., Kuan, C.-Y., & Sun, Y. (2021) · Theranostics · doi:10.7150/thno.64033 · Cited by 96
The contribution of the peripheral immune system to neurodegeneration
Berriat, F., Lobsiger, C. S., & Boillée, S. (2023) · Nature Neuroscience · doi:10.1038/s41593-023-01323-6 · Cited by 87
Coleman, L. G., Zou, J., & Crews, F. T. (2020) · Journal of Neuroinflammation · doi:10.1186/s12974-019-1678-y · Cited by 90
Sailor, K. A., Agoranos, G., López-Manzaneda, S., Tada, S., Gillet-Legrand, B., Guérinot, C., Masson, J., Vestergaard, C. L., Bonner, M. A., Gagnidze, K., et al. (2022) · Nature Medicine · doi:10.1038/s41591-022-01691-9 · Cited by 91
Ma, W., Silverman, S. M., Zhao, L., Villasmil, R., Campos, M. M., Amaral, J., & Wong, W. T. (2019) · eLife · doi:10.7554/elife.42049 · Cited by 88
Reactive gliosis in traumatic brain injury: a comprehensive review
Amlerova, Z., Chmelová, M., Anděrová, M., & Vargová, L. (2024) · Frontiers in Cellular Neuroscience · doi:10.3389/fncel.2024.1335849 · Cited by 89
Chadarevian, J. P., Hasselmann, J., Lahian, A., Capocchi, J. K., Escobar, A., Lim, T. E., Le, L., Tu, C., Nguyen, J., Kiani Shabestari, S., et al. (2024) · Neuron · doi:10.1016/j.neuron.2024.05.023 · Cited by 83
Role of myeloid cells in the immunosuppressive microenvironment in gliomas
Locarno, C. V., Simonelli, M., Carenza, C., Capucetti, A., Stanzani, E., Lorenzi, E., Persico, P., Bella, S. D., Passoni, L., Mavilio, D., et al. (2019) · Immunobiology · doi:10.1016/j.imbio.2019.10.002 · Cited by 74
Plaque-associated myeloid cells derive from resident microglia in an Alzheimer's disease model
Reed-Geaghan, E. G., Croxford, A. L., Becher, B., & Landreth, G. E. (2020) · Journal of Experimental Medicine · doi:10.1084/jem.20191374 · Cited by 72
Zhang, X., Li, H., Gu, Y., Ping, A., Chen, J., Qia, Z., Xu, Z., Wang, J., Tang, S., Wang, R., et al. (2025) · Nature Communications · doi:10.1038/s41467-025-58254-y · Cited by 72
Self-citationBrain Parenchymal and Extraparenchymal Macrophages in Development, Homeostasis, and Disease
Brioschi, S., Zhou, Y., & Colonna, M. (2020) · The Journal of Immunology · doi:10.4049/jimmunol.1900821 · Cited by 67
Quarta, A., Berneman, Z. N., & Ponsaerts, P. (2020) · Brain Behavior and Immunity · doi:10.1016/j.bbi.2020.03.023 · Cited by 68
Hohsfield, L. A., Najafi, A. R., Ghorbanian, Y., Soni, N., Hingco, E. E., Kim, S. J., Jue, A. D., Swarup, V., Inlay, M. A., & Green, K. N. (2020) · Journal of Neuroinflammation · doi:10.1186/s12974-020-01931-0 · Cited by 66
Han, J., Sarlus, H., Wszolek, Z. K., Karrenbauer, V. D., & Harris, R. A. (2020) · Acta Neuropathologica Communications · doi:10.1186/s40478-020-01093-3 · Cited by 65
Self-citationMuñoz-Castro, C., Mejias-Ortega, M., Sanchez-Mejias, E., Navarro, V., Trujillo-Estrada, L., Jimenez, S., Garcia-Leon, J. A., Fernandez-Valenzuela, J. J., Sanchez-Mico, M. V., Romero-Molina, C., et al. (2023) · Acta Neuropathologica Communications · doi:10.1186/s40478-023-01530-z · Cited by 66
Bastos, J., O’Brien, C. A., Vara‐Pérez, M., Mampay, M., van Olst, L., Barry-Carroll, L., Kancheva, D., Leduc, S., Lievens, A. L., Ali, L., et al. (2025) · Immunity · doi:10.1016/j.immuni.2025.04.006 · Cited by 74
Radiotherapy-induced remodeling of the tumor microenvironment by stromal cells
Berg, T. J., & Pietras, A. (2022) · Seminars in Cancer Biology · doi:10.1016/j.semcancer.2022.02.011 · Cited by 64
Church, K. A., Rodriguez, D., Vanegas, D., Gutiérrez, I. L., Cardona, S. M., Madrigal, J. L. M., Kaur, T., & Cardona, A. E. (2022) · Journal of Neuroinflammation · doi:10.1186/s12974-022-02659-9 · Cited by 65
Barclay, K. M., Abduljawad, N., Cheng, Z., Kim, M. W., Zhou, L., Yang, J., Rustenhoven, J., Mazzitelli, J. A., Smyth, L. C. D., Kapadia, D., et al. (2024) · Immunity · doi:10.1016/j.immuni.2024.05.005 · Cited by 65
Plasticity of monocyte development and monocyte fates
Trzebanski, S., & Jung, S. (2020) · Immunology Letters · doi:10.1016/j.imlet.2020.07.007 · Cited by 75
Microglial Function and Regulation during Development, Homeostasis and Alzheimer’s Disease
Casali, B. T., & Reed-Geaghan, E. G. (2021) · Cells · doi:10.3390/cells10040957 · Cited by 70
Aggravated brain injury after neonatal hypoxic ischemia in microglia-depleted mice
Tsuji, S., Martino, E. D., Mukai, T., Tsuji, S., Murakami, T., Harris, R. A., Blomgren, K., & Ådén, U. (2020) · Journal of Neuroinflammation · doi:10.1186/s12974-020-01792-7 · Cited by 63
Self-citationMicroglia promote anti-tumour immunity and suppress breast cancer brain metastasis
Evans, K. T., Blake, K., Longworth, A. J., Coburn, M., Insua‐Rodríguez, J., McMullen, T. P., Nguyen, Q., Ma, D., Lev, T., Hernandez, G. A., et al. (2023) · Nature Cell Biology · doi:10.1038/s41556-023-01273-y · Cited by 64
Microglial Responses to Brain Injury and Disease: Functional Diversity and New Opportunities
Lyu, J., Jiang, X., Leak, R. K., Shi, Y., Hu, X., & Chen, J. (2020) · Translational Stroke Research · doi:10.1007/s12975-020-00857-2 · Cited by 63
Macrophage compartmentalization in the brain and cerebrospinal fluid system
Munro, D. A. D., Movahedi, K., & Priller, J. (2022) · Science Immunology · doi:10.1126/sciimmunol.abk0391 · Cited by 59
The ins and outs of microglial cells in brain health and disease
Pallarés-Moratalla, C., & Bergers, G. (2024) · Frontiers in Immunology · doi:10.3389/fimmu.2024.1305087 · Cited by 66
Understanding microglial diversity and implications for neuronal function in health and disease
Schepper, S. D., Crowley, G., & Hong, S. Y. (2020) · Developmental Neurobiology · doi:10.1002/dneu.22777 · Cited by 54
CD163+ macrophages monitor enhanced permeability at the blood–dorsal root ganglion barrier
Lund, H., Hunt, M. A., Kurtović, Z., Sándor, K., Kägy, P. B., Fereydouni, N., Julien, A., Göritz, C., Vázquez-Liébanas, E., Mäe, M. A., et al. (2023) · The Journal of Experimental Medicine · doi:10.1084/jem.20230675 · Cited by 62
Self-citationTribble, J. R., Kokkali, E., Otmani, A., Plastino, F., Lardner, E., Vohra, R., Kolko, M., André, H., Morgan, J. E., & Williams, P. A. (2021) · Translational Vision Science & Technology · doi:10.1167/tvst.10.1.22 · Cited by 53
Microglia and Microglia-Like Cells: Similar but Different
Cuadros, M. Á., Sepúlveda, M. R., Martín‐Oliva, D., Marín‐Teva, J. L., & Neubrand, V. E. (2022) · Frontiers in Cellular Neuroscience · doi:10.3389/fncel.2022.816439 · Cited by 57
Dwellers and Trespassers: Mononuclear Phagocytes at the Borders of the Central Nervous System
Ivan, D. C., Walthert, S., Berve, K., Steudler, J., & Locatelli, G. (2021) · Frontiers in Immunology · doi:10.3389/fimmu.2020.609921 · Cited by 55
Yamanaka, G., Morıchı, S., Takamatsu, T., Watanabe, Y., Suzuki, S., Ishida, Y., Oana, S., Yamazaki, T., Takata, F., & Kawashima, H. (2021) · International Journal of Molecular Sciences · doi:10.3390/ijms22094395 · Cited by 54
Microglia, autonomic nervous system, immunity and hypertension: Is there a link?
Li, Y., Wei, B., Liu, X., Shen, X. Z., & Shi, P. D. (2019) · Pharmacological Research · doi:10.1016/j.phrs.2019.104451 · Cited by 54
Harnessing human iPSC-microglia for CNS-wide delivery of disease-modifying proteins
Chadarevian, J. P., Davtyan, H., Chadarevian, A. L., Nguyen, J., Capocchi, J. K., Le, L., Escobar, A., Chadarevian, T., Mansour, K., Deynega, E., et al. (2025) · Cell Stem Cell · doi:10.1016/j.stem.2025.03.009 · Cited by 60
Thorsdottir, S., Henriques‐Normark, B., & Iovino, F. (2019) · Frontiers in Microbiology · doi:10.3389/fmicb.2019.00576 · Cited by 52
Mechanisms of myeloid cell entry to the healthy and diseased central nervous system
Amann, L., Masuda, T., & Prinz, M. (2023) · Nature Immunology · doi:10.1038/s41590-022-01415-8 · Cited by 50
Widespread retina and optic nerve neuroinflammation in enucleated eyes from glaucoma patients
Rutigliani, C., Tribble, J. R., Hagström, A., Lardner, E., Jóhannesson, G., Stålhammar, G., & Williams, P. A. (2022) · Acta Neuropathologica Communications · doi:10.1186/s40478-022-01427-3 · Cited by 50
Neuroimmune interaction in seizures and epilepsy: focusing on monocyte infiltration
Bosco, D. B., Tian, D., & Wu, L. (2020) · FEBS Journal · doi:10.1111/febs.15428 · Cited by 49
Hohsfield, L. A., Najafi, A. R., Ghorbanian, Y., Soni, N., Crapser, J. D., Velez, D. X. F., Jiang, S., Royer, S. E., Kim, S. J., Henningfield, C. M., et al. (2021) · eLife · doi:10.7554/elife.66738 · Cited by 50
Basilico, B., Ferrucci, L., Khan, A., Angelantonio, S. D., Ragozzino, D., & Reverte, I. (2022) · Frontiers in Cellular Neuroscience · doi:10.3389/fncel.2022.1022431 · Cited by 52
The aging mouse CNS is protected by an autophagy-dependent microglia population promoted by IL-34
Berglund, R., Cheng, Y., Piket, E., Adzemovic, M. Z., Zeitelhofer, M., Olsson, T. P., Guerreiro‐Cacais, A. O., & Jagodic, M. (2024) · Nature Communications · doi:10.1038/s41467-023-44556-6 · Cited by 49
Self-citationCentral Nervous System Macrophages in Health and Disease
Hove, H. V., Feo, D. D., Greter, M., & Becher, B. (2025) · Annual Review of Immunology · doi:10.1146/annurev-immunol-082423-041334 · Cited by 53
Natural Killer Cell-Based Immunotherapy against Glioblastoma
Morimoto, T., Nakazawa, T., Maeoka, R., Nakagawa, I., Tsujimura, T., & Matsuda, R. (2023) · International Journal of Molecular Sciences · doi:10.3390/ijms24032111 · Cited by 51
Origin and Emergence of Microglia in the CNS—An Interesting (Hi)story of an Eccentric Cell
Dermitzakis, I., Μanthou, M. E., Meditskou, S., Tremblay, M., Petratos, S., Zoupi, L., Boziki, M. K., Kesidou, E., Simeonidou, C., & Theotokis, P. (2023) · Current Issues in Molecular Biology · doi:10.3390/cimb45030171 · Cited by 55
Macrophages and Autoantibodies in Demyelinating Diseases
Koike, H., & Katsuno, M. (2021) · Cells · doi:10.3390/cells10040844 · Cited by 49
Makinde, H. M., Winter, D. R., Procissi, D., Mike, E. V., Stock, A. D., Kando, M. J., Gadhvi, G. T., Droho, S., Bloomfield, C. L., Dominguez, S. T., et al. (2020) · Frontiers in Immunology · doi:10.3389/fimmu.2020.00230 · Cited by 45
The therapeutic potential of bone marrow‐derived macrophages in neurological diseases
Zhou, K., Han, J., Wang, Y., Xu, Y., Zhang, Y., & Zhu, C. (2022) · CNS Neuroscience & Therapeutics · doi:10.1111/cns.13964 · Cited by 44
Self-citationHan, J., Fan, Y., Zhou, K., Zhu, K., Blomgren, K., Lund, H., Zhang, X., & Harris, R. A. (2020) · International Journal of Molecular Sciences · doi:10.3390/ijms21228603 · Cited by 44
Self-citationMonocyte mobilisation, microbiota & mental illness
van de Wouw, M., Boehme, M., Dinan, T. G., & Cryan, J. F. (2019) · Brain Behavior and Immunity · doi:10.1016/j.bbi.2019.07.019 · Cited by 41
Macrophage and monocyte subsets in response to ischemic stroke
Blank-Stein, N., & Mass, E. (2023) · European Journal of Immunology · doi:10.1002/eji.202250233 · Cited by 40
Xing, Z., Zuo, Z., Hu, D., Zheng, X., Wang, X., Yuan, L., Zhou, L., Qi, F., & Yao, Z. (2020) · Brain Behavior and Immunity · doi:10.1016/j.bbi.2020.09.015 · Cited by 38
A Comparative Biology of Microglia Across Species
Sharma, K. P., Bisht, K., & Eyo, U. B. (2021) · Frontiers in Cell and Developmental Biology · doi:10.3389/fcell.2021.652748 · Cited by 46
Chen, D., Wang, C., Chen, X., Li, J., Chen, S., Li, Y., Ma, F., Li, T., Zou, M., Li, X., et al. (2025) · Science Translational Medicine · doi:10.1126/scitranslmed.ads6111 · Cited by 42
Wada, H., Otsuka, R., Germeraad, W. T. V., Murata, T., Kondo, T., & Seino, K.-I. (2023) · Journal for ImmunoTherapy of Cancer · doi:10.1136/jitc-2023-006677 · Cited by 39
Ketogenic diet inhibits glioma progression by promoting gut microbiota-derived butyrate production
Chen, M., He, Y., Dong, X., Liu, H.-F., Yan, Z., Lu, X.-L., Miao, Q.-Q., Zhao, Q., Zhang, H., Luo, L., et al. (2025) · Cancer Cell · doi:10.1016/j.ccell.2025.09.002 · Cited by 37
Self-citationAn overview of microglia ontogeny and maturation in the homeostatic and pathological brain
Mendes, M. S., & Majewska, A. K. (2021) · European Journal of Neuroscience · doi:10.1111/ejn.15225 · Cited by 35
Microglia modulate the cerebrovascular reactivity through ectonucleotidase CD39
Fu, Z., Ganesana, M., Hwang, P. H., Tan, X., Kinkaid, M. M., Sun, Y., Bian, E. J., Weybright, A., Chen, H., Sol‐Church, K., et al. (2025) · Nature Communications · doi:10.1038/s41467-025-56093-5 · Cited by 41
Macrophage-tumor cell interaction promotes ATRT progression and chemoresistance
Melcher, V., Graf, M., Interlandi, M., Moreno, N., de Faria, F. W., Kim, S. N., Kastrati, D., Korbanka, S., Alfert, A., Gerß, J., et al. (2019) · Acta Neuropathologica · doi:10.1007/s00401-019-02116-7 · Cited by 39
Kim, J.-S., Trzebanski, S., Shin, S.-H., Schori, L., Frumer Friedman, G. R., Ilani, N. C., Kadam, A., Vicario, R., Aust, O., Bugaeva, P., et al. (2025) · Cell Reports · doi:10.1016/j.celrep.2025.115609 · Cited by 33
VEGF-C-expressing TAMs rewire the metastatic fate of breast cancer cells
Banerjee, K., Kerzel, T., Bekkhus, T., Ferreira, S. D. S., Wallmann, T., Wallerius, M., Landwehr, L., Agardy, D. A., Schauer, N., Malmerfeldt, A., et al. (2023) · Cell Reports · doi:10.1016/j.celrep.2023.113507 · Cited by 33
Aisenberg, W. H., O’Brien, C. A., Sangster, M., Yaqoob, F., Zhang, Y., Temsamrit, B., Thom, S., Gosse, L., Chaluvadi, V. S., Elfayomi, B., et al. (2025) · Immunity · doi:10.1016/j.immuni.2025.03.019 · Cited by 31
Chen, C., Guderyon, M. J., Li, Y., Ge, G., Bhattacharjee, A., Ballard, C., He, Z., Masliah, E., Clark, R. A., O’Connor, J. C., et al. (2019) · Molecular Therapy — Methods & Clinical Development · doi:10.1016/j.omtm.2019.11.013 · Cited by 31
Advanced therapeutic strategies targeting microglia: beyond neuroinflammation
Kwon, M. (2022) · Archives of Pharmacal Research · doi:10.1007/s12272-022-01406-1 · Cited by 29
Du, S., Ou, F., Drieu, A., Xu, E. Z., Cheng, Y., Storck, S. E., Mamuladze, T., Cao, J., Abduljawad, N., Bhattarai, B., et al. (2026) · Neuron · doi:10.1016/j.neuron.2026.01.032 · Cited by 32
Hohsfield, L. A., Tsourmas, K. I., Ghorbanian, Y., Syage, A. R., Kim, S. J., Cheng, Y., Furman, S., Inlay, M. A., Lane, T. E., & Green, K. N. (2022) · Glia · doi:10.1002/glia.24144 · Cited by 25
Metadata
- Authors
- Lund, H., Pieber, M., Parsa, R., Han, J., Grommisch, D., Ewing, E., Kular, L., Needhamsen, M., Espinosa, A., Nilsson, E., Överby, A. K., Butovsky, O., Jagodic, M., Zhang, X.-M., & Harris, R. A.
- Affiliations
- Karolinska University Hospital (SE)
- Umeå University (SE)
- Brigham and Women's Hospital (US)
- Corresponding author
- Harris, Robert A.
- ORCID
- Venue
- Nature Communications
- Published
- 2018-11-19
- Volume
- 9
- Issue
- 1
- Pages
- 4845-4845
- ISSN
- 2041-1723 (ISSN-L)
- PMC
- PMC6242869
- OpenAlex
- W2901905540
- Cited by
- 249
- References
- 70
- Citations by year
- 2026: 23 · 2025: 36 · 2024: 39 · 2023: 33 · 2022: 36 · 2021: 26 · 2020: 39 · 2019: 17
- FWCI
- 9.20
- Type
- journal article
- Language
- en
- Open access
- gold
- doi.org
- Locations
- Nature Communications (publishedVersion, cc-by)
- Europe PMC (PubMed Central) (publishedVersion, other-oa)
- PubMed Central (publishedVersion, cc-by)
- PubMed (publishedVersion)
- KTH Publication Database DiVA (KTH Royal Institute of Technology) (submittedVersion, other-oa)
- RePEc: Research Papers in Economics (submittedVersion)
- DOAJ (DOAJ: Directory of Open Access Journals) (submittedVersion, cc-by-sa)
- DOAJ (DOAJ: Directory of Open Access Journals) (submittedVersion)
- Funders
- Hjärnfonden
- Karolinska Institutet
- Vetenskapsrådet
- Alzheimerfonden
- Science for Life Laboratory
- Servier
- National Institute of Neurological Disorders and Stroke (R01NS088137)
- Topics
- Life Sciences › Neuroscience › Neurology › Neuroinflammation and Neurodegeneration Mechanisms
- Life Sciences › Neuroscience › Developmental Neuroscience › Neurogenesis and neuroplasticity mechanisms
- Life Sciences › Neuroscience › Neurology › Barrier Structure and Function Studies
- Keywords
- microglia, niche competition, CX3CR1, CLEC12A, Ly6Chi monocytes, microglia-like cells, type I interferon, DNA methylation, epigenetic imprinting, phagocytosis, microglial proliferation, brain macrophages, vascular activation, blood-brain barrier
- MeSH terms
- CX3C Chemokine Receptor 1, Animals, Antigens, Differentiation, Antigens, Ly, Bacterial Proteins, Bone Marrow Cells, Brain, Gene Expression Regulation, Interferon Type I, Luminescent Proteins, Macrophages, Mice, Transgenic, Monocytes, Phagocytosis, Receptors, Mitogen, Whole-Body Irradiation, Signal Transduction, Microglia, Genes, Reporter, Transplantation Chimera, Cell Lineage, DNA Methylation, Adoptive Transfer, Lectins, C-Type, Cell Proliferation, Green Fluorescent Proteins, Mice
About these checks
Registry, retraction, Cites and statistics results are computed, not judged, with one exception: a printed reference that no index lists is read once by a model before it counts as a citation error. Claims are extracted by a model and kept only when their quote appears verbatim in the text; each cited source is then checked, with a model’s help, for whether it says what the claim relies on. Those verdicts can be wrong — read the claim’s quote and the cited source before relying on one.
Statistics and arithmetic are recomputed, not judged.
Confidence bands are shown only for fields calibrated on our annotated test set. None is calibrated yet, so no band is shown.
What counts as a claim ›How we measure confidence ›How we check this ›
Are you an author, or do you see a problem with this page? Request a review
