Cited by 72

The DOI matches its Crossref record; 10 of the 10 references it cites were found in a registry or an index.

Pluripotency reprogramming by competent and incompetent POU factors uncovers temporal dependency for Oct4 and Sox2

Malik, Vikas, Glaser, Laura V., Zimmer, Dennis, Velychko, Sergiy, Weng, Mingxi, Holzner, Markus, Arend, Marius, Chen, Yanpu, Srivastava, Yogesh, Veerapandian, Veeramohan, Shah, Zahir, Esteban, Miguel A., Wang, Huating, Chen, Jiekai, Schöler, Hans R., Hutchins, Andrew P., Meijsing, Sebastiaan H., Pott, Sebastian, Jauch, Ralf·2019·Nature Communications

Abstract

Oct4, along with Sox2 and Klf4 (SK), can induce pluripotency but structurally similar factors like Oct6 cannot. To decode why Oct4 has this unique ability, we compare Oct4-binding, accessibility patterns and transcriptional waves with Oct6 and an Oct4 mutant defective in the dimerization with Sox2 (Oct4 defSox2). We find that initial silencing of the somatic program proceeds indistinguishably with or without Oct4. Oct6 mitigates the mesenchymal-to-epithelial transition and derails reprogramming. These effects are a consequence of differences in genome-wide binding, as the early binding profile of Oct4 defSox2 resembles Oct4, whilst Oct6 does not bind pluripotency enhancers. Nevertheless, in the Oct6-SK condition many otherwise Oct4-bound locations become accessible but chromatin opening is compromised when Oct4 defSox2 occupies these sites. We find that Sox2 predominantly facilitates chromatin opening, whilst Oct4 serves an accessory role. Formation of Oct4/Sox2 heterodimers is essential for pluripotency establishment; however, reliance on Oct4/Sox2 heterodimers declines during pluripotency maintenance.

Overview

The claims and statistics of this paper haven’t been checked yet.

Run the check — free, no account needed. It reads the open-access text and checks the sources it cites.

A few free checks a day · papers already verified open instantly · results are public

Integrity signals

Registry

Crossref · 10.1038/s41467-019-11054-7

Cites

10 of 10 references verified0 citation errors · 0 not checkable

Statistics

Figures

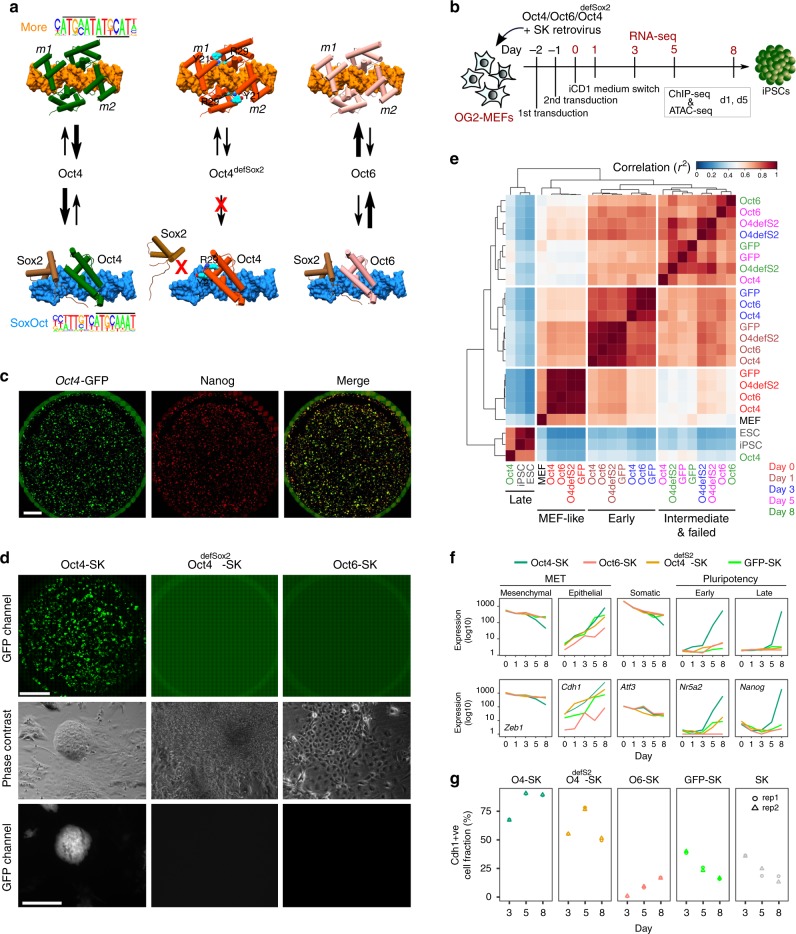
Fig. 1 Reprogramming trajectories of cocktails containing Oct4, Oct6, Oct4defSox2, or GFP in chemically defined medium. a The cartoons represent the preferences of the POU proteins for the DNA-dependent homodimerization on MORE versus heterodimerization with Sox2 on SoxOct elements determined using quantitative biochemical assays14. MORE DNA is shown in orange and SoxOct DNA in blue; m1 is monomer 1 and m2 is monomer2. The thickness of the arrows illustrates the DNA binding preferences. b Experimental design of reprogramming and RNA-seq, ATAC-seq, and ChIP-seq experiments. c Whole-well scans from a 6-well plate using GFP channel (Oct4-GFP), Nanog immunofluorescence and merged panels; for OG2-MEF cells reprogrammed with Oct4-SK at day 8; scale 5 mm. d Whole-well scans (upper panel) of wells from 12-well plate using GFP channel for three POU factors (Oct4, Oct4defSox2, and Oct6); scale 5 mm. Representative phase contrast (middle panel) and corresponding Oct4-GFP fluorescence (lower panel) images of reprogramming experiments; time-point: day 8 post transduction; scale 200 μm. e Hierarchically clustered heatmap based on r2 correlation coefficients using RNA-seq reads as input. iPSCs and ESCs expression data are from GSE9302942. f Mean gene expression trajectories for indicated categories (upper panel) or a representative gene from each category (lower panel) in four reprogramming conditions. See Supplementary Fig. 1E for a larger panel of genes for each category. g Fraction of E-cadherin positive (Cdh1 + ve) cells at different stages of reprogramming in indicated cocktails. FACS was performed in technical duplicates (n = 2). Source data for FACS experiment are provided as a Source Data file
Fig. 1 Reprogramming trajectories of cocktails containing Oct4, Oct6, Oct4defSox2, or GFP in chemically defined medium. a The cartoons represent the preferences of the POU proteins for the DNA-dependent homodimerization on MORE versus heterodimerization with Sox2 on SoxOct elements determined using quantitative biochemical assays14. MORE DNA is shown in orange and SoxOct DNA in blue; m1 is monomer 1 and m2 is monomer2. The thickness of the arrows illustrates the DNA binding preferences. b Experimental design of reprogramming and RNA-seq, ATAC-seq, and ChIP-seq experiments. c Whole-well scans from a 6-well plate using GFP channel (Oct4-GFP), Nanog immunofluorescence and merged panels; for OG2-MEF cells reprogrammed with Oct4-SK at day 8; scale 5 mm. d Whole-well scans (upper panel) of wells from 12-well plate using GFP channel for three POU factors (Oct4, Oct4defSox2, and Oct6); scale 5 mm. Representative phase contrast (middle panel) and corresponding Oct4-GFP fluorescence (lower panel) images of reprogramming experiments; time-point: day 8 post transduction; scale 200 μm. e Hierarchically clustered heatmap based on r2 correlation coefficients using RNA-seq reads as input. iPSCs and ESCs expression data are from GSE9302942. f Mean gene expression trajectories for indicated categories (upper panel) or a representative gene from each category (lower panel) in four reprogramming conditions. See Supplementary Fig. 1E for a larger panel of genes for each category. g Fraction of E-cadherin positive (Cdh1 + ve) cells at different stages of reprogramming in indicated cocktails. FACS was performed in technical duplicates (n = 2). Source data for FACS experiment are provided as a Source Data fileCC BY · PubMed Central
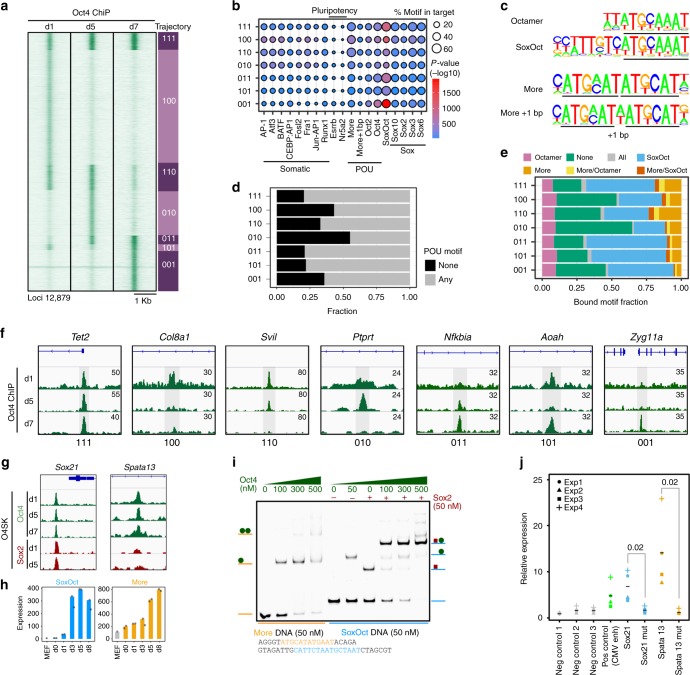
Fig. 2 Determinants for the binding trajectories of Oct4. a Heatmap of Oct4 ChIP-seq signal within 2 kb window centered at Oct4 summits. Rows are Oct4 peaks arranged in 7 binary trajectories. 1 indicates presence and 0 absence of binding; left to right digits are days 1, 5 and 7. Summits were merged if within 100 bp. Genomic locations are provided in Supplementary Data 2. b Enrichment of selected TF motifs in Oct4 occupancy trajectories. Point size represents the proportion of sequences with the motif and color gradient (blue to red) the p-value score. c Consensus binding motifs of Oct4 represented as PWMs (position weight matrices). POU binding sites are underlined. d Proportion of ChIP-seq peaks in each occupancy trajectory featuring ‘any’ (consensus motifs shown in c) or ‘none’ of these POU motifs. e Fraction of binding locations for each occupancy trajectory containing the indicated POU motifs. ‘All’ refers to peaks where motif scanning concurrently detected all the POU motifs listed in (c) and ‘none’ the absence of any of these motifs. f Genome browser track of Oct4 ChIP-seq peaks (shaded gray) for selected trajectories. Genomic coordinates for the summits are listed in Supplementary Table 4. g Genome browser tracks of constitutively bound Oct4 and Sox2 ChIP-seq peaks containing either SoxOct (near Sox21 gene) or MORE (near Spata13 gene) motifs. h Gene expression (mean tag counts as bar and individual technical replicate as dots) of Sox21 and Spata13 in the Oct4 condition. i EMSAs using Oct4-POU and Sox2-HMG protein constructs and DNA probes containing SoxOct elements (near the Sox21 gene) or MORE elements (near the Spata13 gene). EMSA probes are provided in Supplementary Table 5. j STARR reporter assay38 in ESCs with Oct4 bound regions from (g) near Sox21 or Spata13. The positive and negative control sequences are shown in Supplementary Table 8. Each data point (n = 4, biological replicates) is shown with mean as black bar; indicated p-values were calculated by Student’s t-test. Source data for i and j are provided as a Source Data file
Fig. 2 Determinants for the binding trajectories of Oct4. a Heatmap of Oct4 ChIP-seq signal within 2 kb window centered at Oct4 summits. Rows are Oct4 peaks arranged in 7 binary trajectories. 1 indicates presence and 0 absence of binding; left to right digits are days 1, 5 and 7. Summits were merged if within 100 bp. Genomic locations are provided in Supplementary Data 2. b Enrichment of selected TF motifs in Oct4 occupancy trajectories. Point size represents the proportion of sequences with the motif and color gradient (blue to red) the p-value score. c Consensus binding motifs of Oct4 represented as PWMs (position weight matrices). POU binding sites are underlined. d Proportion of ChIP-seq peaks in each occupancy trajectory featuring ‘any’ (consensus motifs shown in c) or ‘none’ of these POU motifs. e Fraction of binding locations for each occupancy trajectory containing the indicated POU motifs. ‘All’ refers to peaks where motif scanning concurrently detected all the POU motifs listed in (c) and ‘none’ the absence of any of these motifs. f Genome browser track of Oct4 ChIP-seq peaks (shaded gray) for selected trajectories. Genomic coordinates for the summits are listed in Supplementary Table 4. g Genome browser tracks of constitutively bound Oct4 and Sox2 ChIP-seq peaks containing either SoxOct (near Sox21 gene) or MORE (near Spata13 gene) motifs. h Gene expression (mean tag counts as bar and individual technical replicate as dots) of Sox21 and Spata13 in the Oct4 condition. i EMSAs using Oct4-POU and Sox2-HMG protein constructs and DNA probes containing SoxOct elements (near the Sox21 gene) or MORE elements (near the Spata13 gene). EMSA probes are provided in Supplementary Table 5. j STARR reporter assay38 in ESCs with Oct4 bound regions from (g) near Sox21 or Spata13. The positive and negative control sequences are shown in Supplementary Table 8. Each data point (n = 4, biological replicates) is shown with mean as black bar; indicated p-values were calculated by Student’s t-test. Source data for i and j are provided as a Source Data fileCC BY · PubMed Central
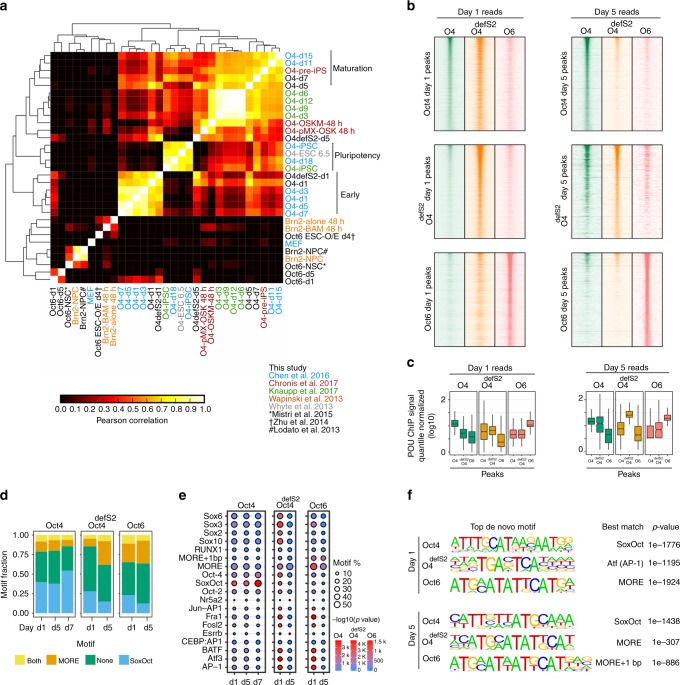
Fig. 3 POU TFs exhibit distinctive binding profiles and motif preferences. a Hierarchical clustering of the pairwise correlation coefficients (R2) of ChIP-seq signals from Oct4, Oct4defSox2 and Oct6 ChIP-seq peaks with publically available ChIP-seq datasets for Oct4, Oct6 and Brn24–6,18,20,22,39,69. b ChIP-seq signal heatmaps for Oct4 (green), Oct4defSox2 (orange), and Oct6 (salmon) at days 1 (left panels) and 5 (right panels) centered on ChIP-seq peaks for Oct4 (top panels), Oct4defSox2 (middle panels) and Oct6 (bottom panels). c Boxplots of quantile normalized ChIP-seq signals at Oct4, Oct4defSox2 and Oct6 peaks at days 1 and 5 from heatmaps in (b). For the boxplots, the midline indicates the median, boxes indicate the upper and lower quartiles and the whiskers indicate 1.5 times interquartile range. d Fraction of binding locations containing MORE (including MORE variant with 1 bp spacer) or SoxOct elements at different reprogramming stages. ‘Both’ refers to peaks where motif scanning detected MORE and SoxOct motifs concurrently and ‘none’ the absence of either of the two motifs. e Enrichment of selected TF motifs in ChIP-seq peaks at days 1 and 5 for Oct4, Oct4defSox2, and Oct6. Size represents fractional occurrences and color gradient the p-value scores. f Top de novo motifs for Oct4, Oct4defSox2 and Oct6 at days 1 and 5. In the HOMER database the MORE motif is designated as Pit1 and MORE + 1 bp as Pit1 + 1bp70
Fig. 3 POU TFs exhibit distinctive binding profiles and motif preferences. a Hierarchical clustering of the pairwise correlation coefficients (R2) of ChIP-seq signals from Oct4, Oct4defSox2 and Oct6 ChIP-seq peaks with publically available ChIP-seq datasets for Oct4, Oct6 and Brn24–6,18,20,22,39,69. b ChIP-seq signal heatmaps for Oct4 (green), Oct4defSox2 (orange), and Oct6 (salmon) at days 1 (left panels) and 5 (right panels) centered on ChIP-seq peaks for Oct4 (top panels), Oct4defSox2 (middle panels) and Oct6 (bottom panels). c Boxplots of quantile normalized ChIP-seq signals at Oct4, Oct4defSox2 and Oct6 peaks at days 1 and 5 from heatmaps in (b). For the boxplots, the midline indicates the median, boxes indicate the upper and lower quartiles and the whiskers indicate 1.5 times interquartile range. d Fraction of binding locations containing MORE (including MORE variant with 1 bp spacer) or SoxOct elements at different reprogramming stages. ‘Both’ refers to peaks where motif scanning detected MORE and SoxOct motifs concurrently and ‘none’ the absence of either of the two motifs. e Enrichment of selected TF motifs in ChIP-seq peaks at days 1 and 5 for Oct4, Oct4defSox2, and Oct6. Size represents fractional occurrences and color gradient the p-value scores. f Top de novo motifs for Oct4, Oct4defSox2 and Oct6 at days 1 and 5. In the HOMER database the MORE motif is designated as Pit1 and MORE + 1 bp as Pit1 + 1bp70CC BY · PubMed Central
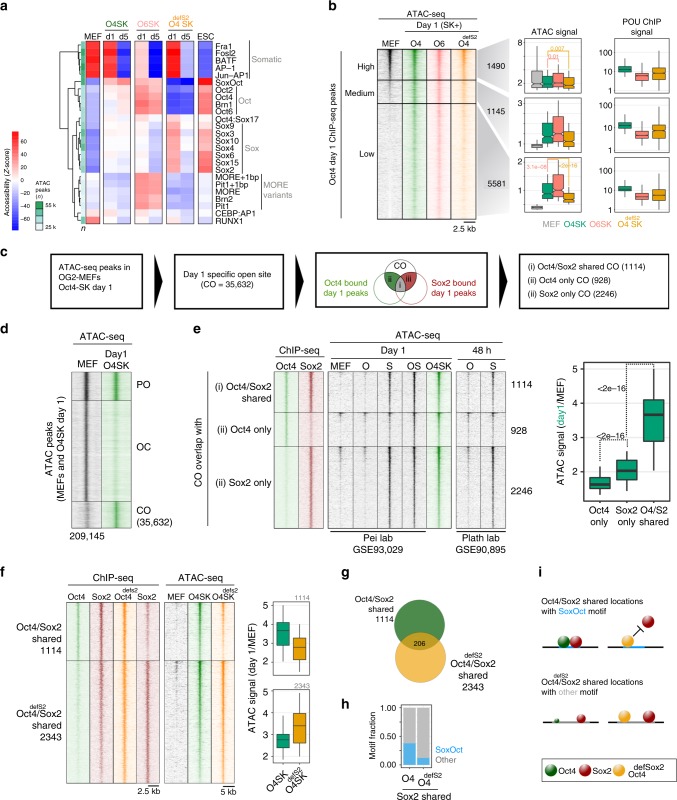
Fig. 4 Sox2 facilitates chromatin opening and Oct4 augments it. a Accessibility variation of ATAC-seq peaks categorized by the presence of selected motifs was determined by chromVAR. Data are scaled row-wise. The color gradient denotes high (red) and low (blue) accessibility. n = number of ATAC-seq peaks containing indicated motifs. b Oct4 ChIP-seq peaks at day 1 were ranked by ATAC-seq read coverage in MEFs and grouped into sites with high (read counts > 30, n = 1490), medium (read counts = 15 to 30, n = 1145) and low-accessibility in MEFs (read counts < 15, n = 5581). Box plots show ATAC-seq and POU ChIP-seq signals at peaks from three corresponding groups. c Analysis flow chart to interrogate the role of Oct4 and Sox2 in facilitating chromatin opening. d ATAC-seq signal heatmaps grouped by three chromatin trajectories: PO (permanently open), OC (open to close), CO (close to open) defined using ATAC-seq peaks from MEFs (GSE9302942) and the Oct4-SK day 1 condition. Numbers indicate peak numbers. e The CO category was further grouped by the presence of Sox2 and Oct4 ChIP-seq peaks from day 1Oct4-SK condition. ChIP-seq and ATAC-seq signal heatmaps were generated using data from this study and indicated sources. Boxplots represent the day1 by MEF ATAC-seq signal ratio. f Heatmaps showing the ChIP-seq (left) and ATAC-seq (right) signals at ChIP-seq peaks defined by co-binding of Oct4/Sox2 or Oct4defSox2/Sox2. Boxplots are day 1/MEF ATAC-signal ratios over the two peak sets. g Overlap of Oct4/Sox2 and Oct4defSox2/Sox2 ChIP-seq peaks. h Fraction of Oct4/Sox2 and Oct4defSox2/Sox2 peaks with matches to the canonical SoxOct motif. i Oct4defSox2 prevents Sox2 from targeting sites with canonical SoxOct elements whilst co-binding of Oct4defSox2/Sox2 at alternative locations is permitted. The size of spheres schematically represent binding preferences. p-values in b and e were calculated using the unpaired Wilcoxon rank sum test (R function pairwise.wilcox.test) adjusted for multiple testing using the Holm method. ATAC-seq boxplots show signals normalized using EAseq (DNA fragments per kilobase pairs (kbp) per million (m) reads) and POU ChIP-seq read coverage boxplots were quantile normalized. Genomic locations for b, d, e, and f are provided in Supplementary Data 2. For the boxplots, the midline indicates the median, boxes indicate the upper and lower quartiles and the whiskers indicate 1.5 times interquartile range
Fig. 4 Sox2 facilitates chromatin opening and Oct4 augments it. a Accessibility variation of ATAC-seq peaks categorized by the presence of selected motifs was determined by chromVAR. Data are scaled row-wise. The color gradient denotes high (red) and low (blue) accessibility. n = number of ATAC-seq peaks containing indicated motifs. b Oct4 ChIP-seq peaks at day 1 were ranked by ATAC-seq read coverage in MEFs and grouped into sites with high (read counts > 30, n = 1490), medium (read counts = 15 to 30, n = 1145) and low-accessibility in MEFs (read counts < 15, n = 5581). Box plots show ATAC-seq and POU ChIP-seq signals at peaks from three corresponding groups. c Analysis flow chart to interrogate the role of Oct4 and Sox2 in facilitating chromatin opening. d ATAC-seq signal heatmaps grouped by three chromatin trajectories: PO (permanently open), OC (open to close), CO (close to open) defined using ATAC-seq peaks from MEFs (GSE9302942) and the Oct4-SK day 1 condition. Numbers indicate peak numbers. e The CO category was further grouped by the presence of Sox2 and Oct4 ChIP-seq peaks from day 1Oct4-SK condition. ChIP-seq and ATAC-seq signal heatmaps were generated using data from this study and indicated sources. Boxplots represent the day1 by MEF ATAC-seq signal ratio. f Heatmaps showing the ChIP-seq (left) and ATAC-seq (right) signals at ChIP-seq peaks defined by co-binding of Oct4/Sox2 or Oct4defSox2/Sox2. Boxplots are day 1/MEF ATAC-signal ratios over the two peak sets. g Overlap of Oct4/Sox2 and Oct4defSox2/Sox2 ChIP-seq peaks. h Fraction of Oct4/Sox2 and Oct4defSox2/Sox2 peaks with matches to the canonical SoxOct motif. i Oct4defSox2 prevents Sox2 from targeting sites with canonical SoxOct elements whilst co-binding of Oct4defSox2/Sox2 at alternative locations is permitted. The size of spheres schematically represent binding preferences. p-values in b and e were calculated using the unpaired Wilcoxon rank sum test (R function pairwise.wilcox.test) adjusted for multiple testing using the Holm method. ATAC-seq boxplots show signals normalized using EAseq (DNA fragments per kilobase pairs (kbp) per million (m) reads) and POU ChIP-seq read coverage boxplots were quantile normalized. Genomic locations for b, d, e, and f are provided in Supplementary Data 2. For the boxplots, the midline indicates the median, boxes indicate the upper and lower quartiles and the whiskers indicate 1.5 times interquartile rangeCC BY · PubMed Central
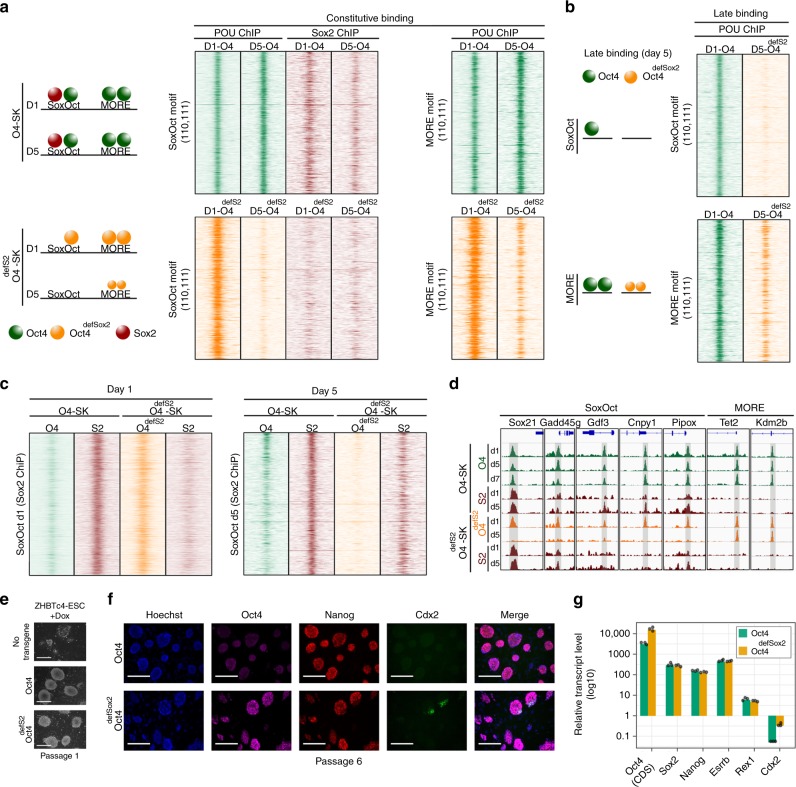
Fig. 5 Oct4defSox2 targets pluripotency enhancers but eventually derails. a Heat maps of ChIP-seq reads at days 1 and 5 for Oct4, Oct4defSox2 and Sox2 in Oct4-SK (top panels) or Oct4defSox2-SK (bottom panels) cocktails centered at Oct4 constitutively bound occupancy trajectories (‘110’ and ‘111’) containing SoxOct motifs (left panels) or MORE motifs (right panel). A cartoon on the left summarizes the results. b ChIP-seq reads at day 5 for Oct4 and Oct4defSox2 for Oct4 late bound occupancy trajectories ‘010’ and ‘011’ at SoxOct (top) or MORE (bottom) locations. c Heatmap of Oct4, Oct4defSox2 and Sox2 ChIP-seq signals at days 1 and 5. Rows are Sox2 ChIP-seq peaks called in the Oct4-SK condition containing SoxOct motifs at day 1 (left panel) and day 5 (right panel). ChIP-seq signal heatmaps in a, b and c are normalized using EAseq (DNA fragments per kilobase pairs (kbp) per million (M) reads) and shown for 2 kb genomic intervals centered on midpoints or motifs. d Genome browser tracks of selected Oct4, Oct4defSox2 and corresponding Sox2 ChIP-seq peaks are shown at different days of reprogramming. The nearest genes and motif under the peaks are mentioned on the top. Genomic coordinates for the summits are listed in Supplementary Table 4. e Phase-contrast images of conditional Oct4-knockout ZHBTc443 ESCs rescued with wild-type Oct4 or Oct4defSox2 after culturing for 6 days in the presence of Dox (passage 1). Scale = 100 μm. f Fluorescence images of ZHBTc4 ESCs rescued with wild-type Oct4 or Oct4defSox2 after 6 passages in the presence of Dox. Scale = 100 μm. The antibodies list is in Supplementary Table 11. g qRT-PCR analysis of selected gene expression of ZHBTc4 ESCs rescued with wild-type Oct4 or Oct4defSox2 after 6 passages in the presence of Dox. The expression is relative to untransduced control induced with Dox for 7 days. Rpl37a was used as a house keeping gene. Individual data points are shown as black jitter plots (n = 3, technical replicates). The primers for Oct4 CDS (coding DNA sequence) and other markers are mentioned in Supplementary Table 10 and Source data are provided as a Source Data file
Fig. 5 Oct4defSox2 targets pluripotency enhancers but eventually derails. a Heat maps of ChIP-seq reads at days 1 and 5 for Oct4, Oct4defSox2 and Sox2 in Oct4-SK (top panels) or Oct4defSox2-SK (bottom panels) cocktails centered at Oct4 constitutively bound occupancy trajectories (‘110’ and ‘111’) containing SoxOct motifs (left panels) or MORE motifs (right panel). A cartoon on the left summarizes the results. b ChIP-seq reads at day 5 for Oct4 and Oct4defSox2 for Oct4 late bound occupancy trajectories ‘010’ and ‘011’ at SoxOct (top) or MORE (bottom) locations. c Heatmap of Oct4, Oct4defSox2 and Sox2 ChIP-seq signals at days 1 and 5. Rows are Sox2 ChIP-seq peaks called in the Oct4-SK condition containing SoxOct motifs at day 1 (left panel) and day 5 (right panel). ChIP-seq signal heatmaps in a, b and c are normalized using EAseq (DNA fragments per kilobase pairs (kbp) per million (M) reads) and shown for 2 kb genomic intervals centered on midpoints or motifs. d Genome browser tracks of selected Oct4, Oct4defSox2 and corresponding Sox2 ChIP-seq peaks are shown at different days of reprogramming. The nearest genes and motif under the peaks are mentioned on the top. Genomic coordinates for the summits are listed in Supplementary Table 4. e Phase-contrast images of conditional Oct4-knockout ZHBTc443 ESCs rescued with wild-type Oct4 or Oct4defSox2 after culturing for 6 days in the presence of Dox (passage 1). Scale = 100 μm. f Fluorescence images of ZHBTc4 ESCs rescued with wild-type Oct4 or Oct4defSox2 after 6 passages in the presence of Dox. Scale = 100 μm. The antibodies list is in Supplementary Table 11. g qRT-PCR analysis of selected gene expression of ZHBTc4 ESCs rescued with wild-type Oct4 or Oct4defSox2 after 6 passages in the presence of Dox. The expression is relative to untransduced control induced with Dox for 7 days. Rpl37a was used as a house keeping gene. Individual data points are shown as black jitter plots (n = 3, technical replicates). The primers for Oct4 CDS (coding DNA sequence) and other markers are mentioned in Supplementary Table 10 and Source data are provided as a Source Data fileCC BY · PubMed Central
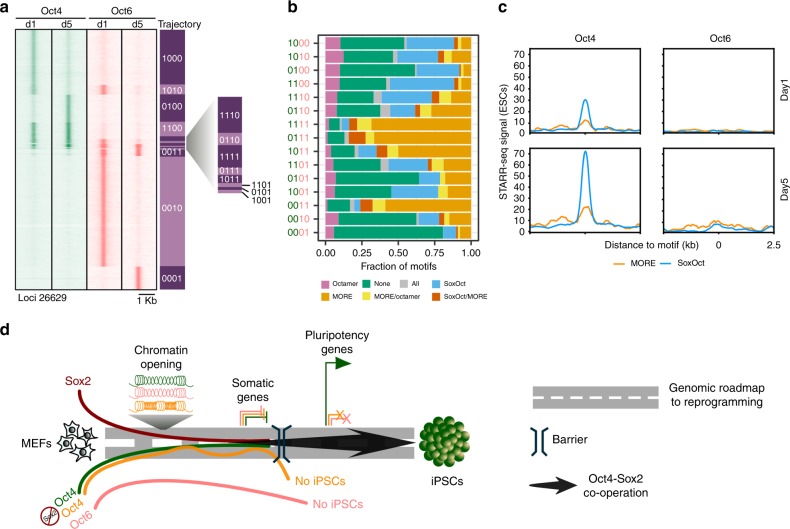
Fig. 6 Oct6 binds to alternative targets and avoids pluripotency enhancers. a Comparison of Oct4 (green color) and Oct6 (salmon color) ChIP-seq signals at days 1 and 5 of reprogramming. Rows are 15 occupancy trajectories defined by the presence or absence of Oct4 or Oct6 peaks at day 1 or 5 (1 = binding, 0 = absence of binding). The summits were merged if they were within 100 bp. Genomic locations are provided in Supplementary Data 2. b Fraction of POU motifs mapping to binding sites in each of the occupancy trajectories. c Read pileup plots of STARR-seq signal (enhancer activity) in ESCs at Oct4 (left) and Oct6 (right) binding sites at days 1 (up) and 5 (bottom) of reprogramming containing either SoxOct or MORE motifs. d Model for unique and dispensable roles of Oct4 at different stages of somatic cell reprogramming
Fig. 6 Oct6 binds to alternative targets and avoids pluripotency enhancers. a Comparison of Oct4 (green color) and Oct6 (salmon color) ChIP-seq signals at days 1 and 5 of reprogramming. Rows are 15 occupancy trajectories defined by the presence or absence of Oct4 or Oct6 peaks at day 1 or 5 (1 = binding, 0 = absence of binding). The summits were merged if they were within 100 bp. Genomic locations are provided in Supplementary Data 2. b Fraction of POU motifs mapping to binding sites in each of the occupancy trajectories. c Read pileup plots of STARR-seq signal (enhancer activity) in ESCs at Oct4 (left) and Oct6 (right) binding sites at days 1 (up) and 5 (bottom) of reprogramming containing either SoxOct or MORE motifs. d Model for unique and dispensable roles of Oct4 at different stages of somatic cell reprogrammingCC BY · PubMed Central

Verification

Claims the paper makes

The claims and statistics of this paper haven’t been checked yet.

Run the check — free, no account needed. It reads the open-access text and checks the sources it cites.

A few free checks a day · papers already verified open instantly · results are public

Claims other papers make about this one

Each is checked against this paper’s own text: does it say what the citing paper says it does?

Self-check

Percentages, sums and reported differences re-computed from the paper’s own numbers.

The self-check needs the paper’s full text.

Citations

Cites

Show all 10 references

Research works printed but not linked: 60

  1. Ieda, M. et al. Direct reprogramming of fibroblasts into functional cardiomyocytes by defined factors. Cell 142, 375–386 (2010). · DOI · Paper page
  2. Takahashi, K. & Yamanaka, S. Induction of pluripotent stem cells from mouse embryonic and adult fibroblast cultures by defined factors. Cell 126, 663–676 (2006). · DOI · Paper page
  3. Chen, J. et al. Hierarchical Oct4 binding in concert with primed epigenetic rearrangements during somatic cell reprogramming. Cell Rep. 14, 1540–1554 (2016). · DOI · Paper page
  4. Knaupp, A. S. et al. Transient and permanent reconfiguration of chromatin and transcription factor occupancy drive reprogramming. Cell Stem Cell 21, 834–845 e836 (2017). · DOI · Paper page
  5. Soufi, A., Donahue, G. & Zaret, K. S. Facilitators and impediments of the pluripotency reprogramming factors’ initial engagement with the genome. Cell 151, 994–1004 (2012). · DOI · Paper page
  6. Zviran, A. et al. Deterministic somatic cell reprogramming involves continuous transcriptional changes governed by Myc and epigenetic-driven modules. Cell Stem Cell 24, 328–341 e329 (2019). · DOI
  7. Hou, L., Srivastava, Y. & Jauch, R. Molecular basis for the genome engagement by Sox proteins. Semin. Cell Dev. Biol. https://doi.org/10.1016/j.semcdb.2016.08.005 (2016). · DOI
  8. Aksoy, I. et al. Sox transcription factors require selective interactions with Oct4 and specific transactivation functions to mediate reprogramming. Stem Cells 31, 2632–2646 (2013). · DOI
  9. Nakagawa, M. et al. Generation of induced pluripotent stem cells without Myc from mouse and human fibroblasts. Nat. Biotechnol. 26, 101–106 (2008). · DOI · Paper page
  10. Esch, D. et al. A unique Oct4 interface is crucial for reprogramming to pluripotency. Nat. Cell Biol. 15, 295–301 (2013). · DOI
  11. Jerabek, S. et al. Changing POU dimerization preferences converts Oct6 into a pluripotency inducer. EMBO Rep. 18, 319–333 (2017). · DOI · Paper page
  12. Velychko, S. et al. Fusion of reprogramming factors alters the trajectory of somatic lineage conversion. Cell Rep. 27, 30–39 e34 (2019). · DOI
  13. Nishimoto, M. et al. Oct-3/4 maintains the proliferative embryonic stem cell state via specific binding to a variant octamer sequence in the regulatory region of the UTF1 locus. Mol. Cell. Biol. 25, 5084–5094 (2005). · DOI
  14. Han, D. W. et al. Direct reprogramming of fibroblasts into neural stem cells by defined factors. Cell Stem Cell 10, 465–472 (2012). · DOI
  15. Zhu, Q. et al. The transcription factor Pou3f1 promotes neural fate commitment via activation of neural lineage genes and inhibition of external signaling pathways. eLife 3, https://doi.org/10.7554/eLife.02224 (2014). · DOI
  16. Tsunemoto, R. et al. Diverse reprogramming codes for neuronal identity. Nature 557, 375–380 (2018). · DOI
  17. Wapinski, O. L. et al. Hierarchical mechanisms for direct reprogramming of fibroblasts to neurons. Cell 155, 621–635 (2013). · DOI · Paper page
  18. Mistri, T. K. et al. Selective influence of Sox2 on POU transcription factor binding in embryonic and neural stem cells. EMBO Rep. 16, 1177–1191 (2015). · DOI
  19. Jauch, R., Choo, S. H., Ng, C. K. & Kolatkar, P. R. Crystal structure of the dimeric Oct6 (POU3f1) POU domain bound to palindromic MORE DNA. Proteins 79, 674–677 (2011). · DOI
  20. Remenyi, A. et al. Crystal structure of a POU/HMG/DNA ternary complex suggests differential assembly of Oct4 and Sox2 on two enhancers. Genes Dev. 17, 2048–2059 (2003). · DOI
  21. Jauch, R. et al. Conversion of Sox17 into a pluripotency reprogramming factor by reengineering its association with Oct4 on DNA. Stem Cells 29, 940–951 (2011). · DOI
  22. Ng, C. K. et al. Deciphering the Sox-Oct partner code by quantitative cooperativity measurements. Nucleic Acids Res. 40, 4933–4941 (2012). · DOI
  23. Merino, F. et al. Structural basis for the SOX-dependent genomic redistribution of OCT4 in stem cell differentiation. Structure 22, 1274–1286 (2014). · DOI
  24. Tapia, N. et al. Dissecting the role of distinct OCT4-SOX2 heterodimer configurations in pluripotency. Sci. Rep. 5, 13533 (2015). · DOI
  25. Veerapandian, V. et al. Directed evolution of reprogramming factors by cell selection and sequencing. Stem Cell Rep. https://doi.org/10.1016/j.stemcr.2018.07.002 (2018). · DOI
  26. Botquin, V. et al. New POU dimer configuration mediates antagonistic control of an osteopontin preimplantation enhancer by Oct-4 and Sox-2. Genes Dev. 12, 2073–2090 (1998). · DOI
  27. Jacobson, E. M., Li, P., Leon-del-Rio, A., Rosenfeld, M. G. & Aggarwal, A. K. Structure of Pit-1 POU domain bound to DNA as a dimer: unexpected arrangement and flexibility. Genes Dev. 11, 198–212 (1997). · DOI
  28. Tomilin, A. et al. Synergism with the coactivator OBF-1 (OCA-B, BOB-1) is mediated by a specific POU dimer configuration. Cell 103, 853–864 (2000). · DOI
  29. Chen, J. et al. Rational optimization of reprogramming culture conditions for the generation of induced pluripotent stem cells with ultra-high efficiency and fast kinetics. Cell Res. 21, 884–894 (2011). · DOI
  30. Szabo, P. E., Hubner, K., Scholer, H. & Mann, J. R. Allele-specific expression of imprinted genes in mouse migratory primordial germ cells. Mech. Dev. 115, 157–160 (2002). · DOI
  31. Guo, L. et al. Resolving cell fate decisions during somatic cell reprogramming by single-cell RNA-Seq. Mol. Cell 73, 815–829 e817 (2019). · DOI
  32. Li, R. et al. A mesenchymal-to-epithelial transition initiates and is required for the nuclear reprogramming of mouse fibroblasts. Cell Stem Cell 7, 51–63 (2010). · DOI · Paper page
  33. Samavarchi-Tehrani, P. et al. Functional genomics reveals a BMP-driven mesenchymal-to-epithelial transition in the initiation of somatic cell reprogramming. Cell Stem Cell 7, 64–77 (2010). · DOI · Paper page
  34. Lodato, M. A. et al. SOX2 co-occupies distal enhancer elements with distinct POU factors in ESCs and NPCs to specify cell state. PLoS Genet. 9, e1003288 (2013). · DOI
  35. Buenrostro, J. D., Giresi, P. G., Zaba, L. C., Chang, H. Y. & Greenleaf, W. J. Transposition of native chromatin for fast and sensitive epigenomic profiling of open chromatin, DNA-binding proteins and nucleosome position. Nat. Methods 10, 1213–1218 (2013). · DOI · Paper page
  36. Li, D. et al. Chromatin accessibility dynamics during iPSC reprogramming. Cell Stem Cell 21, 819–833 e816 (2017). · DOI · Paper page
  37. Niwa, H., Miyazaki, J. & Smith, A. G. Quantitative expression of Oct-3/4 defines differentiation, dedifferentiation or self-renewal of ES cells. Nat. Genet. 24, 372–376 (2000). · DOI
  38. Masui, S. et al. Pluripotency governed by Sox2 via regulation of Oct3/4 expression in mouse embryonic stem cells. Nat. Cell Biol. 9, 625–635 (2007). · DOI
  39. Giresi, P. G., Kim, J., McDaniell, R. M., Iyer, V. R. & Lieb, J. D. FAIRE (Formaldehyde-Assisted Isolation of Regulatory Elements) isolates active regulatory elements from human chromatin. Genome Res. 17, 877–885 (2007). · DOI
  40. Liu, X. et al. Sequential introduction of reprogramming factors reveals a time-sensitive requirement for individual factors and a sequential EMT-MET mechanism for optimal reprogramming. Nat. Cell Biol. 15, 829–838 (2013). · DOI · Paper page
  41. Jauch, R. Cell fate reprogramming through engineering of native transcription factors. Curr. Opin. Genet. Dev. 52, 109–116 (2018). · DOI
  42. Esteban, M. A. et al. Vitamin C enhances the generation of mouse and human induced pluripotent stem cells. Cell Stem Cell 6, 71–79 (2010). · DOI · Paper page
  43. Morita, S., Kojima, T. & Kitamura, T. Plat-E: an efficient and stable system for transient packaging of retroviruses. Gene Ther. 7, 1063–1066 (2000). · DOI
  44. Livak, K. J. & Schmittgen, T. D. Analysis of relative gene expression data using real-time quantitative PCR and the 2(-Delta Delta C(T)) Method. Methods 25, 402–408 (2001). · DOI · Paper page
  45. Buenrostro, J. D., Wu, B., Chang, H. Y. & Greenleaf, W. J. ATAC-seq: a method for assaying chromatin accessibility genome-wide. Curr. Protoc. Mol. Biol. 109, 29 21–29 29 (2015). · DOI · Paper page
  46. Li, B. & Dewey, C. N. RSEM: accurate transcript quantification from RNA-Seq data with or without a reference genome. BMC Bioinforma. 12, 323 (2011). · DOI · Paper page
  47. Langmead, B. & Salzberg, S. L. Fast gapped-read alignment with Bowtie 2. Nat. Methods 9, 357–359 (2012). · DOI · Paper page
  48. Love, M. I., Huber, W. & Anders, S. Moderated estimation of fold change and dispersion for RNA-seq data with DESeq2. Genome Biol. 15, 550 (2014). · DOI · Paper page
  49. Hutchins, A. P., Jauch, R., Dyla, M. & Miranda-Saavedra, D. glbase: a framework for combining, analyzing and displaying heterogeneous genomic and high-throughput sequencing data. Cell Regen. 3, 1 (2014). · DOI
  50. Smith, T., Heger, A. & Sudbery, I. UMI-tools: modeling sequencing errors in Unique Molecular Identifiers to improve quantification accuracy. Genome Res. 27, 491–499 (2017). · DOI
  51. Li, H. et al. The sequence alignment/map format and SAMtools. Bioinformatics 25, 2078–2079 (2009). · DOI · Paper page
  52. Zhang, Y. et al. Model-based analysis of ChIP-Seq (MACS). Genome Biol. 9, R137 (2008). · DOI · Paper page
  53. Ramirez, F. et al. deepTools2: a next generation web server for deep-sequencing data analysis. Nucleic Acids Res. 44, W160–W165 (2016). · DOI · Paper page
  54. Quinlan, A. R. & Hall, I. M. BEDTools: a flexible suite of utilities for comparing genomic features. Bioinformatics 26, 841–842 (2010). · DOI · Paper page
  55. Kent, W. J., Zweig, A. S., Barber, G., Hinrichs, A. S. & Karolchik, D. BigWig and BigBed: enabling browsing of large distributed datasets. Bioinformatics 26, 2204–2207 (2010). · DOI
  56. Heinz, S. et al. Simple combinations of lineage-determining transcription factors prime cis-regulatory elements required for macrophage and B cell identities. Mol. cell 38, 576–589 (2010). · DOI · Paper page
  57. Tripathi, S. et al. Meta- and orthogonal integration of influenza “OMICs” data defines a role for UBR4 in virus budding. Cell Host Microbe 18, 723–735 (2015). · DOI
  58. Lerdrup, M., Johansen, J. V., Agrawal-Singh, S. & Hansen, K. An interactive environment for agile analysis and visualization of ChIP-sequencing data. Nat. Struct. Mol. Biol. 23, 349–357 (2016). · DOI
  59. Whyte, W. A. et al. Master transcription factors and mediator establish super-enhancers at key cell identity genes. Cell 153, 307–319 (2013). · DOI · Paper page
  60. Skowronska-Krawczyk, D. et al. Required enhancer-matrin-3 network interactions for a homeodomain transcription program. Nature 514, 257–261 (2014). · DOI

Cited by

Sorted by citations

Metadata

Authors
Malik, V., Glaser, L. V., Zimmer, D., Velychko, S., Weng, M., Holzner, M., Arend, M., Chen, Y., Srivastava, Y., Veerapandian, V., Shah, Z., Esteban, M. A., Wang, H., Chen, J., Schöler, H. R., Hutchins, A. P., Meijsing, S. H., Pott, S., & Jauch, R.
Venue
Nature Communications
Published
2019-08-02
Volume
10
Issue
1
ISSN
2041-1723
Cited by
72
References
10
Language
en
Funders
  • National Natural Science Foundation of China (31471238, 31771454, 31611130038)
  • Chinese Ministry of Science and Technology | Department of S and T for Social Development (2016YFA0100700)

About these checks

Registry, retraction, Cites and statistics results are computed, not judged, with one exception: a printed reference that no index lists is read once by a model before it counts as a citation error. Claims are extracted by a model and kept only when their quote appears verbatim in the text; each cited source is then checked, with a model’s help, for whether it says what the claim relies on. Those verdicts can be wrong — read the claim’s quote and the cited source before relying on one.

Statistics and arithmetic are recomputed, not judged.

Confidence bands are shown only for fields calibrated on our annotated test set. None is calibrated yet, so no band is shown.

What counts as a claim ›How we measure confidence ›How we check this ›

Are you an author, or do you see a problem with this page? Request a review