Cited by 81

The DOI matches its Crossref record; 12 of the 12 references it cites were found in a registry or an index.

Fibrinogen induces neural stem cell differentiation into astrocytes in the subventricular zone via BMP signaling

Pous, Lauriane, Deshpande, Sachin S., Nath, Suvra, Mezey, Szilvia, Malik, Subash C., Schildge, Sebastian, Bohrer, Christian, Topp, Könül, Pfeifer, Dietmar, Fernández-Klett, Francisco, Doostkam, Soroush, Galanakis, Dennis K., Taylor, Verdon, Akassoglou, Katerina, Schachtrup, Christian·2020·Nature Communications

Abstract

Neural stem/progenitor cells (NSPCs) originating from the subventricular zone (SVZ) contribute to brain repair during CNS disease. The microenvironment within the SVZ stem cell niche controls NSPC fate. However, extracellular factors within the niche that trigger astrogliogenesis over neurogenesis during CNS disease are unclear. Here, we show that blood-derived fibrinogen is enriched in the SVZ niche following distant cortical brain injury in mice. Fibrinogen inhibited neuronal differentiation in SVZ and hippocampal NSPCs while promoting astrogenesis via activation of the BMP receptor signaling pathway. Genetic and pharmacologic depletion of fibrinogen reduced astrocyte formation within the SVZ after cortical injury, reducing the contribution of SVZ-derived reactive astrocytes to lesion scar formation. We propose that fibrinogen is a regulator of NSPC-derived astrogenesis from the SVZ niche via BMP receptor signaling pathway following injury.

Overview

The claims and statistics of this paper haven’t been checked yet.

Run the check — free, no account needed. It reads the open-access text and checks the sources it cites.

A few free checks a day · papers already verified open instantly · results are public

Integrity signals

Registry

Crossref · 10.1038/s41467-020-14466-y

Cites

12 of 12 references verified0 citation errors · 0 not checkable

Statistics

Figures

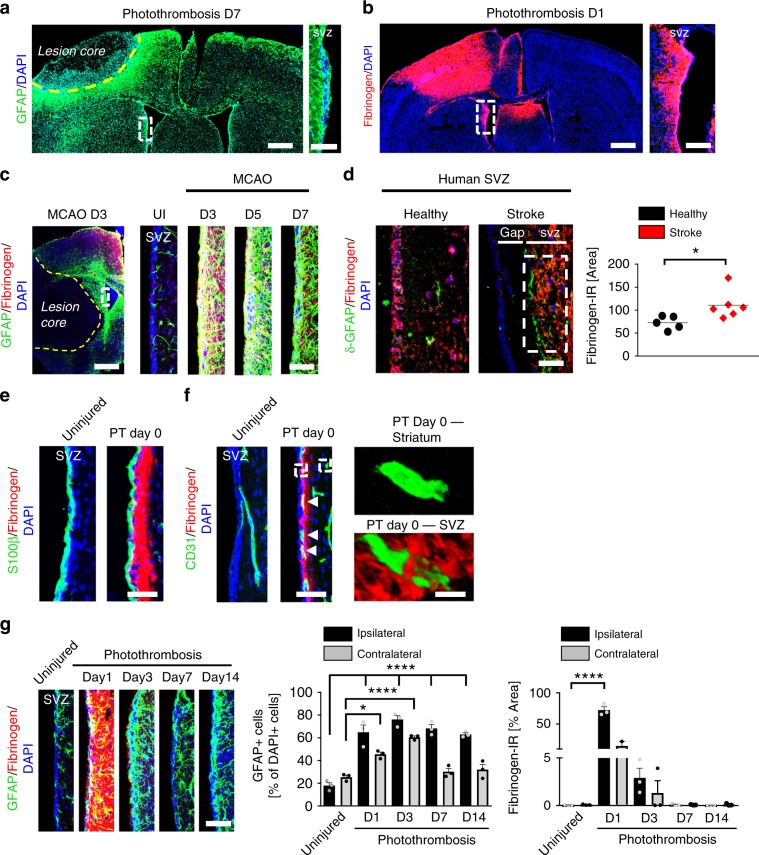
Fig. 1 Fibrinogen deposition in the SVZ after cortical injury. a GFAP immunostaining (green) around the lesion core (indicated by yellow dotted line) and in the SVZ. White box indicating enlargement of SVZ showing GFAP expression in the adult SVZ 7 days after PT (right) (n = 4 mice). Scale bars, 369 μm, left and 57 µm, enlargement. b Fibrinogen immunostaining (red) in the lesion core and in the SVZ 1 day after PT. White box indicating enlargement of SVZ showing fibrinogen deposition in the SVZ 1 day after PT (right) (n = 4 mice). Scale bars, 428 μm, left and 120 µm, enlargement. c GFAP (green) and fibrinogen (red) immunostainings in the lesion core (left) and in the SVZ (right) 3, 5 and 7 days after stroke (MCAO). White box indicating enlargement of SVZ showing increased GFAP expression colocalizing with fibrinogen (red) deposition in the SVZ 3 days after stroke. Scale bars, 543 μm, left and 50 µm, right (n = 3 mice). d δ-GFAP (green) and fibrinogen (red) immunostainings in the SVZ of patients after stroke compared to healthy controls. White box indicating quantification area. Scale bar, 25 μm. Quantification of fibrinogen immunoreactivity in the SVZ per area (n = 5 (healthy control), n = 6 (stroke patients, mean ± s.e.m., unpaired Student’s t-test, *P < 0.05). e Representative images of S100β + ependymal cells (green) lining the lateral ventricle and adjacent fibrinogen (red) in the SVZ 5 h after PT (PT Day 0). Scale bar, 40 μm. f CD31 + endothelial cells (green) and fibrinogen (red) in the SVZ and striatum 5 h after PT (PT Day 0). White boxes indicating enlargement of fibrinogen deposition around blood vessels in SVZ (right, bottom) compared to no fibrinogen deposition around blood vessels in the striatum (right, top) after PT. Scale bars, 40 μm, left and 95 µm, enlargement. g GFAP + astrocytes (green) and fibrinogen (red) in the ipsilateral SVZ at different days after PT and uninjured mice. Scale bar, 57 μm. Quantification of GFAP + cells and fibrinogen immunoreactivity in the SVZ per area (n = 3 mice, mean ± s.e.m., one-way ANOVA and Bonferroni’s multiple comparisons test, *P < 0.05, ****P < 0.0001). SVZ subventricular zone.
Fig. 1 Fibrinogen deposition in the SVZ after cortical injury. a GFAP immunostaining (green) around the lesion core (indicated by yellow dotted line) and in the SVZ. White box indicating enlargement of SVZ showing GFAP expression in the adult SVZ 7 days after PT (right) (n = 4 mice). Scale bars, 369 μm, left and 57 µm, enlargement. b Fibrinogen immunostaining (red) in the lesion core and in the SVZ 1 day after PT. White box indicating enlargement of SVZ showing fibrinogen deposition in the SVZ 1 day after PT (right) (n = 4 mice). Scale bars, 428 μm, left and 120 µm, enlargement. c GFAP (green) and fibrinogen (red) immunostainings in the lesion core (left) and in the SVZ (right) 3, 5 and 7 days after stroke (MCAO). White box indicating enlargement of SVZ showing increased GFAP expression colocalizing with fibrinogen (red) deposition in the SVZ 3 days after stroke. Scale bars, 543 μm, left and 50 µm, right (n = 3 mice). d δ-GFAP (green) and fibrinogen (red) immunostainings in the SVZ of patients after stroke compared to healthy controls. White box indicating quantification area. Scale bar, 25 μm. Quantification of fibrinogen immunoreactivity in the SVZ per area (n = 5 (healthy control), n = 6 (stroke patients, mean ± s.e.m., unpaired Student’s t-test, *P < 0.05). e Representative images of S100β + ependymal cells (green) lining the lateral ventricle and adjacent fibrinogen (red) in the SVZ 5 h after PT (PT Day 0). Scale bar, 40 μm. f CD31 + endothelial cells (green) and fibrinogen (red) in the SVZ and striatum 5 h after PT (PT Day 0). White boxes indicating enlargement of fibrinogen deposition around blood vessels in SVZ (right, bottom) compared to no fibrinogen deposition around blood vessels in the striatum (right, top) after PT. Scale bars, 40 μm, left and 95 µm, enlargement. g GFAP + astrocytes (green) and fibrinogen (red) in the ipsilateral SVZ at different days after PT and uninjured mice. Scale bar, 57 μm. Quantification of GFAP + cells and fibrinogen immunoreactivity in the SVZ per area (n = 3 mice, mean ± s.e.m., one-way ANOVA and Bonferroni’s multiple comparisons test, *P < 0.05, ****P < 0.0001). SVZ subventricular zone.CC BY · PubMed Central
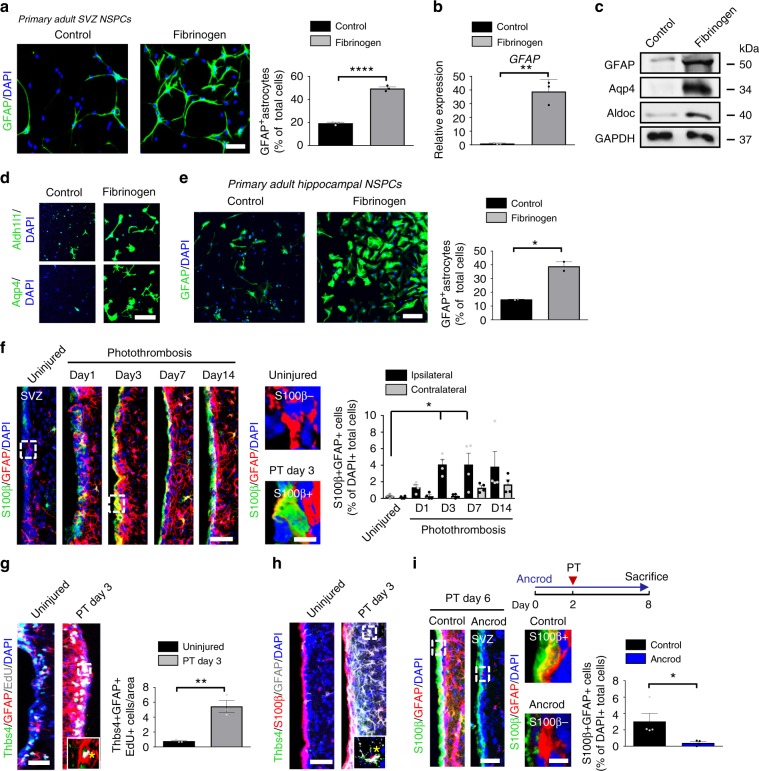
Fig. 2 Fibrinogen-induced differentiation of NSPCs into astrocytes. a GFAP + astrocytes (green) in untreated and fibrinogen‐treated adult SVZ-derived NSPCs. Scale bar, 56 μm. Quantification of GFAP + astrocytes. (n = 3, mean ± s.e.m, unpaired Student’s t-test, ***P < 0.001). b Expression of GFAP mRNA in NSPCs. (n = 3, mean ± s.e.m, unpaired Student’s t-test, **P < 0.01). c Immunoblot for GFAP, Aqp4, Aldoc, and GAPDH in NSPCs 2 days after fibrinogen treatment. d Aldh1l1 + (green, top) and Aqp4 + (green, bottom) astrocytes in fibrinogen‐treated adult SVZ-derived NSPC cultures. (n = 3, representative images are shown). Scale bar, 67 μm. e GFAP + astrocytes (green) in fibrinogen‐treated hippocampus-derived NSPC cultures. Scale bar, 104 μm. Quantification of GFAP + astrocytes. (n = 2, performed in duplicate, mean ± s.e.m, unpaired Student’s t-test, *P < 0.05. f S100β (green) and GFAP (red) immunostainings in the SVZ at different timepoints after PT. White boxes indicate enlargement of S100β-GFAP + (right, top) and S100β + GFAP + (right, bottom) cells in the SVZ of uninjured and injured (PT day 3) mice, respectively. Scale bars, 40 μm, left and 7 µm, enlargement. Quantification of S100β + GFAP + cells per area (n = 4 mice, mean ± s.e.m, one-way ANOVA and Bonferroni’s multiple comparisons test, *P < 0.05). g EdU (grey), Thbs4 (green) and GFAP (red) immunostainings in the SVZ at 3 days after PT. White box indicates the enlargement of an EdU + GFAP + Thbs4 + DAPI + cell (right, bottom) in the SVZ 3 days after PT. Scale bar, 25 µm. Quantification of Thbs4 + GFAP + EdU + cells in the SVZ per area. (n = 4 mice, mean ± s.e.m, unpaired Student’s t-test, **P < 0.01). h immunolabeling for Thbs4 (green), S100β (red) and GFAP (gray) in the SVZ at 3 days after PT. White box indicating enlargement of a Thbs4 + S100β + GFAP + DAPI + cell in the SVZ 3 days after PT (n = 4 mice). Scale bar, 25 µm. i Scheme illustrating PT on ancrod-administered WT mice (top). S100β (red) and GFAP (green) immunostainings of the SVZ of ancrod-treated mice 6 days after PT. White boxes indicate enlargement of a S100β + GFAP + (top) and a S100β-GFAP + (bottom) cell in the SVZ of control and fibrinogen-depleted mice, respectively, 6 days after PT. Scale bars, 36 μm, left and 7 µm, enlargement. Quantification of S100β + GFAP + cells in the SVZ per area. (n = 4 mice, unpaired Student’s t-test, *P < 0.05). SVZ, subventricular zone.
Fig. 2 Fibrinogen-induced differentiation of NSPCs into astrocytes. a GFAP + astrocytes (green) in untreated and fibrinogen‐treated adult SVZ-derived NSPCs. Scale bar, 56 μm. Quantification of GFAP + astrocytes. (n = 3, mean ± s.e.m, unpaired Student’s t-test, ***P < 0.001). b Expression of GFAP mRNA in NSPCs. (n = 3, mean ± s.e.m, unpaired Student’s t-test, **P < 0.01). c Immunoblot for GFAP, Aqp4, Aldoc, and GAPDH in NSPCs 2 days after fibrinogen treatment. d Aldh1l1 + (green, top) and Aqp4 + (green, bottom) astrocytes in fibrinogen‐treated adult SVZ-derived NSPC cultures. (n = 3, representative images are shown). Scale bar, 67 μm. e GFAP + astrocytes (green) in fibrinogen‐treated hippocampus-derived NSPC cultures. Scale bar, 104 μm. Quantification of GFAP + astrocytes. (n = 2, performed in duplicate, mean ± s.e.m, unpaired Student’s t-test, *P < 0.05. f S100β (green) and GFAP (red) immunostainings in the SVZ at different timepoints after PT. White boxes indicate enlargement of S100β-GFAP + (right, top) and S100β + GFAP + (right, bottom) cells in the SVZ of uninjured and injured (PT day 3) mice, respectively. Scale bars, 40 μm, left and 7 µm, enlargement. Quantification of S100β + GFAP + cells per area (n = 4 mice, mean ± s.e.m, one-way ANOVA and Bonferroni’s multiple comparisons test, *P < 0.05). g EdU (grey), Thbs4 (green) and GFAP (red) immunostainings in the SVZ at 3 days after PT. White box indicates the enlargement of an EdU + GFAP + Thbs4 + DAPI + cell (right, bottom) in the SVZ 3 days after PT. Scale bar, 25 µm. Quantification of Thbs4 + GFAP + EdU + cells in the SVZ per area. (n = 4 mice, mean ± s.e.m, unpaired Student’s t-test, **P < 0.01). h immunolabeling for Thbs4 (green), S100β (red) and GFAP (gray) in the SVZ at 3 days after PT. White box indicating enlargement of a Thbs4 + S100β + GFAP + DAPI + cell in the SVZ 3 days after PT (n = 4 mice). Scale bar, 25 µm. i Scheme illustrating PT on ancrod-administered WT mice (top). S100β (red) and GFAP (green) immunostainings of the SVZ of ancrod-treated mice 6 days after PT. White boxes indicate enlargement of a S100β + GFAP + (top) and a S100β-GFAP + (bottom) cell in the SVZ of control and fibrinogen-depleted mice, respectively, 6 days after PT. Scale bars, 36 μm, left and 7 µm, enlargement. Quantification of S100β + GFAP + cells in the SVZ per area. (n = 4 mice, unpaired Student’s t-test, *P < 0.05). SVZ, subventricular zone.CC BY · PubMed Central
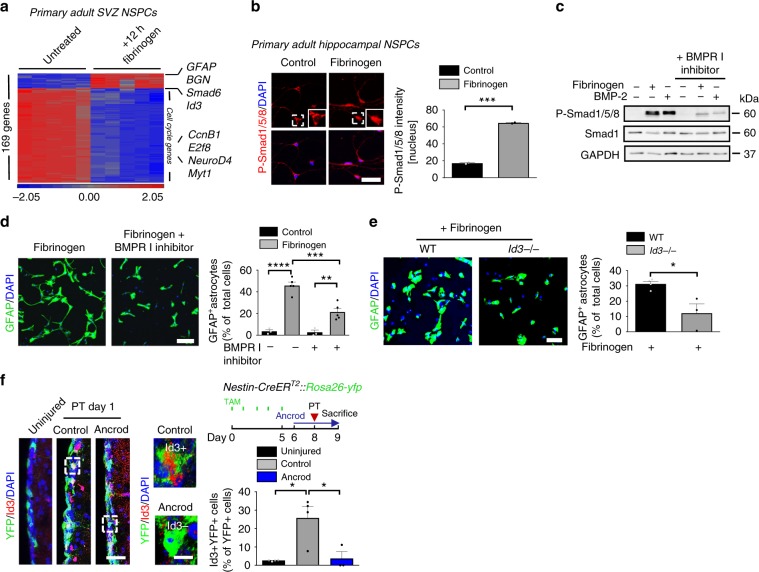
Fig. 3 Fibrinogen induces astrogliogenesis via the BMP–Id3 axis. a Microarray gene expression profile of NSPCs treated for 12 h with fibrinogen compared to control cells. Heatmap analysis showing genes regulated by a factor of at least 4 between fibrinogen-treated and control NSPCs. (n = 3). b Immunolabeling for phosphorylated Smad1/5/8 (P-Smad1/5/8, red) in fibrinogen-treated hippocampal NSPCs. White boxes indicate enlargement of nuclear P-Smad1/5/8- and P-Smad1/5/8 + cell in untreated and fibrinogen-treated conditions, respectively. Scale bar, 46 μm. Quantification of nuclear P-Smad1/5/8. (n = 2, experiments performed in duplicates (mean ± s.e.m., unpaired Student’s t-test, ***P < 0.001). c Immunoblot for P-Smad1/5/8 and Smad1 in NSPCs pretreated with a BMP receptor inhibitor before fibrinogen stimulation. BMP-2 served as positive control. d GFAP + astrocytes in NSPC cultures pretreated with a BMP receptor inhibitor 1 h before fibrinogen treatment 2 days after initiation of differentiation. Scale bar, 125 μm. Quantification of GFAP + astrocytes. (n = 5, (mean ± s.e.m, one-way ANOVA and Bonferroni’s multiple comparisons test, **P < 0.01, ***P < 0.001, ****P < 0.0001). e GFAP + astrocytes (green) in fibrinogen-treated Id3−/− and WT NSPCs cultures after 2 days on poly‐D‐lysine. Scale bar, 72 μm. Quantification of GFAP + astrocytes. (n = 4, WT; n = 3, Id3−/− cells, mean ± s.e.m, unpaired Student’s t-test, *P < 0.05). f Experimental setup for photothrombosis on Nestin-CreERT2::Rosa26-yfp mice. TAM: tamoxifen (right, top). Id3 (red) and YFP (green) immunostainings in the SVZ of uninjured mice and of ancrod-treated mice compared to control WT mice 1 day after PT. The white boxes indicate the enlargement of an Id3 + YFP + (right, top) and an Id3-YFP + (right, bottom) cell in the SVZ of control mice and fibrinogen-depleted mice, respectively, 1 day after PT. Scale bars, 30 μm, left and 8 µm, enlargement. Quantification of Id3 + YFP + cells in the SVZ per area. (n = 4 uninjured mice, n = 4 control mice after PT, n = 3 ancrod mice after PT, unpaired Student’s t-test, *P < 0.05).
Fig. 3 Fibrinogen induces astrogliogenesis via the BMP–Id3 axis. a Microarray gene expression profile of NSPCs treated for 12 h with fibrinogen compared to control cells. Heatmap analysis showing genes regulated by a factor of at least 4 between fibrinogen-treated and control NSPCs. (n = 3). b Immunolabeling for phosphorylated Smad1/5/8 (P-Smad1/5/8, red) in fibrinogen-treated hippocampal NSPCs. White boxes indicate enlargement of nuclear P-Smad1/5/8- and P-Smad1/5/8 + cell in untreated and fibrinogen-treated conditions, respectively. Scale bar, 46 μm. Quantification of nuclear P-Smad1/5/8. (n = 2, experiments performed in duplicates (mean ± s.e.m., unpaired Student’s t-test, ***P < 0.001). c Immunoblot for P-Smad1/5/8 and Smad1 in NSPCs pretreated with a BMP receptor inhibitor before fibrinogen stimulation. BMP-2 served as positive control. d GFAP + astrocytes in NSPC cultures pretreated with a BMP receptor inhibitor 1 h before fibrinogen treatment 2 days after initiation of differentiation. Scale bar, 125 μm. Quantification of GFAP + astrocytes. (n = 5, (mean ± s.e.m, one-way ANOVA and Bonferroni’s multiple comparisons test, **P < 0.01, ***P < 0.001, ****P < 0.0001). e GFAP + astrocytes (green) in fibrinogen-treated Id3−/− and WT NSPCs cultures after 2 days on poly‐D‐lysine. Scale bar, 72 μm. Quantification of GFAP + astrocytes. (n = 4, WT; n = 3, Id3−/− cells, mean ± s.e.m, unpaired Student’s t-test, *P < 0.05). f Experimental setup for photothrombosis on Nestin-CreERT2::Rosa26-yfp mice. TAM: tamoxifen (right, top). Id3 (red) and YFP (green) immunostainings in the SVZ of uninjured mice and of ancrod-treated mice compared to control WT mice 1 day after PT. The white boxes indicate the enlargement of an Id3 + YFP + (right, top) and an Id3-YFP + (right, bottom) cell in the SVZ of control mice and fibrinogen-depleted mice, respectively, 1 day after PT. Scale bars, 30 μm, left and 8 µm, enlargement. Quantification of Id3 + YFP + cells in the SVZ per area. (n = 4 uninjured mice, n = 4 control mice after PT, n = 3 ancrod mice after PT, unpaired Student’s t-test, *P < 0.05).CC BY · PubMed Central
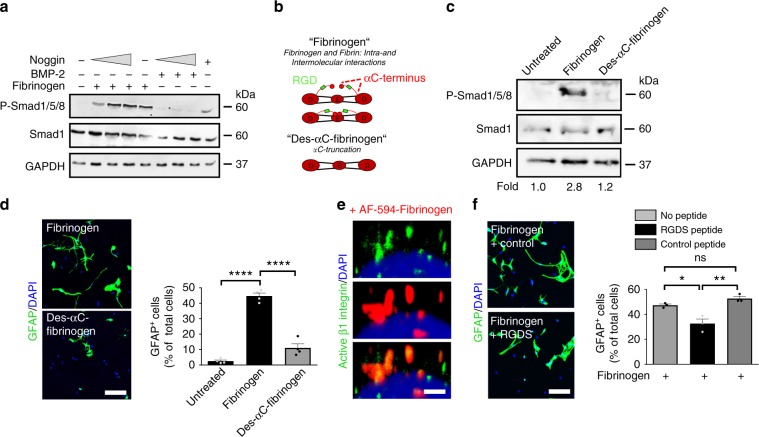
Fig. 4 Fibrinogen αC domain requirement for NSPC differentiation into astrocytes. a Immunoblot for P-Smad1/5/8 and Smad1 in NSPCs pretreated with an increasing concentration of Noggin before fibrinogen stimulation. BMP-2 served as positive control. b Scheme illustrating fibrinogen fractions isolated from plasma. Human Des-αC-fibrinogen lacks most of the residues of the C-terminus of the Aα chain including the RGD sequence. c Immunoblot for P-Smad1/5/8 and total Smad1 protein expression in NSPCs 2 days after fibrinogen or Des-αC-fibrinogen treatment. Values are mean of n = 3 independent experiments. d GFAP + astrocytes in fibrinogen- and Des-αC-fibrinogen-treated NSPC cultures 2 days after initiation of differentiation. Scale bar, 125 μm. Quantification of GFAP + astrocytes derived from fibrinogen- or Des-αC-fibrinogen-treated NSPCs. Results are from four independent experiments (mean ± s.e.m, one-way ANOVA and Bonferroni’s multiple comparisons test, ****P < 0.0001). e Active β1-integrin (green) immunostaining in WT NSPCs treated for 15 min with AF594-fibrinogen (red). Scale bar, 2 μm. Representative images of two independent experiments are shown. f GFAP + astrocytes in untreated and fibrinogen-treated NSPC cultures pretreated with the integrin-blocking RGDS or the control PDEA peptides for 2 days. Scale bar, 60 μm. Quantification of GFAP + astrocytes derived from untreated and fibrinogen-treated NSPCs pretreated with the PDEA (control) and RGDS peptides. Results from three independent experiments performed in duplicates are shown (mean ± s.e.m, one-way ANOVA and Bonferroni’s multiple comparisons test, *P < 0.05, **P < 0.01, ns not significant).
Fig. 4 Fibrinogen αC domain requirement for NSPC differentiation into astrocytes. a Immunoblot for P-Smad1/5/8 and Smad1 in NSPCs pretreated with an increasing concentration of Noggin before fibrinogen stimulation. BMP-2 served as positive control. b Scheme illustrating fibrinogen fractions isolated from plasma. Human Des-αC-fibrinogen lacks most of the residues of the C-terminus of the Aα chain including the RGD sequence. c Immunoblot for P-Smad1/5/8 and total Smad1 protein expression in NSPCs 2 days after fibrinogen or Des-αC-fibrinogen treatment. Values are mean of n = 3 independent experiments. d GFAP + astrocytes in fibrinogen- and Des-αC-fibrinogen-treated NSPC cultures 2 days after initiation of differentiation. Scale bar, 125 μm. Quantification of GFAP + astrocytes derived from fibrinogen- or Des-αC-fibrinogen-treated NSPCs. Results are from four independent experiments (mean ± s.e.m, one-way ANOVA and Bonferroni’s multiple comparisons test, ****P < 0.0001). e Active β1-integrin (green) immunostaining in WT NSPCs treated for 15 min with AF594-fibrinogen (red). Scale bar, 2 μm. Representative images of two independent experiments are shown. f GFAP + astrocytes in untreated and fibrinogen-treated NSPC cultures pretreated with the integrin-blocking RGDS or the control PDEA peptides for 2 days. Scale bar, 60 μm. Quantification of GFAP + astrocytes derived from untreated and fibrinogen-treated NSPCs pretreated with the PDEA (control) and RGDS peptides. Results from three independent experiments performed in duplicates are shown (mean ± s.e.m, one-way ANOVA and Bonferroni’s multiple comparisons test, *P < 0.05, **P < 0.01, ns not significant).CC BY · PubMed Central
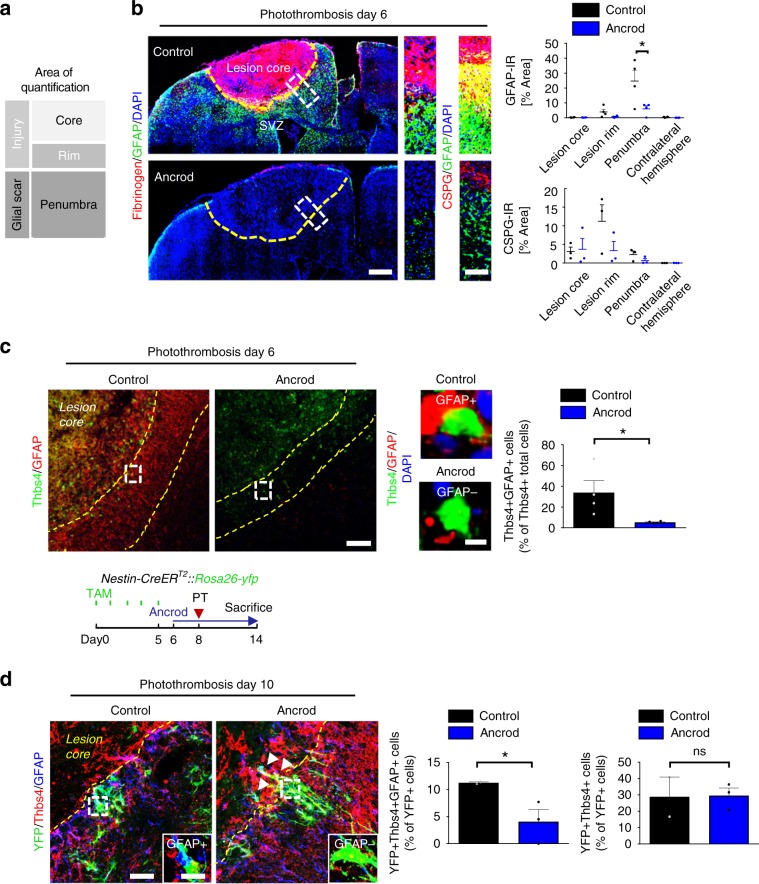
Fig. 5 Fibrinogen-induced SVZ astrocytes add to cortical scar. a Representation of the different lesion regions quantified by immunoreactivity. b Fibrinogen deposition (red) and GFAP + astrocytes in the brain of fibrinogen-depleted mice (Ancrod) compared to controls (NaCl) at 6 days after PT (left). Yellow dotted line delineates the lesion area. The white boxes indicate the enlargement of the lesion region quantified for GFAP (right, top) and CSPGs (right, bottom) immunoreactivities. Quantifications of GFAP and CSPG immunoreactivities in the different lesion regions (n = 4 mice, mean ± s.e.m, one-way ANOVA and Bonferroni’s multiple comparisons test, *P < 0.05). c Immunolabeling for Thbs4 (green) and GFAP (red) in the lesion area of ancrod and control mice at 6 days after PT. Yellow dotted lines delineate the penumbra. The white boxes indicate the enlargement of a Thbs4 + GFAP + cell (top, right) in controls and Thbs4 + GFAP- cell in ancrod mice (right, bottom). Quantification of Thbs4 + GFAP + astrocytes in the penumbra of ancrod and control mice (n = 4 mice, mean ± s.e.m, unpaired Student’s t-test, *P < 0,05). d Experimetal setup for ancrod-administered Nestin-CreERT2::Rosa26-yfp mice. TAM: tamoxifen (top). YFP (green), Thbs4 (red) and GFAP (blue) immunostainings in the lesion area of ancrod and control mice at 10 days after PT. Yellow dotted lines delineate the lesion area. The white boxes indicate the enlargement of an YFP + Thbs4 + GFAP + cell in control and YFP + Thbs4 + GFAP- cell in ancrod mice. Quantifications of YFP + Thbs4 + GFAP + astrocytes (left) and YFP + Thbs4 + cells (right) in the penumbra of ancrod and control mice (n = 2 control mice, n = 3 ancrod mice, unpaired, one-tailed Student’s t-test, *P < 0,05, ns, not significant). SVZ subventricular zone.
Fig. 5 Fibrinogen-induced SVZ astrocytes add to cortical scar. a Representation of the different lesion regions quantified by immunoreactivity. b Fibrinogen deposition (red) and GFAP + astrocytes in the brain of fibrinogen-depleted mice (Ancrod) compared to controls (NaCl) at 6 days after PT (left). Yellow dotted line delineates the lesion area. The white boxes indicate the enlargement of the lesion region quantified for GFAP (right, top) and CSPGs (right, bottom) immunoreactivities. Quantifications of GFAP and CSPG immunoreactivities in the different lesion regions (n = 4 mice, mean ± s.e.m, one-way ANOVA and Bonferroni’s multiple comparisons test, *P < 0.05). c Immunolabeling for Thbs4 (green) and GFAP (red) in the lesion area of ancrod and control mice at 6 days after PT. Yellow dotted lines delineate the penumbra. The white boxes indicate the enlargement of a Thbs4 + GFAP + cell (top, right) in controls and Thbs4 + GFAP- cell in ancrod mice (right, bottom). Quantification of Thbs4 + GFAP + astrocytes in the penumbra of ancrod and control mice (n = 4 mice, mean ± s.e.m, unpaired Student’s t-test, *P < 0,05). d Experimetal setup for ancrod-administered Nestin-CreERT2::Rosa26-yfp mice. TAM: tamoxifen (top). YFP (green), Thbs4 (red) and GFAP (blue) immunostainings in the lesion area of ancrod and control mice at 10 days after PT. Yellow dotted lines delineate the lesion area. The white boxes indicate the enlargement of an YFP + Thbs4 + GFAP + cell in control and YFP + Thbs4 + GFAP- cell in ancrod mice. Quantifications of YFP + Thbs4 + GFAP + astrocytes (left) and YFP + Thbs4 + cells (right) in the penumbra of ancrod and control mice (n = 2 control mice, n = 3 ancrod mice, unpaired, one-tailed Student’s t-test, *P < 0,05, ns, not significant). SVZ subventricular zone.CC BY · PubMed Central
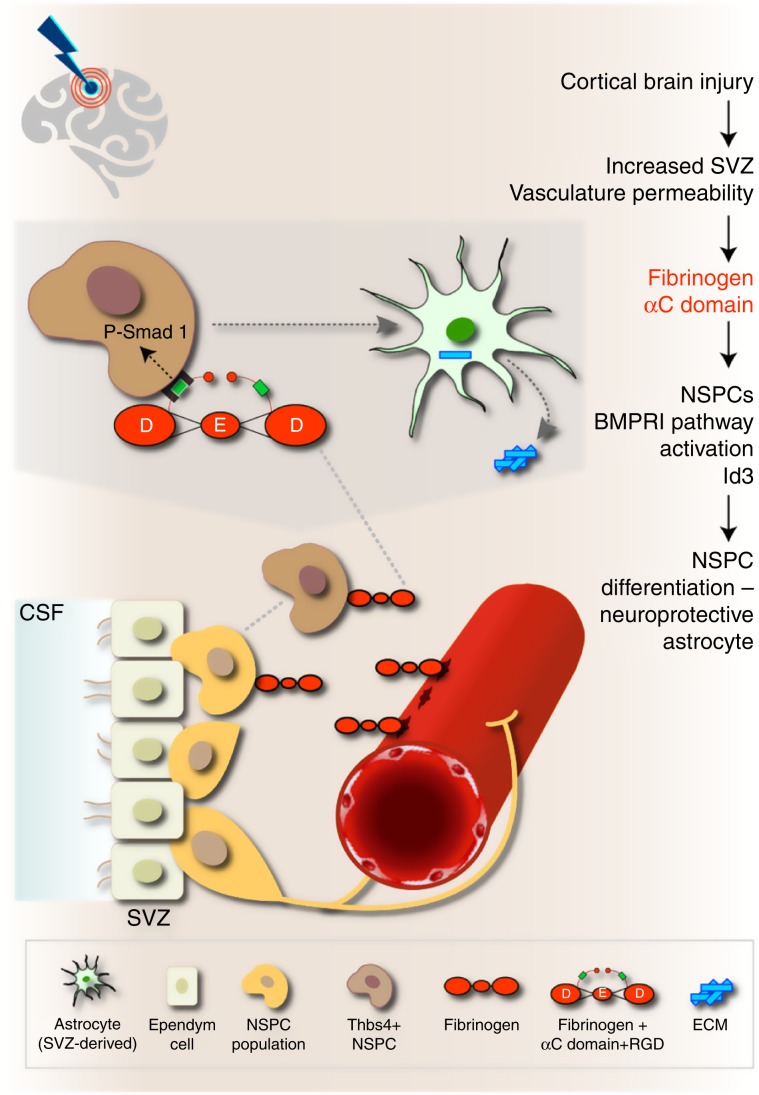
Fig. 6 Working model for the role of fibrinogen on SVZ NSPCs in CNS disease. In the healthy brain, NSPCs of the SVZ continuously generate mobile DCX+ neuroblasts that migrate through the rostral migratory stream to the olfactory bulb to become newborn neurons. Cortical injury results in increased SVZ vasculature permeability and fibrinogen deposition into the SVZ stem cell niche environment. Fibrinogen activates BMP receptor signaling via its αC domain inducing NSPC differentiation into neuroprotective astrocytes, which migrate towards the cortical lesion area and secrete Thbs4. Local provisional fibrinogen thus activates BMP signaling in NSPCs inducing their differentiation into astrocytes at sites of vascular permeability in the CNS. CSF cerebrospinal fluid, NSPCs neural stem/precursor cells, RGD Arg–Gly-Asp sequence (integrin binding site), SVZ subventricular zone. The Astrocyte image was adapted from http://togotv.dbcls.jp/ja/togopic.2011.17.html, under Creative Commons Attribution 4.0 International (CC BY 4.0) license. The original astrocyte image was designed by Hiromasa Ono. The Brain image was adapted from https://icon-icons.com/de/symbol/Gehirn/39333, under Creative Commons Attribution 4.0 International (CC BY 4.0) license. The original brain image was designed by Lorc, Delapouite & contributors.
Fig. 6 Working model for the role of fibrinogen on SVZ NSPCs in CNS disease. In the healthy brain, NSPCs of the SVZ continuously generate mobile DCX+ neuroblasts that migrate through the rostral migratory stream to the olfactory bulb to become newborn neurons. Cortical injury results in increased SVZ vasculature permeability and fibrinogen deposition into the SVZ stem cell niche environment. Fibrinogen activates BMP receptor signaling via its αC domain inducing NSPC differentiation into neuroprotective astrocytes, which migrate towards the cortical lesion area and secrete Thbs4. Local provisional fibrinogen thus activates BMP signaling in NSPCs inducing their differentiation into astrocytes at sites of vascular permeability in the CNS. CSF cerebrospinal fluid, NSPCs neural stem/precursor cells, RGD Arg–Gly-Asp sequence (integrin binding site), SVZ subventricular zone. The Astrocyte image was adapted from http://togotv.dbcls.jp/ja/togopic.2011.17.html, under Creative Commons Attribution 4.0 International (CC BY 4.0) license. The original astrocyte image was designed by Hiromasa Ono. The Brain image was adapted from https://icon-icons.com/de/symbol/Gehirn/39333, under Creative Commons Attribution 4.0 International (CC BY 4.0) license. The original brain image was designed by Lorc, Delapouite & contributors.CC BY · PubMed Central

Verification

Claims the paper makes

The claims and statistics of this paper haven’t been checked yet.

Run the check — free, no account needed. It reads the open-access text and checks the sources it cites.

A few free checks a day · papers already verified open instantly · results are public

Claims other papers make about this one

Each is checked against this paper’s own text: does it say what the citing paper says it does?

Self-check

Percentages, sums and reported differences re-computed from the paper’s own numbers.

The self-check needs the paper’s full text.

Citations

Cites

1 retracted

Show all 12 references

Research works printed but not linked: 57

  1. Chaker, Z., Codega, P. & Doetsch, F. A mosaic world: puzzles revealed by adult neural stem cell heterogeneity. Wiley Interdiscip. Rev. Dev. Biol. 5, 640–658 (2016). · DOI · Paper page
  2. Ihrie, R. A. & Alvarez-Buylla, A. Lake-front property: a unique germinal niche by the lateral ventricles of the adult brain. Neuron 70, 674–686 (2011). · DOI
  3. Schildge, S. et al. Instructions from the vascular system—directing neural stem cell fate in health and disease. Curr. Med. Chem. 21, 2190–2207 (2014). · DOI
  4. Bohrer, C. et al. The balance of Id3 and E47 determines neural stem/precursor cell differentiation into astrocytes. EMBO J. 34, 2804–2819 (2015). · DOI
  5. Faiz, M. et al. Adult neural stem cells from the subventricular zone give rise to reactive astrocytes in the cortex after stroke. Cell Stem Cell 17, 624–634 (2015). · DOI
  6. Shen, Q. et al. Endothelial cells stimulate self-renewal and expand neurogenesis of neural stem cells. Science 304, 1338–1340 (2004). · DOI
  7. Alvarez-Buylla, A. & Garcia-Verdugo, J. M. Neurogenesis in adult subventricular zone. J. Neurosci. 22, 629–634 (2002). · DOI
  8. Doetsch, F. A niche for adult neural stem cells. Curr. Opin. Genet Dev. 13, 543–550 (2003). · DOI
  9. Lois, C. & Alvarez-Buylla, A. Long-distance neuronal migration in the adult mammalian brain. Science 264, 1145–1148 (1994). · DOI
  10. Thored, P. et al. Persistent production of neurons from adult brain stem cells during recovery after stroke. Stem Cells 24, 739–747 (2006). · DOI
  11. Adams, R. A., Passino, M., Sachs, B. D., Nuriel, T. & Akassoglou, K. Fibrin mechanisms and functions in nervous system pathology. Mol. Inter. 4, 163–176 (2004).
  12. Petersen, M. A., Ryu, J. K. & Akassoglou, K. Fibrinogen in neurological diseases: mechanisms, imaging and therapeutics. Nat. Rev. Neurosci. 19, 283–301 (2018). · DOI · Paper page
  13. Schachtrup, C. et al. Fibrinogen inhibits neurite outgrowth via beta 3 integrin-mediated phosphorylation of the EGF receptor. Proc. Natl Acad. Sci. USA 104, 11814–11819 (2007). · DOI · Paper page
  14. Schachtrup, C. et al. Fibrinogen triggers astrocyte scar formation by promoting the availability of active TGF-beta after vascular damage. J. Neurosci. 30, 5843–5854 (2010). · DOI
  15. Martino, M. M., Briquez, P. S., Ranga, A., Lutolf, M. P. & Hubbell, J. A. Heparin-binding domain of fibrin(ogen) binds growth factors and promotes tissue repair when incorporated within a synthetic matrix. Proc. Natl Acad. Sci. USA 110, 4563–4568 (2013). · DOI
  16. Robel, S., Berninger, B. & Gotz, M. The stem cell potential of glia: lessons from reactive gliosis. Nat. Rev. Neurosci. 12, 88–104 (2011). · DOI
  17. Labat-gest, V. & Tomasi, S. Photothrombotic ischemia: a minimally invasive and reproducible photochemical cortical lesion model for mouse stroke studies. J. Vis. Exp. 76, 1–6 (2013). · DOI
  18. Reynolds, B. A. & Weiss, S. Generation of neurons and astrocytes from isolated cells of the adult mammalian central nervous system. Science 255, 1707–1710 (1992). · DOI · Paper page
  19. Johe, K. K., Hazel, T. G., Muller, T., Dugich-Djordjevic, M. M. & McKay, R. D. Single factors direct the differentiation of stem cells from the fetal and adult central nervous system. Genes Dev. 10, 3129–3140 (1996). · DOI
  20. Raponi, E. et al. S100B expression defines a state in which GFAP-expressing cells lose their neural stem cell potential and acquire a more mature developmental stage. Glia 55, 165–177 (2007). · DOI
  21. Gotz, M., Sirko, S., Beckers, J. & Irmler, M. Reactive astrocytes as neural stem or progenitor cells: in vivo lineage, In vitro potential, and Genome-wide expression analysis. Glia 63, 1452–1468 (2015). · DOI
  22. Zamanian, J. L. et al. Genomic analysis of reactive astrogliosis. J. Neurosci. 32, 6391–6410 (2012). · DOI · Paper page
  23. Bardehle, S. et al. Live imaging of astrocyte responses to acute injury reveals selective juxtavascular proliferation. Nat. Neurosci. 16, 580–586 (2013). · DOI
  24. Koops, A. et al. Cultured astrocytes express biglycan, a chondroitin/dermatan sulfate proteoglycan supporting the survival of neocortical neurons. Brain Res Mol. Brain Res. 41, 65–73 (1996). · DOI
  25. Cuny, G. D. et al. Structure-activity relationship study of bone morphogenetic protein (BMP) signaling inhibitors. Bioorg. Med Chem. Lett. 18, 4388–4392 (2008). · DOI
  26. Mosesson, M. W. Fibrinogen and fibrin structure and functions. J. Thromb. Haemost. 3, 1894–1904 (2005). · DOI · Paper page
  27. North, H. A., Pan, L., McGuire, T. L., Brooker, S. & Kessler, J. A. beta1-integrin alters ependymal stem cell BMP receptor localization and attenuates astrogliosis after spinal cord injury. J. Neurosci. 35, 3725–3733 (2015). · DOI
  28. Koo, J. et al. Evaluation of fibrinogen self-assembly: role of its alphaC region. J. Thromb. Haemost. 8, 2727–2735 (2010). · DOI
  29. Lagace, D. C. et al. Dynamic contribution of nestin-expressing stem cells to adult neurogenesis. J. Neurosci. 27, 12623–12629 (2007). · DOI · Paper page
  30. Lacar, B. et al. Neural progenitor cells regulate capillary blood flow in the postnatal subventricular zone. J. Neurosci. 32, 16435–16448 (2012). · DOI
  31. Janzer, R. C. & Raff, M. C. Astrocytes induce blood-brain barrier properties in endothelial cells. Nature 325, 253–257 (1987). · DOI
  32. Fernandez-Klett, F., Offenhauser, N., Dirnagl, U., Priller, J. & Lindauer, U. Pericytes in capillaries are contractile in vivo, but arterioles mediate functional hyperemia in the mouse brain. Proc. Natl Acad. Sci. USA 107, 22290–22295 (2010). · DOI · Paper page
  33. Wipff, P. J. & Hinz, B. Integrins and the activation of latent transforming growth factor beta1—an intimate relationship. Eur. J. Cell Biol. 87, 601–615 (2008). · DOI
  34. Flanagan, L. A., Rebaza, L. M., Derzic, S., Schwartz, P. H. & Monuki, E. S. Regulation of human neural precursor cells by laminin and integrins. J. Neurosci. Res. 83, 845–856 (2006). · DOI · Paper page
  35. Emsley, J. G. & Hagg, T. alpha6beta1 integrin directs migration of neuronal precursors in adult mouse forebrain. Exp. Neurol. 183, 273–285 (2003). · DOI
  36. Pan, L. et al. beta1-Integrin and integrin linked kinase regulate astrocytic differentiation of neural stem cells. PLoS ONE 9, e104335 (2014). · DOI
  37. Petersen, M. A. et al. Fibrinogen activates BMP signaling in oligodendrocyte progenitor cells and inhibits remyelination after vascular damage. Neuron 96, 1003–1012 e1007 (2017). · DOI
  38. Hackett, A. Y., et al. Injury type-dependent differentiation of NG2 glia into heterogeneous astrocytes. Exp. Neurol. 308, 72–79 (2018). · DOI
  39. Silver, J. & Miller, J. H. Regeneration beyond the glial scar. Nat. Rev. Neurosci. 5, 146–156 (2004). · DOI
  40. Cregg, J. M. et al. Functional regeneration beyond the glial scar. Exp. Neurol. 253, 197–207 (2014). · DOI
  41. Burda, J. E., Bernstein, A. M. & Sofroniew, M. V. Astrocyte roles in traumatic brain injury. Exp. Neurol. 275, 305–315 (2015). · DOI
  42. Cavaglia, M. et al. Regional variation in brain capillary density and vascular response to ischemia. Brain Res. 910, 81–93 (2001). · DOI
  43. Cortes-Canteli, M. et al. Fibrinogen and beta-amyloid association alters thrombosis and fibrinolysis: a possible contributing factor to Alzheimer’s disease. Neuron 66, 695–709 (2010). · DOI · Paper page
  44. Merlini, M. et al. Fibrinogen induces microglia-mediated spine elimination and cognitive impairment in an Alzheimer’s disease model. Neuron 101, 1099–1108 e1096 (2019). · DOI · Paper page
  45. Lu, P. et al. Long-distance axonal growth from human induced pluripotent stem cells after spinal cord injury. Neuron 83, 789–796 (2014). · DOI
  46. Oki, K. et al. Human-induced pluripotent stem cells form functional neurons and improve recovery after grafting in stroke-damaged brain. Stem Cells 30, 1120–1133 (2012). · DOI
  47. Suh, T. T. et al. Resolution of spontaneous bleeding events but failure of pregnancy in fibrinogen-deficient mice. Genes Dev. 9, 2020–2033 (1995). · DOI
  48. Srinivas, S. et al. Cre reporter strains produced by targeted insertion of EYFP and ECFP into the ROSA26 locus. BMC Dev. Biol. 1, 4 (2001). · DOI · Paper page
  49. Rivera, R. R., Johns, C. P., Quan, J., Johnson, R. S. & Murre, C. Thymocyte selection is regulated by the helix-loop-helix inhibitor protein, Id3. Immunity 12, 17–26 (2000). · DOI
  50. Akassoglou, K., Yu, W. M., Akpinar, P. & Strickland, S. Fibrin inhibits peripheral nerve remyelination by regulating Schwann cell differentiation. Neuron 33, 861–875 (2002). · DOI
  51. Mosesson, M. W., Galanakis, D. K. & Finlayson, J. S. Comparison of human plasma fibrinogen subfractions and early plasmic fibrinogen derivatives. J. Biol. Chem. 249, 4656–4664 (1974). · DOI
  52. Babu, H., Cheung, G., Kettenmann, H., Palmer, T. D. & Kempermann, G. Enriched monolayer precursor cell cultures from micro-dissected adult mouse dentate gyrus yield functional granule cell-like neurons. PLoS ONE 2, e388 (2007). · DOI
  53. Rolando, C. et al. Multipotency of adult hippocampal NSCs in vivo is restricted by Drosha/NFIB. Cell Stem Cell 19, 653–662 (2016). · DOI
  54. Engers, D. W. et al. Discovery, synthesis, and structure-activity relationship development of a series of N-(4-acetamido)phenylpicolinamides as positive allosteric modulators of metabotropic glutamate receptor 4 (mGlu(4)) with CNS exposure in rats. J. Med. Chem. 54, 1106–1110 (2011). · DOI
  55. Bonaguidi, M. A. et al. LIF and BMP signaling generate separate and discrete types of GFAP-expressing cells. Development 132, 5503–5514 (2005). · DOI
  56. Schachtrup, C. et al. Nuclear pore complex remodeling by p75 cleavage controls TGF-beta signaling and astrocyte functions. Nat. Neurosci. 18, 1077–1080 (2015). · DOI
  57. Galanakis, D. K. et al. Homophenotypic Aalpha R16H fibrinogen (Kingsport): uniquely altered polymerization associated with slower fibrinopeptide A than fibrinopeptide B release. Blood Coagul. Fibrinolysis 18, 731–737 (2007). · DOI

Cited by

Sorted by citations

Metadata

Authors
Pous, L., Deshpande, S. S., Nath, S., Mezey, S., Malik, S. C., Schildge, S., Bohrer, C., Topp, K., Pfeifer, D., Fernández-Klett, F., Doostkam, S., Galanakis, D. K., Taylor, V., Akassoglou, K., & Schachtrup, C.
Venue
Nature Communications
Published
2020-01-31
Volume
11
Issue
1
ISSN
2041-1723
Cited by
81
References
12
Language
en

About these checks

Registry, retraction, Cites and statistics results are computed, not judged, with one exception: a printed reference that no index lists is read once by a model before it counts as a citation error. Claims are extracted by a model and kept only when their quote appears verbatim in the text; each cited source is then checked, with a model’s help, for whether it says what the claim relies on. Those verdicts can be wrong — read the claim’s quote and the cited source before relying on one.

Statistics and arithmetic are recomputed, not judged.

Confidence bands are shown only for fields calibrated on our annotated test set. None is calibrated yet, so no band is shown.

What counts as a claim ›How we measure confidence ›How we check this ›

Are you an author, or do you see a problem with this page? Request a review