

The DOI matches its Crossref record; 131 of the 131 references it cites were found in a registry or an index.
Single cell transcriptomics of human epidermis identifies basal stem cell transition states
Open accessPublished version of a preprint
Abstract
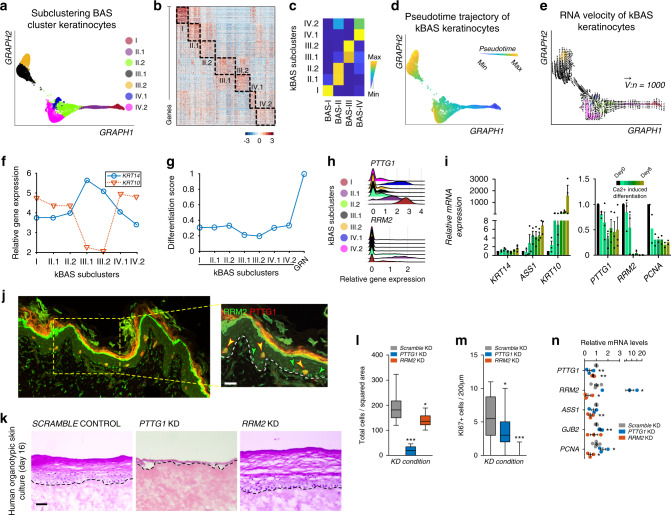
How stem cells give rise to epidermis is unclear despite the crucial role the epidermis plays in barrier and appendage formation. Here we use single cell-RNA sequencing to interrogate basal stem cell heterogeneity of human interfollicular epidermis and find four spatially distinct stem cell populations at the top and bottom of rete ridges and transitional positions between the basal and suprabasal epidermal layers. Cell-cell communication modeling suggests that basal cell populations serve as crucial signaling hubs to maintain epidermal communication. Combining pseudotime, RNA velocity, and cellular entropy analyses point to a hierarchical differentiation lineage supporting multi-stem cell interfollicular epidermal homeostasis models and suggest that transitional basal stem cells are stable states essential for proper stratification. Finally, alterations in differentially expressed transitional basal stem cell genes result in severe thinning of human skin equivalents, validating their essential role in epidermal homeostasis and reinforcing the critical nature of basal stem cell heterogeneity.
Overview
The claims and statistics of this paper haven’t been checked yet.
Run the check — free, no account needed. It reads the open-access text and checks the sources it cites.
Integrity signals
Registry
Cites
Statistics
Figures
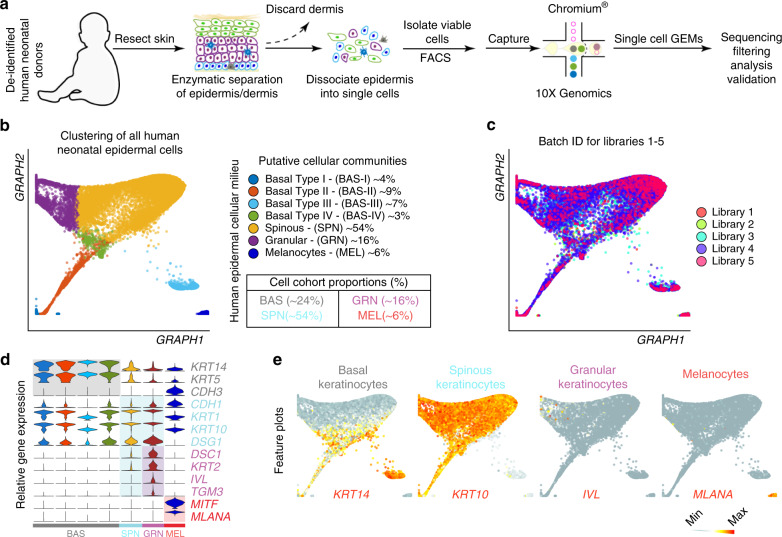
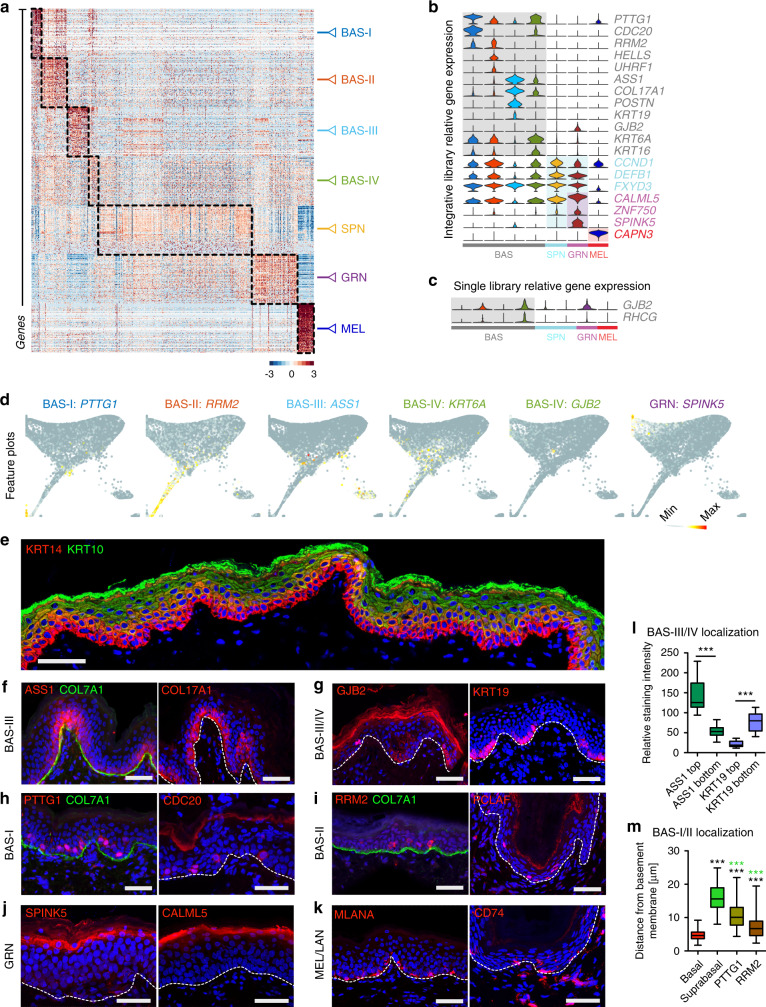
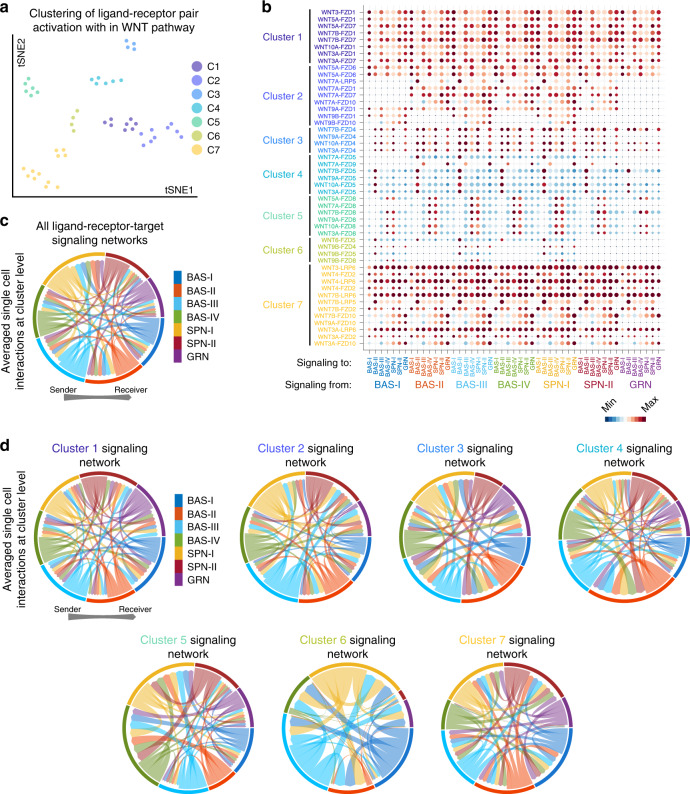
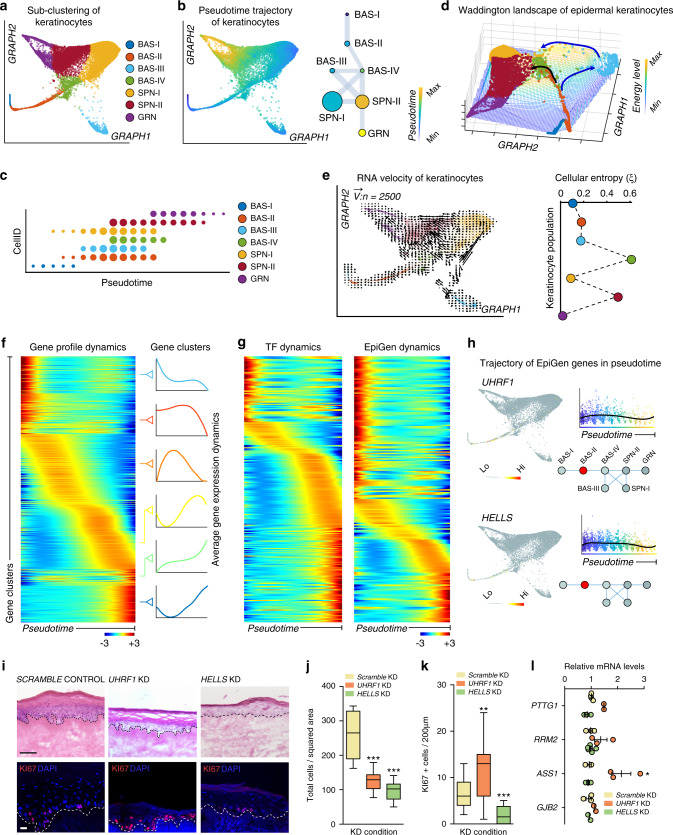
Verification
Claims the paper makes
The claims and statistics of this paper haven’t been checked yet.
Run the check — free, no account needed. It reads the open-access text and checks the sources it cites.
Claims other papers make about this one
Each is checked against this paper’s own text: does it say what the citing paper says it does?
The source backs part of the claim, not all of it — or backs it for a different population, condition or comparison.
In the citing paper
“It enables both profiling of gene expression measurements at a single-cell resolution and identification of reliable cellular heterogeneity, allowing for the identification of previously unrecognized levels of cellular heterogeneity, revealing regulatory relationships between genes, and tracking the trajectories of distinct cell lineages in the same or different developmental stages [63–66].”
From Diversity of human skin three-dimensional organotypic cultures (2024) · cites this paper as [66]
Experimental — accuracy not yet measuredThe source backs part of the claim, not all of it — or backs it for a different population, condition or comparison.
In the citing paper
“we spatially resolved four distinct basal stem cell populations within human IFE and delineated multiple spinous and granular cell populations that contributed to a hierarchical differentiation lineage”
From Single-cell transcriptomics of human-skin-equivalent organoids (2023) · cites this paper as [27]
Experimental — accuracy not yet measuredThe cited source says what the claim attributes to it.
In the citing paper
“human epidermis is more heterogeneous than previously thought.”
From Single-cell transcriptomics of human-skin-equivalent organoids (2023) · cites this paper as [27]
The cited source says what the claim attributes to it.
In the citing paper
“BAS-III cells typically sit atop the rete ridges in vivo, whereas BAS-IV cells lie at the bottom of rete ridges.27”
From Single-cell transcriptomics of human-skin-equivalent organoids (2023) · cites this paper as [27]
Self-check
Percentages, sums and reported differences re-computed from the paper’s own numbers.
The self-check needs the paper’s full text.
Citations
Cites
Subramanian, A., Tamayo, P., Mootha, V. K., Mukherjee, S., Ebert, B. L., Gillette, M. A., Paulovich, A., Pomeroy, S. L., Golub, T. R., Lander, E. S., et al. (2005) · Proceedings of the National Academy of Sciences · doi:10.1073/pnas.0506580102 · Cited by 53,625
Enrichr: a comprehensive gene set enrichment analysis web server 2016 update
Kuleshov, M. V., Jones, M. R., Rouillard, A. D., Fernandez, N. F., Duan, Q., Wang, Z., Koplev, S., Jenkins, S. L., Jagodnik, K. M., Lachmann, A., et al. (2016) · Nucleic Acids Research · doi:10.1093/nar/gkw377 · Cited by 10,799
Enrichr: interactive and collaborative HTML5 gene list enrichment analysis tool
Chen, E. Y., Tan, C. M., Kou, Y., Duan, Q., Wang, Z., Meirelles, G. V., Clark, N. R., & Ma’ayan, A. (2013) · BMC Bioinformatics · doi:10.1186/1471-2105-14-128 · Cited by 7,814
Trapnell, C., Cacchiarelli, D., Grimsby, J., Pokharel, P., Li, S., Morse, M., Lennon, N. J., Livak, K. J., Mikkelsen, T. S., & Rinn, J. L. (2014) · Nature Biotechnology · doi:10.1038/nbt.2859 · Cited by 7,314
Highly parallel genome-wide expression profiling of individual cells using nanoliter droplets.
Macosko, E. Z., Basu, A., Satija, R., Nemesh, J., Shekhar, K., Goldman, M., Tirosh, I., Bialas, A. R., Kamitaki, N., Martersteck, E. M., et al. (2015) · Cell · doi:10.1016/j.cell.2015.05.002 · Cited by 7,110
Wnt/β-Catenin Signaling in Development and Disease
Clevers, H. (2006) · Cell · doi:10.1016/j.cell.2006.10.018 · Cited by 5,568
Wnt/β-catenin signaling and disease
Clevers, H., & Nusse, R. (2012) · Cell · doi:10.1016/j.cell.2012.05.012 · Cited by 5,554
Reversed graph embedding resolves complex single-cell trajectories
Qiu, X., Mao, Q., Tang, Y., Wang, L., Chawla, R., Pliner, H. A., & Trapnell, C. (2017) · Nature Methods · doi:10.1038/nmeth.4402 · Cited by 5,070
Dissecting the multicellular ecosystem of metastatic melanoma by single-cell RNA-seq
Tirosh, I., Izar, B., Prakadan, S. M., Wadsworth, M. H., Treacy, D., Trombetta, J. J., Rotem, A., Rodman, C., Lian, C., Murphy, G., et al. (2016) · Science · doi:10.1126/science.aad0501 · Cited by 4,944
Wnt/β-Catenin Signaling, Disease, and Emerging Therapeutic Modalities
Nusse, R., & Clevers, H. (2017) · Cell · doi:10.1016/j.cell.2017.05.016 · Cited by 4,342
Cited by
Sorted by citations
Deciphering cell–cell interactions and communication from gene expression
Armingol, E., Officer, A., Harismendy, O., & Lewis, N. E. (2021) · Nature Reviews Genetics · doi:10.1038/s41576-020-00292-x · Cited by 1,267
Screening cell–cell communication in spatial transcriptomics via collective optimal transport
(2023) · doi:10.1038/s41592-022-01728-4 · Cited by 484
Self-citationOber-Reynolds, B., Wang, C., Ko, J. M., Rios, E. J., Aasi, S. Z., Davis, M. M., Oro, A. E., & Greenleaf, W. J. (2023) · Nature Genetics · doi:10.1038/s41588-023-01445-4 · Cited by 83
Single-cell RNA-Seq of human esophageal epithelium in homeostasis and allergic inflammation
Rochman, M., Wen, T., Kotliar, M., Dexheimer, P. J., Morgenstern, N. B.-B., Caldwell, J. M., Lim, H., & Rothenberg, M. E. (2022) · JCI Insight · doi:10.1172/jci.insight.159093 · Cited by 81
Significance of stress keratin expression in normal and diseased epithelia
Cohen, E., Johnson, C. N., Wasikowski, R., Billi, A. C., Tsoi, L. C., Kahlenberg, J. M., Gudjonsson, J. E., & Coulombe, P. A. (2024) · iScience · doi:10.1016/j.isci.2024.108805 · Cited by 69
Qiu, J., Qu, X., Wang, Y., Guo, C., Lv, B., Jiang, Q., Su, W., Wang, L., & Hua, K. (2023) · Advanced Science · doi:10.1002/advs.202204951 · Cited by 71
Enzo, E., Secone Seconetti, A., Forcato, M., Tenedini, E., Polito, M. P., Sala, I., Carulli, S., Contin, R., Peano, C., Tagliafico, E., et al. (2021) · Nature Communications · doi:10.1038/s41467-021-22779-9 · Cited by 66
Differential cell composition and split epidermal differentiation in human palm, sole, and hip skin
Wiedemann, J., Billi, A. C., Bocci, F., Kashgari, G. Y., Xing, E., Tsoi, L. C., Meller, L. L. T., Swindell, W. R., Wasikowski, R., Xing, X., et al. (2023) · Cell Reports · doi:10.1016/j.celrep.2023.111994 · Cited by 67
Self-citationVeniaminova, N. A., Jia, Y. Y., Hartigan, A. M., Huyge, T. J., Tsai, S.-Y., Grachtchouk, M. A., Nakagawa, S., Dlugosz, A. A., Atwood, S. X., & Wong, S. Y. (2023) · Cell Reports · doi:10.1016/j.celrep.2023.113121 · Cited by 65
Self-citationThrane, K., Winge, M. C. G., Wang, H., Chen, L., Guo, M. G., Andersson, A., Abalo, X. M., Yang, X., Kim, D. S., Longo, S. K., et al. (2023) · Journal of Investigative Dermatology · doi:10.1016/j.jid.2023.02.040 · Cited by 59
Pereira, D., & Sequeira, I. (2021) · Frontiers in Cell and Developmental Biology · doi:10.3389/fcell.2021.682143 · Cited by 65
Singh, K., Rustagi, Y., Abouhashem, A. S., Tabasum, S., Verma, P., Hernandez, E., Pal, D., Khona, D. K., Mohanty, S. K., Kumar, M., et al. (2022) · Journal of Clinical Investigation · doi:10.1172/jci157279 · Cited by 57
The Msi1-mTOR pathway drives the pathogenesis of mammary and extramammary Paget’s disease
Song, Y., Guerrero‐Juarez, C. F., Chen, Z., Tang, Y., Ma, X., Lv, C., Bi, X., Deng, M., Bu, L., Tian, Y., et al. (2020) · Cell Research · doi:10.1038/s41422-020-0334-5 · Cited by 56
Self-citationGeneration of Skin Organoids: Potential Opportunities and Challenges
Sun, H., Zhang, Y., & Li, Y. (2021) · Frontiers in Cell and Developmental Biology · doi:10.3389/fcell.2021.709824 · Cited by 55
Rete ridges: Morphogenesis, function, regulation, and reconstruction
Shen, Z., Sun, L., Liu, Z., Li, M., Cao, Y., Han, L., Wang, J., Wu, X., & Sang, S. (2022) · Acta Biomaterialia · doi:10.1016/j.actbio.2022.11.031 · Cited by 50
Suzuki, S., McCarrey, J. R., & Hermann, B. P. (2021) · Cell Reports · doi:10.1016/j.celrep.2021.108752 · Cited by 47
Theocharidis, G., Tekkela, S., Veves, A., McGrath, J. A., & Onoufriadis, A. (2022) · Experimental Dermatology · doi:10.1111/exd.14547 · Cited by 50
Human conjunctiva organoids to study ocular surface homeostasis and disease
Bannier-Hélaouët, M., Korving, J., Ma, Z., Begthel, H., Giladi, A., Lamers, M. M., van de Wetering, W. J., Yawata, N., Yawata, M., LaPointe, V. L. S., et al. (2024) · Cell stem cell · doi:10.1016/j.stem.2023.12.008 · Cited by 49
YAP1 activation by human papillomavirus E7 promotes basal cell identity in squamous epithelia
Hatterschide, J., Castagnino, P. A., Kim, H. W., Sperry, S. M., Montone, K. T., Basu, D., & White, E. A. (2022) · eLife · doi:10.7554/elife.75466 · Cited by 46
Burja, B., Paul, D., Tastanova, A., Edalat, S. G., Gerber, R., Houtman, M., Elhaï, M., Bürki, K., Staeger, R., Restivo, G., et al. (2022) · Frontiers in Cell and Developmental Biology · doi:10.3389/fcell.2022.872688 · Cited by 48
Guerrero‐Juarez, C. F., Lee, G. H., Liu, Y., Wang, S., Karikomi, M. K., Sha, Y., Chow, R. Y., Nguyen, T. T. L., Iglesias, V. S., Aasi, S. Z., et al. (2022) · Science Advances · doi:10.1126/sciadv.abm7981 · Cited by 48
Self-citationYuan, Y., 西北工业大学生态环境学院, 陕. 西. 7., Sun, D., Qin, T., Mao, S., Zhu, W., Yin, Y., Huang, J., Heller, R., Li, Z., et al. (2022) · 动物学研究 · doi:10.24272/j.issn.2095-8137.2022.086 · Cited by 43
Spatial multi-omics of human skin reveals KRAS and inflammatory responses to spaceflight
Park, J., Overbey, E. G., Narayanan, S. A., Kim, J., Tierney, B. T., Damle, N., Najjar, D., Ryon, K. A., Proszynski, J., Kleinman, A. S., et al. (2024) · Nature Communications · doi:10.1038/s41467-024-48625-2 · Cited by 41
Revisiting the significance of keratin expression in complex epithelia
Cohen, E., Johnson, C. N., Redmond, C. J., Nair, R. R., & Coulombe, P. A. (2022) · Journal of Cell Science · doi:10.1242/jcs.260594 · Cited by 39
The Biology of Varicella-Zoster Virus Replication in the Skin
Tommasi, C., & Breuer, J. (2022) · Viruses · doi:10.3390/v14050982 · Cited by 41
Roig‐Rosello, E., Dayan, G., Bovio, S., Manissier, P., Errazuriz-Cerda, E., & Rousselle, P. (2024) · Aging Cell · doi:10.1111/acel.14096 · Cited by 38
Advances in resolving the heterogeneity and dynamics of keratinocyte differentiation
Rice, G., & Rompolas, P. (2020) · Current Opinion in Cell Biology · doi:10.1016/j.ceb.2020.09.004 · Cited by 42
Plasticity of Epithelial Cells during Skin Wound HealingPreprint
Sun, X., Joost, S., & Kasper, M. (2022) · Cold Spring Harbor Perspectives in Biology · doi:10.1101/cshperspect.a041232 · Cited by 44
Li, D., Cheng, S., Pei, Y., Sommar, P., Kärner, J., Herter, E. K., Toma, M. A., Zhang, L., Pham, K., Cheung, Y.-T., et al. (2021) · Journal of Investigative Dermatology · doi:10.1016/j.jid.2021.07.176 · Cited by 36
Matricellular Proteins in the Homeostasis, Regeneration, and Aging of Skin
Raja, E., Clarin, M. T. R. D. C., & Yanagisawa, H. (2023) · International Journal of Molecular Sciences · doi:10.3390/ijms241814274 · Cited by 40
Sha, Y., Wang, S., Bocci, F., Zhou, P., & Nie, Q. H. (2021) · Frontiers in Genetics · doi:10.3389/fgene.2020.604585 · Cited by 34
Self-citationA Roadmap for a Consensus Human Skin Cell Atlas and Single-Cell Data Standardization
Almet, A. A., Yuan, H., Annusver, K., Ramos, R., Liu, Y., Wiedemann, J., Sorkin, D. H., Xu, N., Sonkoly, E., Haniffa, M. A., et al. (2023) · Journal of Investigative Dermatology · doi:10.1016/j.jid.2023.03.1679 · Cited by 33
Self-citationJin, L., Chen, Y., Muzaffar, S., Li, C., Mier-Aguilar, C. A., Khan, J., Kashyap, M. P., Liu, S., Srivastava, R. K., Deshane, J. S., et al. (2023) · Proceedings of the National Academy of Sciences · doi:10.1073/pnas.2315096120 · Cited by 33
Epidermal stem cells: skin surveillance and clinical perspective
Tang, X., Wang, J., Chen, J., Liu, W., Qiao, P., Quan, H., Li, Z., Dang, E., Wang, G., & Shao, S. (2024) · Journal of Translational Medicine · doi:10.1186/s12967-024-05600-1 · Cited by 41
Fukushima‐Nomura, A., Kawasaki, H., Yashiro, K., Obata, S., Tanese, K., Ebihara, T., Saeki, H., Etoh, T., Hasegawa, T., Yazaki, J., et al. (2025) · Nature Communications · doi:10.1038/s41467-025-59340-x · Cited by 33
Entropy as a measure of variability and stemness in single-cell transcriptomics
Gandrillon, O., Gaillard, M., Espinasse, T., Garnier, N., Dussiau, C., Kosmider, O., & Sujobert, P. (2021) · Current Opinion in Systems Biology · doi:10.1016/j.coisb.2021.05.009 · Cited by 35
Reuter, C., Hauf, L., Imdahl, F., Sen, R., Vafadarnejad, E., Fey, P., Finger, T., Jones, N. G., Walles, H., Barquist, L., et al. (2023) · Nature Communications · doi:10.1038/s41467-023-43437-2 · Cited by 31
Single-cell transcriptomics of human-skin-equivalent organoids
Stabell, A. R., Lee, G. E., Jia, Y., Wong, K. N., Wang, S., Ling, J., Nguyen, S. D., Sen, G. L., Nie, Q., & Atwood, S. X. (2023) · Cell Reports · doi:10.1016/j.celrep.2023.112511 · Cited by 30
Self-citationBinary organization of epidermal basal domains highlights robustness to environmental exposure
Ghuwalewala, S., Lee, S. A., Jiang, K., Baidya, J., Chovatiya, G. L., Kaur, P., Shalloway, D. I., & Tumbar, T. (2022) · The EMBO Journal · doi:10.15252/embj.2021110488 · Cited by 30
Regulation of epidermal stratification and development by basal keratinocytes
Yin, H., Hu, M., & Li, D. (2023) · Journal of Cellular Physiology · doi:10.1002/jcp.30978 · Cited by 30
May, D. P., Yun, S., Gonzalez, D. G., Park, S., Chen, Y., Lathrop, E., Cai, B., Xin, T., Zhao, H., Wang, S., et al. (2023) · eLife · doi:10.7554/elife.83444 · Cited by 34
Self-citationPeripheral mechanisms of peripheral neuropathic pain
Pacifico, P., Coy-Dibley, J. S., Miller, R. J., & Menichella, D. M. (2023) · Frontiers in Molecular Neuroscience · doi:10.3389/fnmol.2023.1252442 · Cited by 30
CXCL9, CXCL10, and CCL19 synergistically recruit T lymphocytes to skin in lichen planus
Kersh, A. E., Sati, S., Huang, J., Murphy, C. M., Ahart, O., & Leung, T. (2024) · JCI Insight · doi:10.1172/jci.insight.179899 · Cited by 28
Jin, S., & Ramos, R. (2022) · Biochemical Society Transactions · doi:10.1042/bst20210863 · Cited by 29
Vats, K., Tian, H., Singh, K., Tyurina, Y. Y., Sparvero, L. J., Tyurin, V. A., Kruglov, O., Chang, A., Wang, J., Green, F. M., et al. (2024) · Journal of Clinical Investigation · doi:10.1172/jci183219 · Cited by 26
Guo, T., Pei, F., Zhang, M., Yamada, T., Feng, J., Jing, J., Ho, T., & Chai, Y. (2024) · Cell stem cell · doi:10.1016/j.stem.2024.04.011 · Cited by 29
Liu, Y., Wang, P., Li, J., Chen, L., Shu, B., Wang, H., Liu, H., Zhao, S., Zhou, J., Chen, X., et al. (2024) · Burns & Trauma · doi:10.1093/burnst/tkae065 · Cited by 25
Transcriptomic landscape of early hair follicle and epidermal development
Sulic, A., Roy, R. D., Papagno, V., Lan, Q., Saikkonen, R., Jernvall, J., Thesleff, I., & Mikkola, M. L. (2023) · Cell Reports · doi:10.1016/j.celrep.2023.112643 · Cited by 24
Understanding Human Epidermal Stem Cells at Single-Cell Resolution
Negri, V. A., & Watt, F. M. (2022) · Journal of Investigative Dermatology · doi:10.1016/j.jid.2022.04.003 · Cited by 23
Cellular Heterogeneity and Plasticity of Skin Epithelial Cells in Wound Healing and Tumorigenesis
Wang, J., He, J., Zhu, M., Han, Y. Y., Yang, R., Liu, H., Xu, X., & Chen, X. (2022) · Stem Cell Reviews and Reports · doi:10.1007/s12015-021-10295-8 · Cited by 22
How and Why the Circadian Clock Regulates Proliferation of Adult Epithelial Stem Cells
D, B. A. M., Duan, J., & Karri, S. S. (2023) · Stem Cells · doi:10.1093/stmcls/sxad013 · Cited by 24
Gaydosik, A. M., Stonesifer, C. J., Tabib, T., Lafyatis, R., Geskin, L. J., & Fuschiotti, P. (2023) · JCI Insight · doi:10.1172/jci.insight.170015 · Cited by 22
Stem cell heterogeneity, plasticity, and regulation
Cui, Z., Wei, H., Goding, C. R., & Cui, R. (2023) · Life Sciences · doi:10.1016/j.lfs.2023.122240 · Cited by 21
Neumayer, G., Torkelson, J. L., Li, S., McCarthy, K., Zhen, H. H., Vangipuram, M., Mader, M. M.-D., Gebeyehu, G., Jaouni, T. M., Jackow, J., et al. (2024) · Nature Communications · doi:10.1038/s41467-024-49400-z · Cited by 30
Yan, L., Fan, D., Yang, J., Wang, J., Hu, X., Zhang, X., Huang, Y., Wang, H., Yin, W., Cai, X., et al. (2025) · Burns & Trauma · doi:10.1093/burnst/tkaf035 · Cited by 21
Tissue Mechanics in Haired Murine Skin: Potential Implications for Skin Aging
Harn, H. I., Chen, C., Wang, S., Lei, M., & Chuong, C. (2021) · Frontiers in Cell and Developmental Biology · doi:10.3389/fcell.2021.635340 · Cited by 18
Self-citationIdentification of the regulatory circuit governing corneal epithelial fate determination and disease
Smits, J. G. A., Cunha, D. L., Amini, M., Bertolin, M., Laberthonnìère, C., Qu, J., Owen, N., Latta, L., Seitz, B., Roux, L. N., et al. (2023) · PLoS Biology · doi:10.1371/journal.pbio.3002336 · Cited by 22
Ascensión, A. M., Araúzo-Bravo, M. J., & Izeta, A. (2022) · Life · doi:10.3390/life12010067 · Cited by 19
Melanoma cells repress Desmoglein 1 in keratinocytes to promote tumor cell migration
Burks, H. E., Pokorny, J. L., Koetsier, J. L., Roth‐Carter, Q. R., Arnette, C. R., Gerami, P., Seykora, J. T., Johnson, J. L., Ren, Z., & Green, K. J. (2023) · The Journal of Cell Biology · doi:10.1083/jcb.202212031 · Cited by 21
The use of ectopic volar fibroblasts to modify skin identity
Lee, S. S., Sweren, E., Dare, E., Derr, P., Derr, K., Wang, C. C., Hardesty, B., Willis, A. A., Chen, J., Vuillier, J., et al. (2024) · Science · doi:10.1126/science.adi1650 · Cited by 17
Microbial metabolites control self-renewal and precancerous progression of human cervical stem cells
Myeong, J., Lee, M.-H., Lee, B., Kim, J., Nam, Y., Choi, Y., Kim, J., Jeon, S. Y., Shim, H., Jung, D.-R., et al. (2025) · Nature Communications · doi:10.1038/s41467-025-57323-6 · Cited by 20
Building vs. Rebuilding Epidermis: Comparison Embryonic Development and Adult Wound Repair
Park, S. (2022) · Frontiers in Cell and Developmental Biology · doi:10.3389/fcell.2021.796080 · Cited by 22
Collagen XVII deficiency alters epidermal patterning
Wang, Y., Kitahata, H., Kosumi, H., Watanabe, M., Fujimura, Y., Takashima, S., Osada, S., Hirose, T., Nishie, W., Nagayama, M., et al. (2022) · Laboratory Investigation · doi:10.1038/s41374-022-00738-2 · Cited by 17
Decoding the Human Epidermal Complexity at Single-Cell Resolution
Polito, M. P., Marini, G., Palamenghi, M., & Enzo, E. (2023) · International Journal of Molecular Sciences · doi:10.3390/ijms24108544 · Cited by 18
Ishii, R., Yanagisawa, H., & Sada, A. (2020) · Development · doi:10.1242/dev.197590 · Cited by 15
New insights into inflammatory memory of epidermal stem cells
Cheng, D., Zhu, X., Yan, S., Shi, L., Liu, Z., Zhou, X., & Bi, X. (2023) · Frontiers in Immunology · doi:10.3389/fimmu.2023.1188559 · Cited by 18
Thalheim, T., & Schneider, M. R. (2024) · BMC Genomics · doi:10.1186/s12864-024-10008-8 · Cited by 16
Sun, P., Kraus, C. N., Zhao, W., Xu, J., Suh, S., Nguyen, Q., Jia, Y. Y., Nair, A., Oakes, M., Tinoco, R., et al. (2025) · Journal of Investigative Dermatology · doi:10.1016/j.jid.2025.08.022 · Cited by 25
Self-citationChen, Y., Wang, L., Huang, Z., Feng, J., Li, S., Du, Z., Zhang, Z., Liu, J., Yang, J., Hu, Z., et al. (2022) · Andrology · doi:10.1111/andr.13338 · Cited by 15
Negri, V. A., Louis, B., Zijl, S., Gânier, C., Philippeos, C., Ali, S., Reynolds, G., Haniffa, M. A., & Watt, F. M. (2023) · Stem Cell Reports · doi:10.1016/j.stemcr.2023.09.007 · Cited by 16
Skin in the game: a review of single-cell and spatial transcriptomics in dermatological research
Schepps, S., Xu, J., Yang, H. Y., Mandel, J. L., Mehta, J., Tolotta, J., Baker, N., Tekmen, V., Nikbakht, N., Fortina, P. M., et al. (2024) · Clinical Chemistry and Laboratory Medicine (CCLM) · doi:10.1515/cclm-2023-1245 · Cited by 18
Cellular heterogeneity and microenvironmental control of skin cancer
Lichtenberger, B. M., & Kasper, M. (2020) · Journal of Internal Medicine · doi:10.1111/joim.13177 · Cited by 16
Messa, L., Celegato, M., Bertagnin, C., Mercorelli, B., Alvisi, G., Banks, L., Palù, G., & Loregian, A. (2021) · Cancers · doi:10.3390/cancers13164083 · Cited by 15
LY6D marks pre-existing resistant basosquamous tumor subpopulations
Haensel, D., Gaddam, S., Li, N. Y., Gonzalez, F., Patel, T., Cloutier, J. M., Sarin, K. Y., Tang, J. Y., Rieger, K. E., Aasi, S. Z., et al. (2022) · Nature Communications · doi:10.1038/s41467-022-35020-y · Cited by 15
Strakosha, M., Vega‐Mendoza, D., Kane, J., Jain, A., Sun, L., Rockowitz, S., Elkins, M., Miyake, K., Chou, J. S., Karasuyama, H., et al. (2024) · Journal of Investigative Dermatology · doi:10.1016/j.jid.2023.12.024 · Cited by 14
Fu, Y. C., Das, A., Wang, D., Braun, R., & Yi, R. (2024) · Genome biology · doi:10.1186/s13059-024-03299-3 · Cited by 13
HPV18 E7 inhibits LATS1 kinase and activates YAP1 by degrading PTPN14
Blakely, W. J., Hatterschide, J., & White, E. A. (2024) · mBio · doi:10.1128/mbio.01811-24 · Cited by 14
Wu, Y., & Tang, F. (2025) · Genome biology · doi:10.1186/s13059-025-03639-x · Cited by 14
Synovial single-cell heterogeneity, zonation and interactions: a patchwork of effectors in arthritis
Schonfeldova, B., Zec, K., & Udalova, I. A. (2021) · Rheumatology · doi:10.1093/rheumatology/keab721 · Cited by 14
Isolating and cryopreserving pig skin cells for single-cell RNA sequencing study
Han, L., Jara, C. P., Wang, O., Shi, Y., Wu, X., Thibivilliers, S., Wóycicki, R. K., Carlson, M. A., Velander, W. H., ARAUJO, E. P. D., et al. (2022) · PLoS ONE · doi:10.1371/journal.pone.0263869 · Cited by 12
Jabbari, P., Kim, J. H., Le, B. H., Zhang, W., Zhang, H., & Martins‐Green, M. M. (2025) · Antioxidants · doi:10.3390/antiox14020214 · Cited by 13
Duan, S., Li, Q., Wang, F., Kuang, W., Dong, Y., Liu, D., Wang, J., Li, W., Chen, Q., Zeng, X. Y., et al. (2023) · The Journal of Immunology · doi:10.4049/jimmunol.2300312 · Cited by 13
Emergence and properties of adult mammalian epidermal stem cells
Gadre, P., Markova, P., Ebrahimkutty, M. P., Jiang, Y., Bouzada, F. M., & Watt, F. M. (2024) · Developmental Biology · doi:10.1016/j.ydbio.2024.07.014 · Cited by 14
SPRR1B+ keratinocytes prime oral mucosa for rapid wound healing via STAT3 activation
Xuanyuan, X., Zhang, L., Zheng, Y., Jiang, R., Ma, Y., Liu, R., Hou, P., Lei, M., Xu, H., & Zeng, H. (2024) · Communications Biology · doi:10.1038/s42003-024-06864-5 · Cited by 16
Sun, P., Kraus, C. N., Zhao, W., Xu, J., Suh, S., Nguyen, Q., Jia, Y. Y., Nair, A., Oakes, M., Tinoco, R., et al. (2024) · bioRxiv (Cold Spring Harbor Laboratory) · doi:10.1101/2024.08.14.607986 · Cited by 13
Self-citationDiversity of human skin three-dimensional organotypic cultures
Jia, Y. Y., & Atwood, S. X. (2024) · Current Opinion in Genetics & Development · doi:10.1016/j.gde.2024.102275 · Cited by 12
Self-citationIwashita, K., Suzuki, K., & Ojima, M. (2025) · Journal of Radiation Research · doi:10.1093/jrr/rraf052 · Cited by 13
A single-cell transcriptome atlas of Lueyang black-bone chicken skin
Wang, L., Xue, Z., Tian, Y., Zeng, W., Zhang, T., & Lu, H. (2024) · Poultry Science · doi:10.1016/j.psj.2024.103513 · Cited by 12
How can HPV E6 manipulate host cell differentiation process to maintain the reservoir of infection
Chen, Y., Egawa, N., Zheng, K., & Doorbar, J. (2025) · Tumour Virus Research · doi:10.1016/j.tvr.2025.200313 · Cited by 13
RIPK4 promotes epidermal differentiation through phase separation and activation of LATS1/2
Cao, X., Lu, Z., Fang, Y., Huang, F., Tang, M., Wu, B., Gao, L., Zhao, Y., Zhang, T., Zhu, Z., et al. (2025) · Developmental Cell · doi:10.1016/j.devcel.2025.05.017 · Cited by 13
Lloyd, S. M., Leon, D. B., Brady, M. O., Rodriguez, D., McReynolds, M. P., Kweon, J., Neely, A. E., Blumensaadt, L. A., Ho, P. J., & Bao, X. (2022) · Nature Communications · doi:10.1038/s41467-022-32098-2 · Cited by 11
Epidermal/Dermal Separation Techniques and Analysis of Cell Populations in Human Skin Sheets
Cichoń, M. A., & Elbe‐Bürger, A. (2022) · Journal of Investigative Dermatology · doi:10.1016/j.jid.2022.10.012 · Cited by 12
Epigenetic regulation and signalling pathways in Merkel cell development
Oss-Ronen, L., & Cohen, I. (2021) · Experimental Dermatology · doi:10.1111/exd.14415 · Cited by 14
Inflammatory Mediators Suppress FGFR2 Expression in Human Keratinocytes to Promote Inflammation
Ferrarese, L., Koch, M., Baumann, A., Bento‐Lopes, L., Wüst, D., Berest, I., Köpf, M., & Werner, S. (2024) · Molecular and Cellular Biology · doi:10.1080/10985549.2024.2399766 · Cited by 11
Cheng, B., Peng, S. I., Jia, Y. Y., Tong, E., Atwood, S. X., & Sun, B. K. (2025) · Cell Death and Disease · doi:10.1038/s41419-025-07691-0 · Cited by 10
Self-citationNguyen, T. M., & Aragona, M. (2021) · Seminars in Cell and Developmental Biology · doi:10.1016/j.semcdb.2021.09.008 · Cited by 11
Pfisterer, K., Wielscher, M., Samardzic, D., Weinzettl, P., Symmank, D., Shaw, L. E., Campana, R., Huang, H., Farlik, M., Bangert, C., et al. (2023) · Frontiers in Cell and Developmental Biology · doi:10.3389/fcell.2023.1240289 · Cited by 12
Basal Cells in the Epidermis and Epidermal Differentiation
Singh, R. (2022) · Stem Cell Reviews and Reports · doi:10.1007/s12015-021-10256-1 · Cited by 11
A scalable, GMP-compatible, autologous organotypic cell therapy for Dystrophic Epidermolysis BullosaPreprint
Neumayer, G., Torkelson, J. L., Li, S., McCarthy, K., Zhen, H. H., Vangipuram, M., Jackow, J., Rami, A., Hansen, C. S., Guo, Z., et al. (2023) · bioRxiv (Cold Spring Harbor Laboratory) · doi:10.1101/2023.02.28.529447 · Cited by 11
Fiškin, E., Eraslan, G., Alora, M. B., Leyva-Castillo, J. M., Kim, S., Choe, H., Lareau, C. A., Lau, H., Finan, E. P., Teixeira-Soldano, I., et al. (2023) · bioRxiv (Cold Spring Harbor Laboratory) · doi:10.1101/2023.10.29.563503 · Cited by 11
Metadata
- Authors
- Wang, S., Drummond, M. L., Guerrero-Juarez, C. F., Tarapore, E., MacLean, A. L., Stabell, A. R., Wu, S. C., Gutierrez, G., That, B. T., Benavente, C. A., Nie, Q., & Atwood, S. X.
- Affiliations
- University of California, Irvine (US)
- Corresponding author
- Nie, Qing
- Atwood, Scott X.
- ORCID
- Venue
- Nature Communications
- Published
- 2020-08-25
- Volume
- 11
- Issue
- 1
- Pages
- 4239-4239
- ISSN
- 2041-1723 (ISSN-L)
- PMC
- PMC7447770
- OpenAlex
- W3081219157
- Cited by
- 218
- References
- 131
- Citations by year
- 2026: 32 · 2025: 40 · 2024: 47 · 2023: 38 · 2022: 37 · 2021: 18 · 2020: 6
- FWCI
- 28.17
- Type
- journal article
- Language
- en
- Open access
- gold
- doi.org
- Locations
- Nature Communications (publishedVersion, cc-by)
- bioRxiv (Cold Spring Harbor Laboratory) (acceptedVersion)
- PubMed Central (publishedVersion, cc-by)
- PubMed (publishedVersion)
- RePEc: Research Papers in Economics (submittedVersion)
- DOAJ (DOAJ: Directory of Open Access Journals) (submittedVersion, cc-by-sa)
- eScholarship (California Digital Library) (submittedVersion)
- eScholarship (California Digital Library) (submittedVersion, cc-by)
- Funders
- Concern Foundation (CF204525)
- U.S. Department of Health & Human Services | National Institutes of Health (P30AR075047)
- Topics
- Health Sciences › Medicine › Dermatology › Hair Growth and Disorders
- Life Sciences › Biochemistry, Genetics and Molecular Biology › Molecular Biology › Single-cell and spatial transcriptomics
- Life Sciences › Biochemistry, Genetics and Molecular Biology › Cell Biology › Skin and Cellular Biology Research
- Keywords
- basal stem cells, interfollicular epidermis, epidermal stratification, epidermal homeostasis, intercellular communication, pseudotime, RNA velocity, skin equivalents, rete ridges
- MeSH terms
- Epidermal Cells, Cell Communication, Cell Differentiation, Epidermis, Gene Expression Regulation, Homeostasis, Humans, Infant, Newborn, Male, Models, Biological, Stem Cells, Signal Transduction, Keratinocytes, Cell Lineage, Gene Expression Profiling, Foreskin
About these checks
Registry, retraction, Cites and statistics results are computed, not judged, with one exception: a printed reference that no index lists is read once by a model before it counts as a citation error. Claims are extracted by a model and kept only when their quote appears verbatim in the text; each cited source is then checked, with a model’s help, for whether it says what the claim relies on. Those verdicts can be wrong — read the claim’s quote and the cited source before relying on one.
Statistics and arithmetic are recomputed, not judged.
Confidence bands are shown only for fields calibrated on our annotated test set. None is calibrated yet, so no band is shown.
What counts as a claim ›How we measure confidence ›How we check this ›
Are you an author, or do you see a problem with this page? Request a review
